

Inferring Causal Gene Regulatory Networks from Coupled Single-Cell Expression Dynamics Using Scribe
- PMID: 32135093
- PMCID: PMC7223477
- DOI: 10.1016/j.cels.2020.02.003
Inferring Causal Gene Regulatory Networks from Coupled Single-Cell Expression Dynamics Using Scribe
Abstract
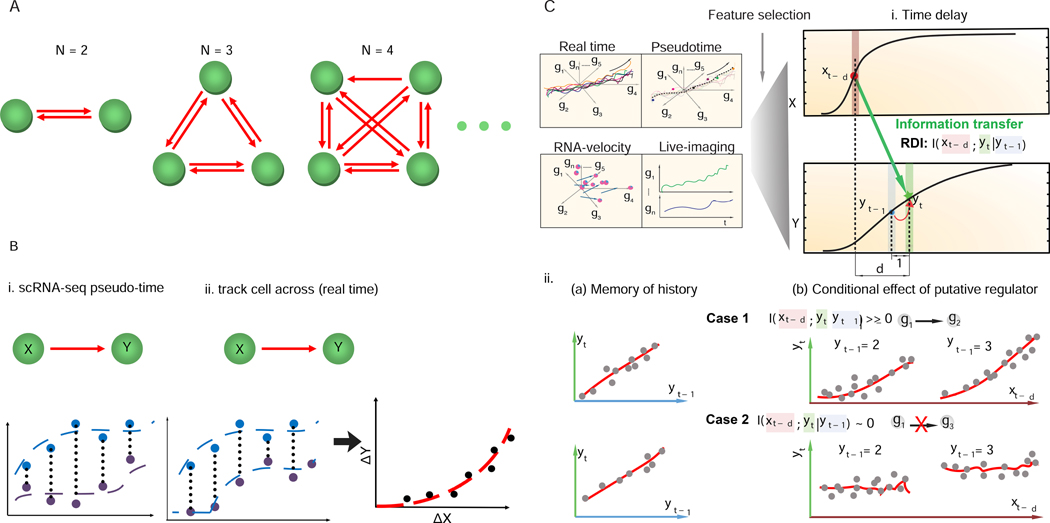
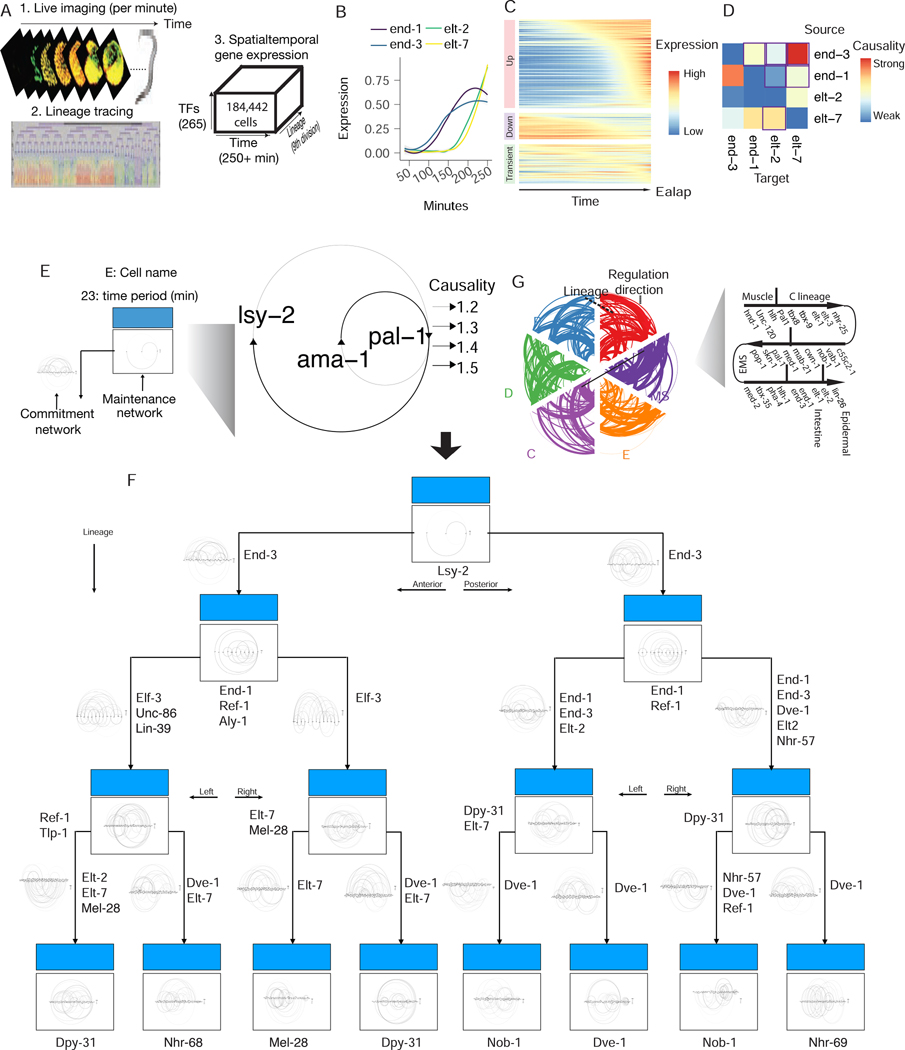
Here, we present Scribe (https://github.com/aristoteleo/Scribe-py), a toolkit for detecting and visualizing causal regulatory interactions between genes and explore the potential for single-cell experiments to power network reconstruction. Scribe employs restricted directed information to determine causality by estimating the strength of information transferred from a potential regulator to its downstream target. We apply Scribe and other leading approaches for causal network reconstruction to several types of single-cell measurements and show that there is a dramatic drop in performance for "pseudotime"-ordered single-cell data compared with true time-series data. We demonstrate that performing causal inference requires temporal coupling between measurements. We show that methods such as "RNA velocity" restore some degree of coupling through an analysis of chromaffin cell fate commitment. These analyses highlight a shortcoming in experimental and computational methods for analyzing gene regulation at single-cell resolution and suggest ways of overcoming it.
Keywords: RNA velocity; Scribe; causal network inference; coupled dynamics; gene regulatory network inference; pseudotime; real time; single-cell RNA-seq; single-cell trajectories; slam-seq.
Copyright © 2020 Elsevier Inc. All rights reserved.
Conflict of interest statement
Declaration of Interests The authors declare no competing interests.
Figures


Similar articles
-
Gene Regulatory Network Inference from Single-Cell Data Using Multivariate Information Measures.Cell Syst. 2017 Sep 27;5(3):251-267.e3. doi: 10.1016/j.cels.2017.08.014. Cell Syst. 2017. PMID: 28957658 Free PMC article.
-
Inference of Gene Co-expression Networks from Single-Cell RNA-Sequencing Data.Methods Mol Biol. 2019;1935:141-153. doi: 10.1007/978-1-4939-9057-3_10. Methods Mol Biol. 2019. PMID: 30758825
-
scGRN-Entropy: Inferring cell differentiation trajectories using single-cell data and gene regulation network-based transfer entropy.PLoS Comput Biol. 2024 Nov 25;20(11):e1012638. doi: 10.1371/journal.pcbi.1012638. eCollection 2024 Nov. PLoS Comput Biol. 2024. PMID: 39585902 Free PMC article.
-
A comprehensive survey of regulatory network inference methods using single cell RNA sequencing data.Brief Bioinform. 2021 May 20;22(3):bbaa190. doi: 10.1093/bib/bbaa190. Brief Bioinform. 2021. PMID: 34020546 Free PMC article. Review.
-
A single-cell multimodal view on gene regulatory network inference from transcriptomics and chromatin accessibility data.Brief Bioinform. 2024 Jul 25;25(5):bbae382. doi: 10.1093/bib/bbae382. Brief Bioinform. 2024. PMID: 39207727 Free PMC article. Review.
Cited by
-
Functional inference of gene regulation using single-cell multi-omics.Cell Genom. 2022 Sep 14;2(9):100166. doi: 10.1016/j.xgen.2022.100166. Epub 2022 Aug 4. Cell Genom. 2022. PMID: 36204155 Free PMC article.
-
CALISTA: Clustering and LINEAGE Inference in Single-Cell Transcriptional Analysis.Front Bioeng Biotechnol. 2020 Feb 4;8:18. doi: 10.3389/fbioe.2020.00018. eCollection 2020. Front Bioeng Biotechnol. 2020. PMID: 32117910 Free PMC article.
-
Decoding the principle of cell-fate determination for its reverse control.NPJ Syst Biol Appl. 2024 May 6;10(1):47. doi: 10.1038/s41540-024-00372-2. NPJ Syst Biol Appl. 2024. PMID: 38710700 Free PMC article.
-
Integrating Prior Knowledge Using Transformer for Gene Regulatory Network Inference.Adv Sci (Weinh). 2025 Jan;12(3):e2409990. doi: 10.1002/advs.202409990. Epub 2024 Nov 28. Adv Sci (Weinh). 2025. PMID: 39605181 Free PMC article.
-
Dissecting crosstalk induced by cell-cell communication using single-cell transcriptomic data.Nat Commun. 2025 Jul 1;16(1):5970. doi: 10.1038/s41467-025-61149-7. Nat Commun. 2025. PMID: 40593827 Free PMC article.
References
-
- Alon U (2007). Network motifs: theory and experimental approaches. Nat. Rev. Genet. 8, 450–461. - PubMed
-
- Babtie AC, Chan TE, and Stumpf MPH (2017). Learning regulatory models for cell development from single cell transcriptomic data. Current Opinion in Systems Biology 5, 72–81.
-
- Bar-Joseph Z, Gitter A, and Simon I (2012). Studying and modelling dynamic biological processes using time-series gene expression data. Nat. Rev. Genet. 13, 552–564. - PubMed
Publication types
MeSH terms
Substances
Grants and funding
LinkOut - more resources
Full Text Sources
Other Literature Sources
