

Oral Microbiota Profile Associates with Sugar Intake and Taste Preference Genes
- PMID: 32138214
- PMCID: PMC7146170
- DOI: 10.3390/nu12030681
Oral Microbiota Profile Associates with Sugar Intake and Taste Preference Genes
Abstract
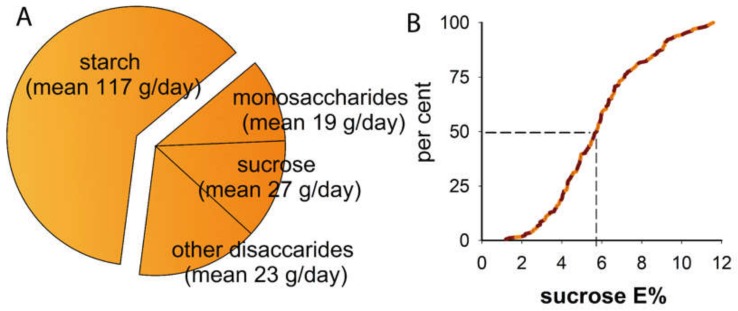
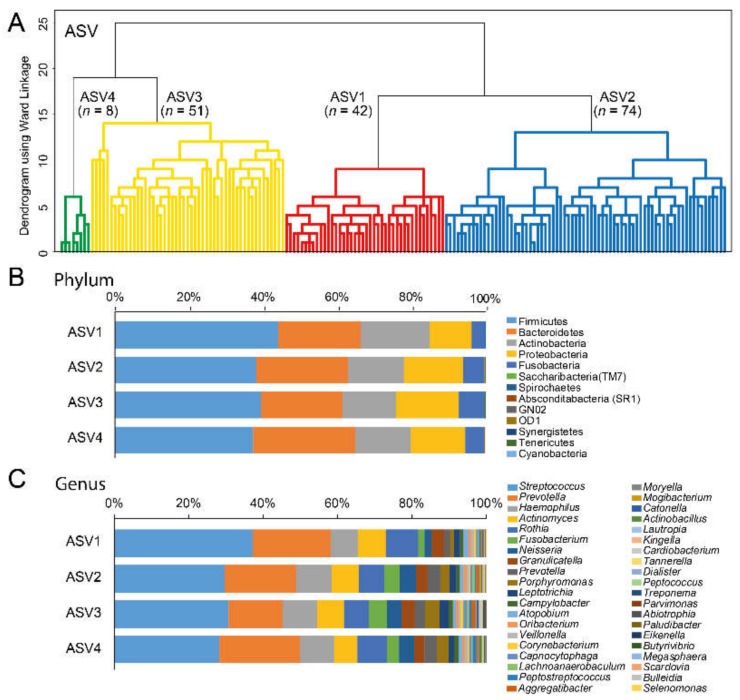
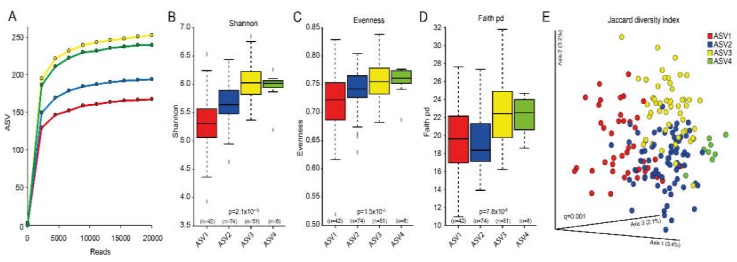
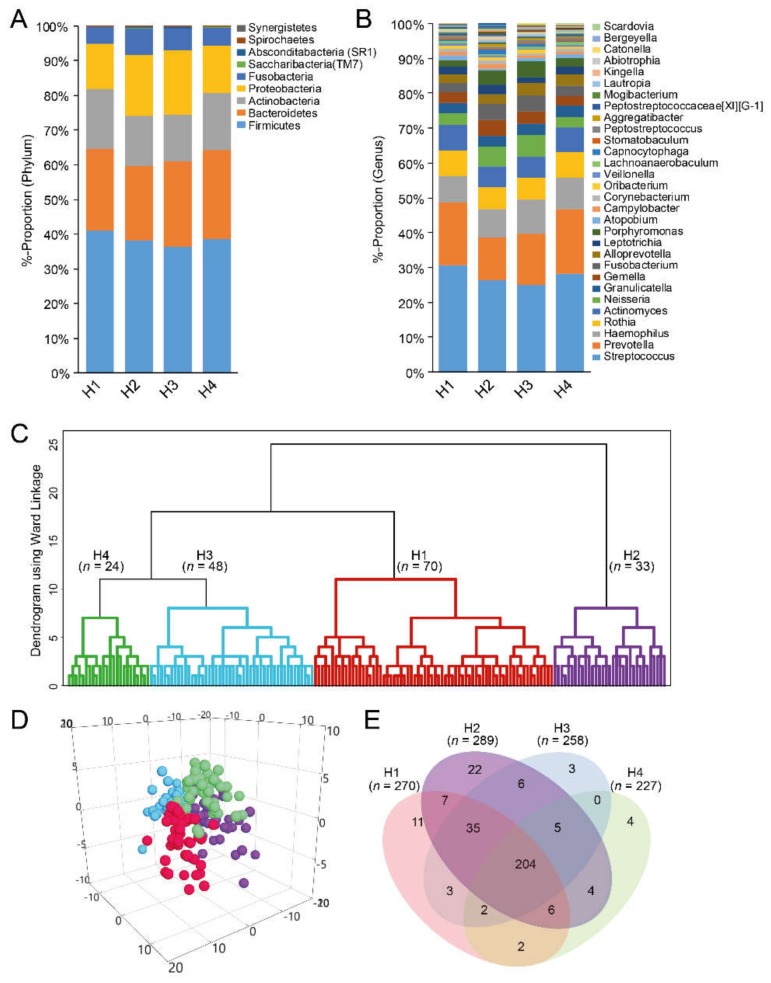
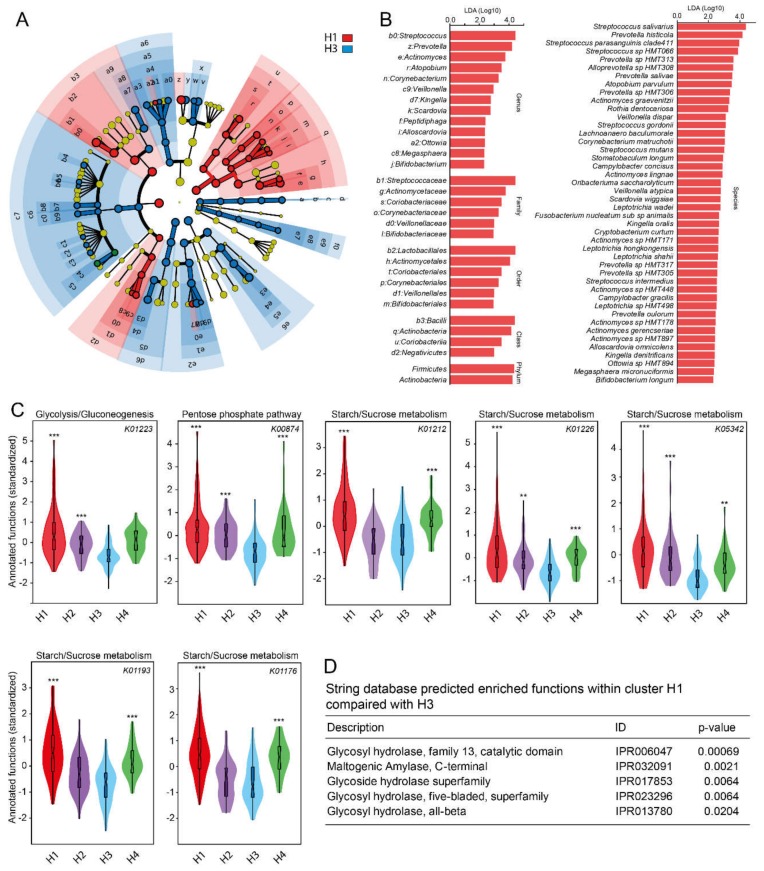
Oral microbiota ecology is influenced by environmental and host conditions, but few studies have evaluated associations between untargeted measures of the entire oral microbiome and potentially relevant environmental and host factors. This study aimed to identify salivary microbiota cluster groups using hierarchical cluster analyses (Wards method) based on 16S rRNA gene amplicon sequencing, and identify lifestyle and host factors which were associated with these groups. Group members (n = 175) were distinctly separated by microbiota profiles and differed in reported sucrose intake and allelic variation in the taste-preference-associated genes TAS1R1 (rs731024) and GNAT3 (rs2074673). Groups with higher sucrose intake were either characterized by a wide panel of species or phylotypes with fewer aciduric species, or by a narrower profile that included documented aciduric- and caries-associated species. The inferred functional profiles of the latter type were dominated by metabolic pathways associated with the carbohydrate metabolism with enrichment of glycosidase functions. In conclusion, this study supported in vivo associations between sugar intake and oral microbiota ecology, but it also found evidence for a variable microbiota response to sugar, highlighting the importance of modifying host factors and microbes beyond the commonly targeted acidogenic and acid-tolerant species. The results should be confirmed under controlled settings with comprehensive phenotypic and genotypic data.
Keywords: 16S rDNA sequencing; genes; microbiota; saliva; sugar; taste.
Conflict of interest statement
The authors declare no conflict of interest. The funders had no role in the design of the study; in the collection, analyses, or interpretation of data; in the writing of the manuscript, or in the decision to publish the results.
Figures
Similar articles
-
Allelic Variation in Taste Genes Is Associated with Taste and Diet Preferences and Dental Caries.Nutrients. 2019 Jun 29;11(7):1491. doi: 10.3390/nu11071491. Nutrients. 2019. PMID: 31261961 Free PMC article.
-
Using Oral Microbiota Data to Design a Short Sucrose Intake Index.Nutrients. 2021 Apr 21;13(5):1400. doi: 10.3390/nu13051400. Nutrients. 2021. PMID: 33919427 Free PMC article.
-
Taste genes associated with dental caries.J Dent Res. 2010 Nov;89(11):1198-202. doi: 10.1177/0022034510381502. Epub 2010 Sep 21. J Dent Res. 2010. PMID: 20858777 Free PMC article.
-
The Caries Microbiome: Implications for Reversing Dysbiosis.Adv Dent Res. 2018 Feb;29(1):78-85. doi: 10.1177/0022034517736496. Adv Dent Res. 2018. PMID: 29355414 Review.
-
The oral microbiome - friend or foe?Eur J Oral Sci. 2018 Oct;126 Suppl 1:5-12. doi: 10.1111/eos.12527. Eur J Oral Sci. 2018. PMID: 30178561 Review.
Cited by
-
Probiotics Partly Suppress the Impact of Sugar Stress on the Oral Microbiota-A Randomized, Double-Blinded, Placebo-Controlled Trial.Nutrients. 2023 Nov 17;15(22):4810. doi: 10.3390/nu15224810. Nutrients. 2023. PMID: 38004205 Free PMC article. Clinical Trial.
-
Standardization of the protocol for oral cavity examination and collecting of the biological samples for microbiome research using the next-generation sequencing (NGS): own experience with the COVID-19 patients.Sci Rep. 2024 Feb 14;14(1):3717. doi: 10.1038/s41598-024-53992-3. Sci Rep. 2024. PMID: 38355866 Free PMC article.
-
Alteration of taste perception, food neophobia and oral microbiota composition in children with food allergy.Sci Rep. 2023 Apr 28;13(1):7010. doi: 10.1038/s41598-023-34113-y. Sci Rep. 2023. PMID: 37117251 Free PMC article.
-
Oral-Gut Microbiota, Periodontal Diseases, and Arthritis: Literature Overview on the Role of Probiotics.Int J Mol Sci. 2023 Feb 27;24(5):4626. doi: 10.3390/ijms24054626. Int J Mol Sci. 2023. PMID: 36902056 Free PMC article. Review.
-
Unlocking Modifiable Risk Factors for Alzheimer's Disease: Does the Oral Microbiome Hold Some of the Keys?J Alzheimers Dis. 2023;92(4):1111-1129. doi: 10.3233/JAD-220760. J Alzheimers Dis. 2023. PMID: 36872775 Free PMC article. Review.
References
-
- Bibbo S., Ianiro G., Giorgio V., Scaldaferri F., Masucci L., Gasbarrini A., Cammarota G. The role of diet on gut microbiota composition. Eur. Rev. Med. Pharmacol. Sci. 2016;20:4742–4749. - PubMed
Publication types
MeSH terms
Substances
Grants and funding
LinkOut - more resources
Full Text Sources
Molecular Biology Databases
