. 2020 Apr;48(3):494-508.
doi: 10.1177/0192623320905803. Epub 2020 Mar 6.

Assessment of the Mode of Action Underlying the Effects of GenX in Mouse Liver and Implications for Assessing Human Health Risks

Affiliations

Assessment of the Mode of Action Underlying the Effects of GenX in Mouse Liver and Implications for Assessing Human Health Risks

Grace A Chappell et al. Toxicol Pathol. 2020 Apr.

Abstract

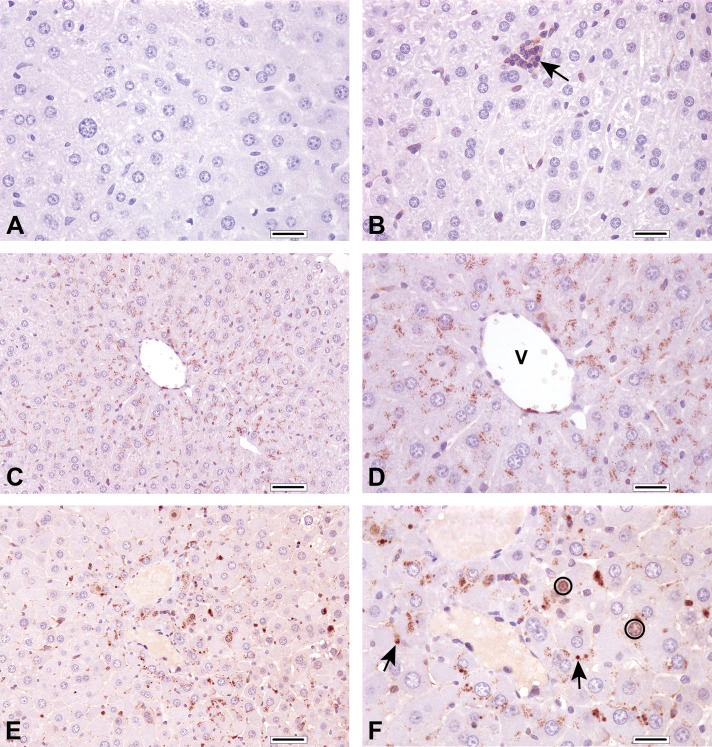
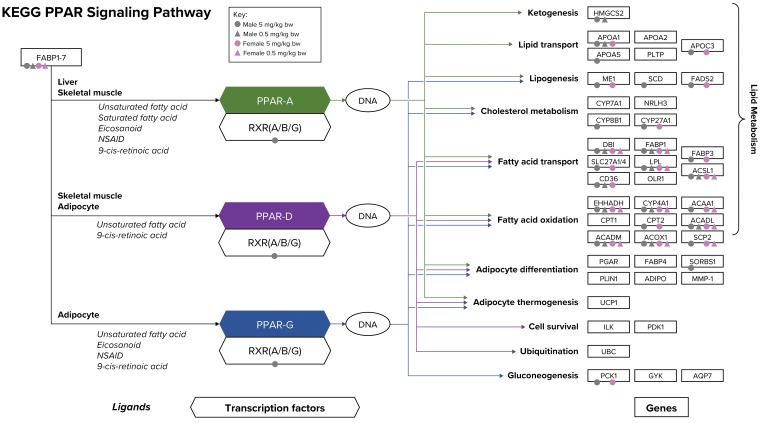
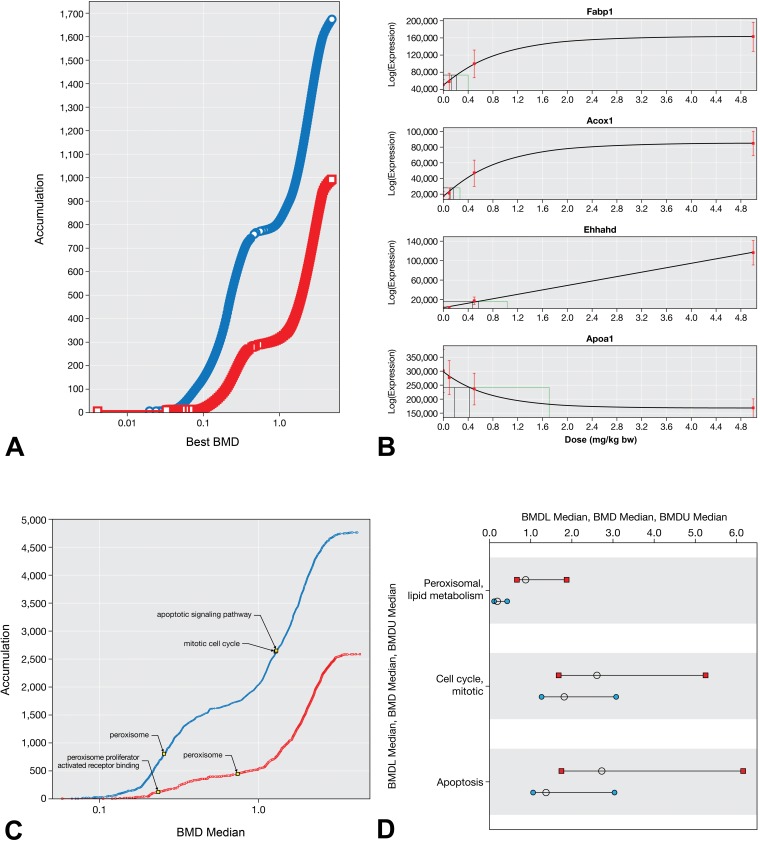
GenX is an alternative to environmentally persistent long-chain perfluoroalkyl and polyfluoroalkyl substances. Mice exposed to GenX exhibit liver hypertrophy, elevated peroxisomal enzyme activity, and other apical endpoints consistent with peroxisome proliferators. To investigate the potential role of peroxisome proliferator-activated receptor alpha (PPARα) activation in mice, and other molecular signals potentially related to observed liver changes, RNA sequencing was conducted on paraffin-embedded liver sections from a 90-day subchronic toxicity study of GenX conducted in mice. Differentially expressed genes were identified for each treatment group, and gene set enrichment analysis was conducted using gene sets that represent biological processes and known canonical pathways. Peroxisome signaling and fatty acid metabolism were among the most significantly enriched gene sets in both sexes at 0.5 and 5 mg/kg GenX; no pathways were enriched at 0.1 mg/kg. Gene sets specific to the PPARα subtype were significantly enriched. These findings were phenotypically anchored to histopathological changes in the same tissue blocks: hypertrophy, mitoses, and apoptosis. In vitro PPARα transactivation assays indicated that GenX activates mouse PPARα. These results indicate that the liver changes observed in GenX-treated mice occur via a mode of action (MOA) involving PPARα, an important finding for human health risk assessment as this MOA has limited relevance to humans.

Keywords: GenX; mode of action; perfluoroalkyl and polyfluoroalkyl substances (PFAS); peroxisome proliferator-activated receptor α (PPARα); single-cell necrosis; transcriptomics.


Conflict of interest statement

Declaration of Conflicting Interests: The author(s) declared the following potential conflicts of interest with respect to the research, authorship, and/or publication of this article: The authors include employees of ToxStrategies, Inc, a private consulting firm that provides services to private and public organizations for toxicology, epidemiology, and risk assessment issues. Authors also include scientists from Experimental Pathology Laboratories, a private contract research organization, as well as North Carolina State University and Indiana University. The work reported in this article was conducted during the normal course of employment. The authors (C.T. and L.H.) have presented study findings in meetings with regulators, including public meetings, on behalf of the Chemours Company FC, LLC.

Figures

Figure 1.
Figure 1.
Caspase-3 staining. A, Liver section from untreated male mouse stained with primary antibody replaced by nonspecific rabbit immunoglobulin G. B, Liver section from untreated male mouse stained for caspase-3. Note the faint cytoplasmic immunolabeling in Kupffer cells and leukocyte aggregates (arrow). C and D, Liver section from male mouse exposed to 0.5 mg/kg GenX at original objective ×20 (C) and original objective ×40 (D) magnification. Note the fine stippling of cytoplasm in hepatocytes with normal morphology, as well as the more pronounced staining in hepatocytes surrounding the central vein (V). This section was scored as grade 2. E and F, Liver section from male mouse exposed to 5 mg/kg GenX at original objective ×20 (E) and original objective ×40 (F) magnification. Note immunolabeling of the hepatocyte cytoplasm, plus labeling of variably sized spherical to irregular apoptotic bodies (arrows) and, rarely, hepatocyte nuclei (circled). This section was scored as grade 4. A, B, D, and F, Bar = 40 μm. C and E, Bar = 50 μm.
Figure 2.
Figure 2.
Network plots for gene set enrichment analysis. Network plot showing enriched upregulated canonical pathways for gene expression data from male mice exposed to 5 mg GenX/kg bw/d. For each pathway, significance is represented by the color shading scale of the nodes according to P value, and the number of genes in each pathway is represented by node size. Nodes are connected by lines that represent individual genes in the data set which are common to multiple nodes. The thickness of these connector lines represents the number of common genes. A P value of 5 × 10E-4 was used as a cutoff for the gene sets visualized to represent the topmost enriched gene sets.
Figure 3.
Figure 3.
The PPAR signaling network. Ligands, transcription factors, and genes as related to PPAR α/δ/γ signaling are shown according to the KEGG database. Individual genes that are significantly differentially expressed in the present study are notated by color-coded shapes according to sex (males = gray, females = pink) and concentration (5 mg/kg bw/d = circles, 0.5 mg/kg bw/d = triangles). Arrows corresponding to each PPAR family member show the target genes for that family member (α/δ/γ): green = PPARα, purple = PPARδ, and blue = PPARγ. Bw indicates body weight; KEGG, Kyoto Encyclopedia of Genes and Genomes; PPAR, peroxisome proliferator-activated receptor.
Figure 4.
Figure 4.
BMD analysis. A, Accumulation plots for best BMD values for DEGs in male (blue) and female (red) mice. B, Example BMD model fits for PPAR-related genes Fabp1, Acox1, Ehhahd, and Apoa1 in male liver. Models for each example visualization were chosen based on goodness of fit and biological plausibility. Full results including BMDs for all models for each gene are included in Supplemental Table S7. Red squares and whiskers represent mean and standard deviation, respectively, across all samples in the dose group. The drop-down lines in each plot represent the BMDL, BMD, and BMDU values. C, Accumulation plots for the BMD values for GO terms in male (blue) and female (red) mice. D, Range plots for the BMD, BMDL, and BMDU for select REACTOME pathways in male (blue) and female (red) mice. Selected terms in C and D are phenotypically linked to observed liver pathology. BMD indicates benchmark dose, BMDL, benchmark dose (lower confidence limit); BMDU, benchmark dose (upper confidence limit); DEG, differentially expressed gene; GO, Gene Ontology; PPAR, peroxisome proliferator-activated receptor; REACTOME, Reactome database of reactions, pathways, and biological processes.

References

    1. Lau C, Anitole K, Hodes C, Lai D, Pfahles-Hutchens A, Seed J. Perfluoroalkyl acids: a review of monitoring and toxicological findings. Toxicol Sci. 2007;99(2):366–394. - PubMed
    1. Buck RC, Franklin J, Berger U, et al. Perfluoroalkyl and polyfluoroalkyl substances in the environment: terminology, classification, and origins. Integr Environ Assess Manag. 2011;7(4):513–541. - PMC - PubMed
    1. Agency for Toxic Substances and Disease Registry. Toxicological Profile for Perfluoroalkyls (Draft for Public Comment) Atlanta, GA: US Department of Health and Human Services, Public Health Service; 2018.
    1. Olsen GW, Burris JM, Ehresman DJ, et al. Half-life of serum elimination of perfluorooctanesulfonate, perfluorohexanesulfonate, and perfluorooctanoate in retired fluorochemical production workers. Environ Health Perspect. 2007;115(9):1298–1305. - PMC - PubMed
    1. Gannon SAFWJ, Mawn MP, Nabb DL, et al. Absorption, distribution, metabolism, excretion, and kinetics of 2,3,3,3-tetrafluoro-2-(heptafluoropropoxy)propanoic acid ammonium salt following a single dose in rat, mouse, and cynomolgus monkey. Toxicology. 2016;340:1–9. - PubMed