. 2020 Mar 5;21(1):57.
doi: 10.1186/s13059-020-1950-6.

Decontamination of ambient RNA in single-cell RNA-seq with DecontX

Affiliations

Decontamination of ambient RNA in single-cell RNA-seq with DecontX

Shiyi Yang et al. Genome Biol. .

Abstract

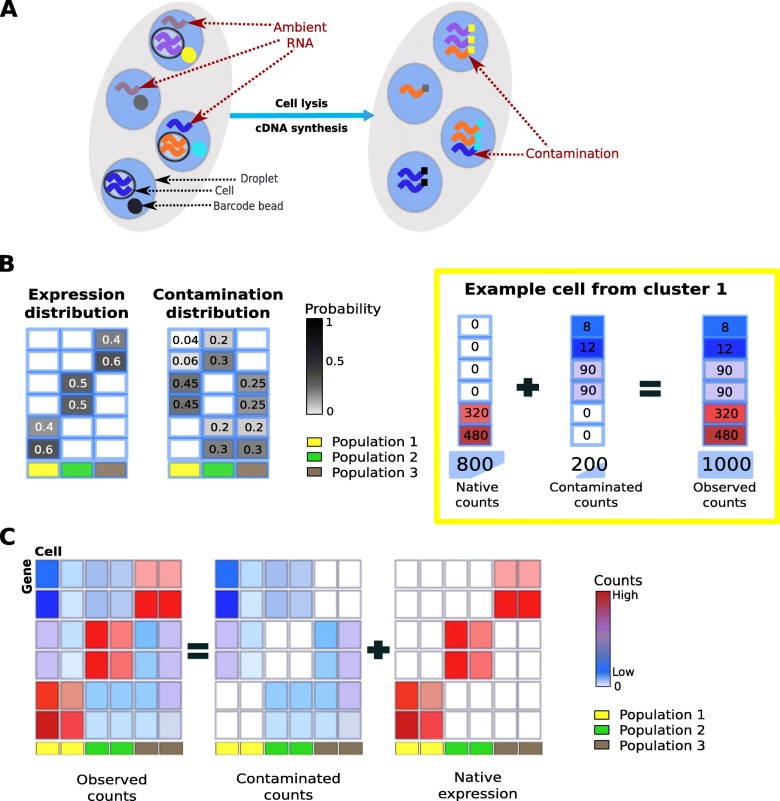
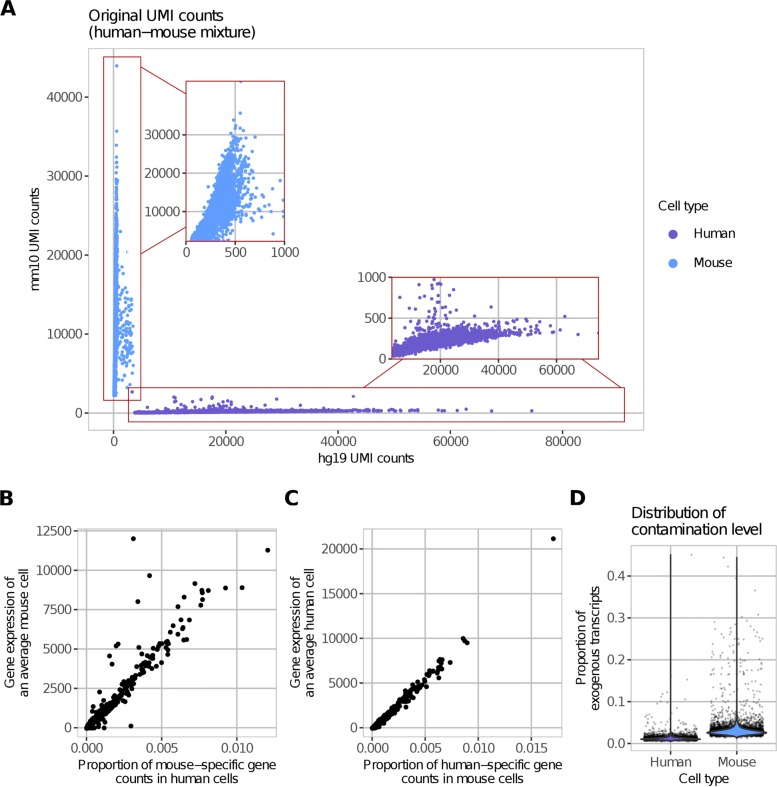
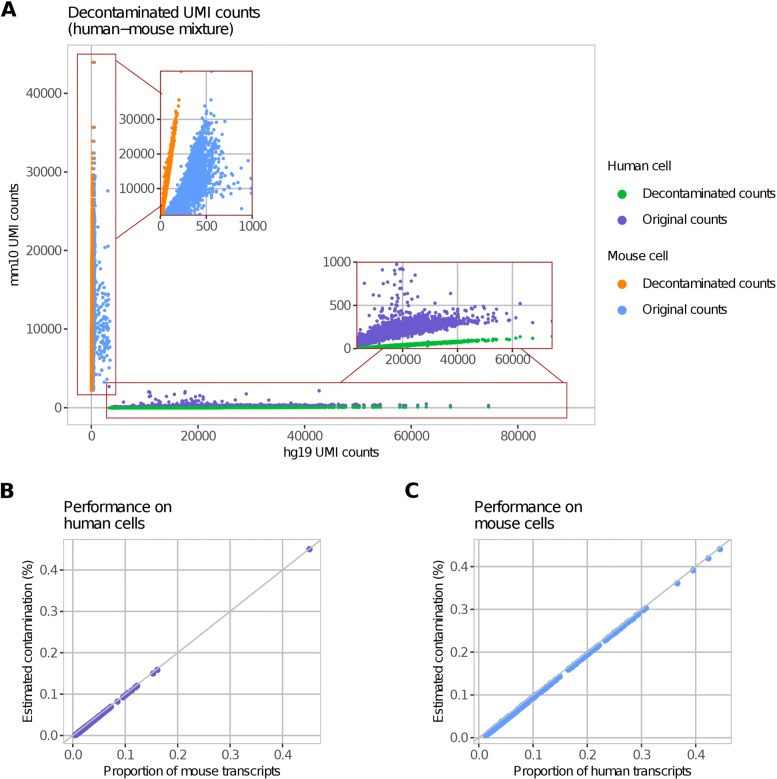
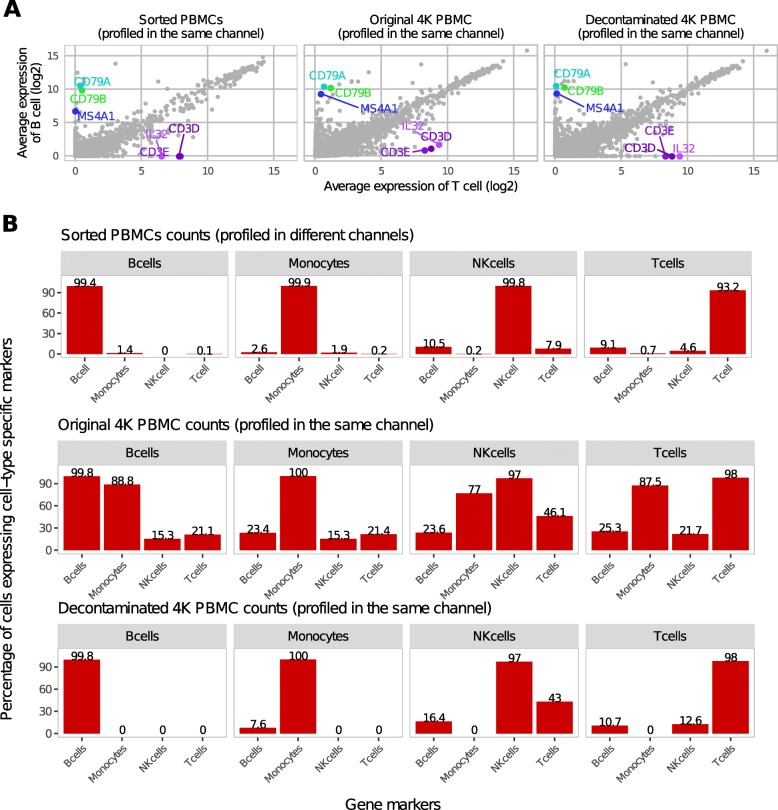
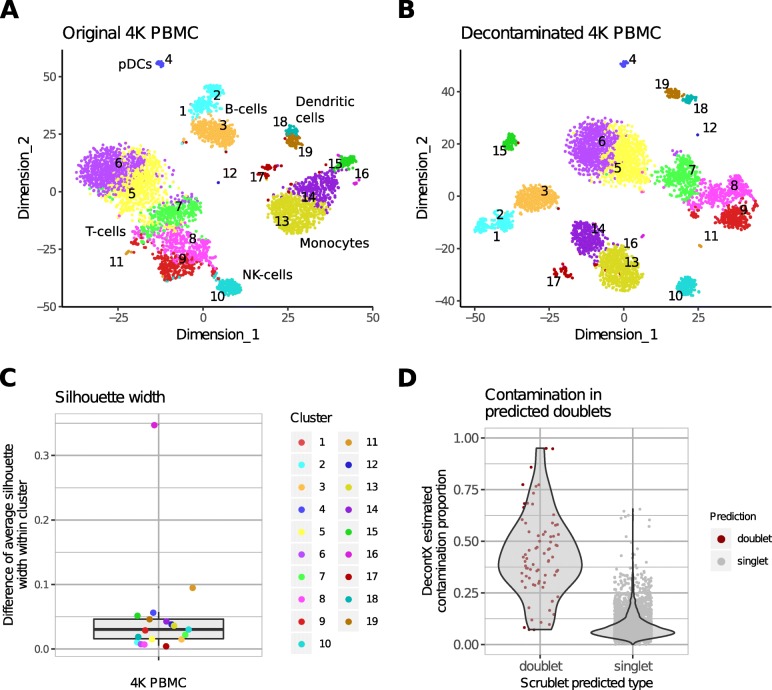
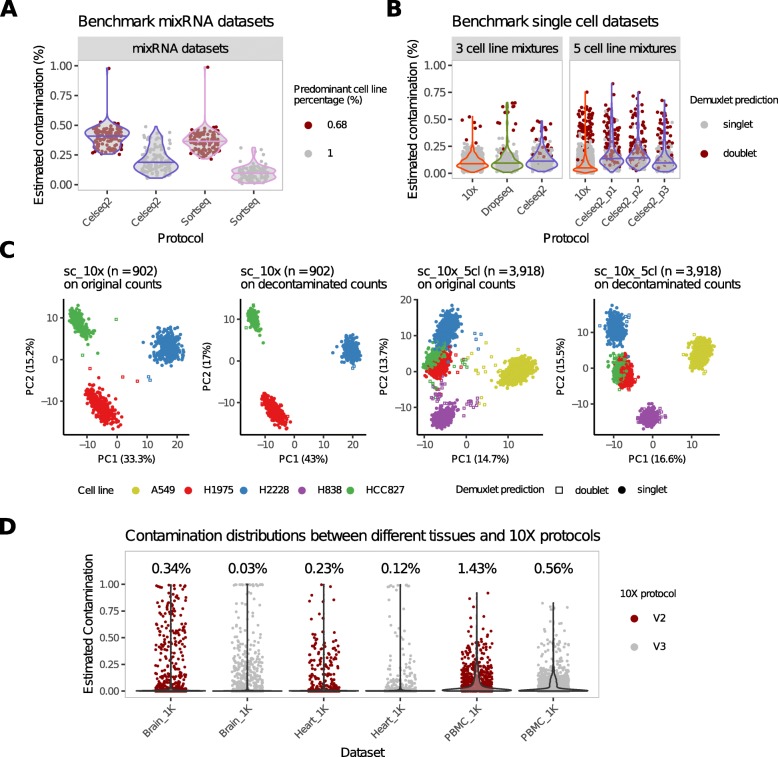
Droplet-based microfluidic devices have become widely used to perform single-cell RNA sequencing (scRNA-seq). However, ambient RNA present in the cell suspension can be aberrantly counted along with a cell's native mRNA and result in cross-contamination of transcripts between different cell populations. DecontX is a novel Bayesian method to estimate and remove contamination in individual cells. DecontX accurately predicts contamination levels in a mouse-human mixture dataset and removes aberrant expression of marker genes in PBMC datasets. We also compare the contamination levels between four different scRNA-seq protocols. Overall, DecontX can be incorporated into scRNA-seq workflows to improve downstream analyses.

Keywords: Bayesian mixture model; Decontamination; Single cell; scRNA-seq.


Conflict of interest statement

The authors declare that they have no competing interests.

Figures

Fig. 1
Fig. 1
Overview of decontamination with DecontX. a In droplet-based microfluidic devices, ambient RNA can be incorporated into droplets along with oligonucleotide-barcoded beads and cells. Both native mRNA from the cell and contaminating ambient RNA will be barcoded and counted within a droplet. b Left: DecontX assumes that each cell is a mixture of two multinomial distributions: (1) a distribution of native transcripts from the cell’s true population and (2) a distribution of contaminating transcripts from all other cell populations captured in the assay. Right: simulation of an example cell with 20% contamination. The 800 native transcripts are from the multinomial distribution for cell population 1 while the 200 contaminating transcripts are derived from a probability distribution that is a weighted combination of the 2 other populations. c DecontX will take an expression count matrix and cell cluster labels and estimate matrices of native expression and contamination from ambient RNA
Fig. 2
Fig. 2
Contamination in a human-mouse cell mixture dataset. a The total number of UMIs aligned specifically to the mouse or human genome is plotted for each droplet. b The proportion of counts for mouse genes in human cells is highly correlated to the average expression of these genes across all mouse cells indicating that the amount of contamination for each gene is proportional to how highly that gene is expressed in the contaminating cell population. c Similarly, the proportion of counts for human genes in the mouse cells is highly correlated to the average expression of those genes across all human cells. d While each droplet is predicted to contain a single cell, the median percentage of contamination for human and mouse cells is 1.09% and 2.75%, respectively. The range of contamination is 0.43–45.09% indicating the need for contamination estimation for each individual cell
Fig. 3
Fig. 3
Decontamination of the human-mouse cell mixture dataset. a The number of human UMIs is again plotted against the number of mouse UMIs for each droplet before and after decontamination with DecontX. After DecontX, the median percentage of contaminating counts for each droplet is 0.25% (0.12–0.75%). b, c DecontX-estimated contamination proportion is highly correlated to the known proportion of exogenous transcripts for each droplet predicted to have a human or mouse cell
Fig. 4
Fig. 4
Expression of cell type-specific marker genes before and after decontamination in PBMCs. a For each gene, the average expression in the B cell clusters is plotted against the average expression in T cell clusters for three different datasets: data from sorted PMBCs profiled in different channels (left), data from the PBMC 4K before decontamination (middle), and the PBMC 4K data after decontamination with DecontX (right). b Percentage of cells expressing specific marker genes for different cell types for three different datasets. Markers included CD79A, CD79B, and MS4A1 for B cells; CD3E and CD3D for T cells; GNLY for NK cells; and LYZ, S100A8, and S100A9 for monocytes
Fig. 5
Fig. 5
Cluster similarity before and after decontamination. a tSNE of 19 cell clusters from the PBMC 4K dataset before decontamination. b Decontamination with DecontX improved separation on tSNE between different cell clusters. c The mean silhouette width was derived for each cluster before and after decontamination with DecontX. Each point represents the difference in the mean silhouette width for each cluster. All clusters except 17 showed an increase in silhouette width after decontamination. Cluster 17 was predicted to contain mostly doublets by Scrublet. Cluster 1 had only one cell and was not included in the analysis. d Predicted doublets had significantly higher levels of estimated contamination compared to singlets. The median contamination for doublets was 41.77% (7.32–95.08%) while the median for singlets was 7.02% (0.07–65.64%)
Fig. 6
Fig. 6
Contamination levels for different scRNA-seq protocols, and contamination levels between different tissues and 10X platforms. a Distributions of DecontX-estimated contamination for psudo-cells generated by mixing RNA extracted from three cell lines in ratios of 68%, 16%, and 16% (red), or aliquoting 100% of RNA from one cell line (gray) which were sequenced in either CEL-seq2 or SORT-seq. b Distributions of DecontX-estimated contamination for three cell lines that were mixed and sequenced with the 10X Chromium, Drop-seq, or CEL-seq2 protocols. Additionally, five cell lines were mixed and sequenced using CEL-seq2 protocol in three distinct replicates. c The three-cell-line (left two columns) mixture dataset and the five-cell-line (right two columns) mixture dataset sequenced with 10X Chromium are shown on two dimensions using PCA with normalized counts with and without decontamination. Decontamination decreased within cluster variability while maintaining the overall relationships between clusters. d Distributions of DecontX-estimated contamination for cell types from three different tissues (mouse brain, mouse heart, and PBMC from a healthy donor) profiled using two chemistries (V2 and V3) using 10X Chromium

References

    1. Wang Y, Navin NE. Advances and applications of single-cell sequencing technologies. Mol Cell. 2015;58(4):598–609. doi: 10.1016/j.molcel.2015.05.005. - DOI - PMC - PubMed
    1. Ziegenhain C, Vieth B, Parekh S, Reinius B, Guillaumet-Adkins A, Smets M, Leonhardt H, Heyn H, Hellmann I, Enard W. Comparative analysis of single-cell RNA sequencing methods. Mol Cell. 2017;65(4):631–43. doi: 10.1016/j.molcel.2017.01.023. - DOI - PubMed
    1. Macosko EZ, Basu A, Satija R, Nemesh J, Shekhar K, Goldman M, Tirosh I, Bialas AR, Kamitaki N, Martersteck EM, et al. Highly parallel genome-wide expression profiling of individual cells using nanoliter droplets. Cell. 2015;161(5):1202–14. doi: 10.1016/j.cell.2015.05.002. - DOI - PMC - PubMed
    1. Zilionis R, Nainys J, Veres A, Savova V, Zemmour D, Klein AM, Mazutis L. Single-cell barcoding and sequencing using droplet microfluidics. Nat Protoc. 2017;12(1):44. doi: 10.1038/nprot.2016.154. - DOI - PubMed
    1. Zheng GX, Terry JM, Belgrader P, Ryvkin P, Bent ZW, Wilson R, Ziraldo SB, Wheeler TD, McDermott GP, Zhu J, et al. Massively parallel digital transcriptional profiling of single cells. Nat Commun. 2017;8:14049. doi: 10.1038/ncomms14049. - DOI - PMC - PubMed

Publication types

LinkOut - more resources