. 2020 Mar 6;367(6482):1091-1097.
doi: 10.1126/science.aay4106.

Microenvironment mapping via Dexter energy transfer on immune cells

Affiliations

Microenvironment mapping via Dexter energy transfer on immune cells

Jacob B Geri et al. Science. .

Abstract

Many disease pathologies can be understood through the elucidation of localized biomolecular networks, or microenvironments. To this end, enzymatic proximity labeling platforms are broadly applied for mapping the wider spatial relationships in subcellular architectures. However, technologies that can map microenvironments with higher precision have long been sought. Here, we describe a microenvironment-mapping platform that exploits photocatalytic carbene generation to selectively identify protein-protein interactions on cell membranes, an approach we term MicroMap (μMap). By using a photocatalyst-antibody conjugate to spatially localize carbene generation, we demonstrate selective labeling of antibody binding targets and their microenvironment protein neighbors. This technique identified the constituent proteins of the programmed-death ligand 1 (PD-L1) microenvironment in live lymphocytes and selectively labeled within an immunosynaptic junction.


Conflict of interest statement

Competing interests: J.B.G., J.V.O., T.W., R.C.O., O.O.F., and D.W.C.M. have filed a provisional U.S. patent application on this work.

Figures

Fig. 1.
Fig. 1.. High-resolution proximity-based labeling by using carbene intermediates.
Spatially precise labeling enables the construction of information-rich interaction networks. (Top) The resolution of proximity-based labeling is fundamentally limited by the long solution half-life (T1/2) of the reactive intermediates, such as phenoxyl radicals, used to label protein constituents of cell-membrane microenvironments. POI, Protein of interest. (Bottom) Using shorter-lived carbenes as reactive intermediates bypasses this limitation, enabling new applications in chemical biology.
Fig. 2.
Fig. 2.. Reaction design and catalyst development.
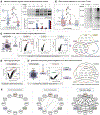
(A) Blue light does not directly activate diazirines, whereas UV light does. In this work, we used a photocatalyst excited by using visible light for photocatalytic, energy transfer-mediated diazirine activation. (B) Catalyst development. Screening catalysts with a range of triplet energies demonstrated that catalytic sensitization of diazirines was possible. Catalytic activity requires a triplet energy (ET) in excess of 60 kcal/mol, and catalysts with low triplet energies but high excited-state reduction or oxidation potentials were ineffective, suggesting an energy-transfer mechanism. Conversion was measured by means of 19F-nuclear magnetic resonance spectroscopy. E1/2, half-wave potential. (C) (Left) Western blot analysis of photocatalytic biotinylation of bovine serum albumin (BSA) by using a diazirine biotin conjugate (SDS-polyacrylamide gel electrophoresis, streptavidin blotting). Using light as a reagent enables fine temporal control over labeling of BSA. (Right) Short-duration illumination with light can be used to control the extent of labeling of BSA over time [streptavidin blot normalized against total protein stain; error bars are standard deviations calculated from three independent replicates (n = 3)].
Fig. 3.
Fig. 3.. μMapping on live cells.
(A) Western blot analysis of antibody-targeted μMapping of VEGFR2-Fc or EGFR-Fc on agarose beads shows spatially selective protein labeling of VEGFR2-Fc or EGFR-Fc. Error bars in barplot are the standard deviation calculated from three independent replicates (n = 3). (B) Western blot analysis of antibody-targeted μMapping of CD45 on Jurkat T cells. (C) Selective proximity labeling of the CD45, CD47, and CD29 microenvironments using μMap. Significantly [false discovery rate (FDR)-corrected P < 0.05] enriched membrane proteins in volcano plots are highlighted in red (CD45), gold (CD47), or blue (CD29), and nonmembrane proteins are in gray. Venn diagram analysis of highly enriched membrane proteins shows minimal overlap. (D) CD45 proximity labeling on Jurkat cells by using peroxidase does not resolve CD45 and known interactors (red dots) from other proteins, including CD29 and CD47. (E) μMapping the PD-L1 microenvironment on JY PD-L1 B cells to reveal putative interactors. Significantly (FDR-corrected P < 0.05) enriched membrane proteins are highlighted in orange, and nonmembrane proteins are in gray Labels show PD-L1 (orange), CD300A (green), and CD30 (purple) proteins. Venn diagram analysis of enriched membrane proteins shows overlap of PD-L1, CD300A, CD30, and nine other proteins. All volcano plots show averaged log2 ratios (targeted protein versus isotype) on the x axis (n = 3 replicates) and negative log10 transformed P values on the y axis. (F) String analysis of convergently enriched proteins.
Fig. 4.
Fig. 4.. Intra- and extrasynaptic μmapping within a two-cell system.
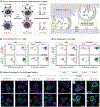
(A) Schematic depicting Jurkat (CD45RO+/PD-1+/CD3+) and JY (PD-L1+/CD19+) two-cell system enhanced by the presence of staphylococcal enterotoxin D (SED) for antibody targeting of intrasynaptic PD-L1 (expressed on JY cells) and extrasynaptic CD45RO (distinctly expressed on Jurkat cells) for selective trans or cis labeling. (B) Flow cytometry analysis of antibody targeting of PD-L1 on JY PD-L1 B cells with μMap by using 10-min light irradiation (left) shows both cis- and trans-cellular labeling. Peroxidase-based targeted labeling for 0.5 min (right) results in nearly complete cis- and trans-cellular labeling. (C) Flow cytometry analysis of antibody targeting of CD45RO on Jurkat T cells with μMap by using 10-min light irradiation (left) shows only cis-cellular labeling. Peroxidase-based targeted labeling for 0.5 min (right) results in nearly complete cis- and trans-cellular labeling. (D) Two-cell system confocal microscopy images of isotype-targeted (10-min light irradiation) or PD-L1-targeted (0.5-, 2-, or 10-min light irradiation) by using μMap (left) or isotype-targeted (1 min) or PD-L1-targeted (0.5 or 1 min) by using peroxidase-based labeling (right). Cells were imaged for biotinylation (green), CD3 surface expression (magenta), and nuclei (blue). Scale bar, 5 μm. Duplicate images are shown below each condition.

Comment in

References

    1. Lundberg E, Borner GHH, Nat. Rev. Mol. Cell Biol 20, 285–302 (2019). - PubMed
    1. Bauer NC, Doetsch PW, Corbett AH, Traffic 16,1039–1061 (2015). - PubMed
    1. Stanton BZ, Chory EJ, Crabtree GR, Science 359, eaao5902 (2018). - PMC - PubMed
    1. Minter RR, Sandercock AM, Rust SJ, Drug Discov. Today. Technol 23, 83–90 (2017). - PubMed
    1. Johnson DS, Mortazavi A, Myers RM, Wold B, Science 316, 1497–1502 (2007). - PubMed

Publication types