. 2020 Mar 5;11(1):1195.
doi: 10.1038/s41467-020-14764-5.

Vascular progenitors generated from tankyrase inhibitor-regulated naïve diabetic human iPSC potentiate efficient revascularization of ischemic retina

Affiliations

Vascular progenitors generated from tankyrase inhibitor-regulated naïve diabetic human iPSC potentiate efficient revascularization of ischemic retina

Tea Soon Park et al. Nat Commun. .

Abstract

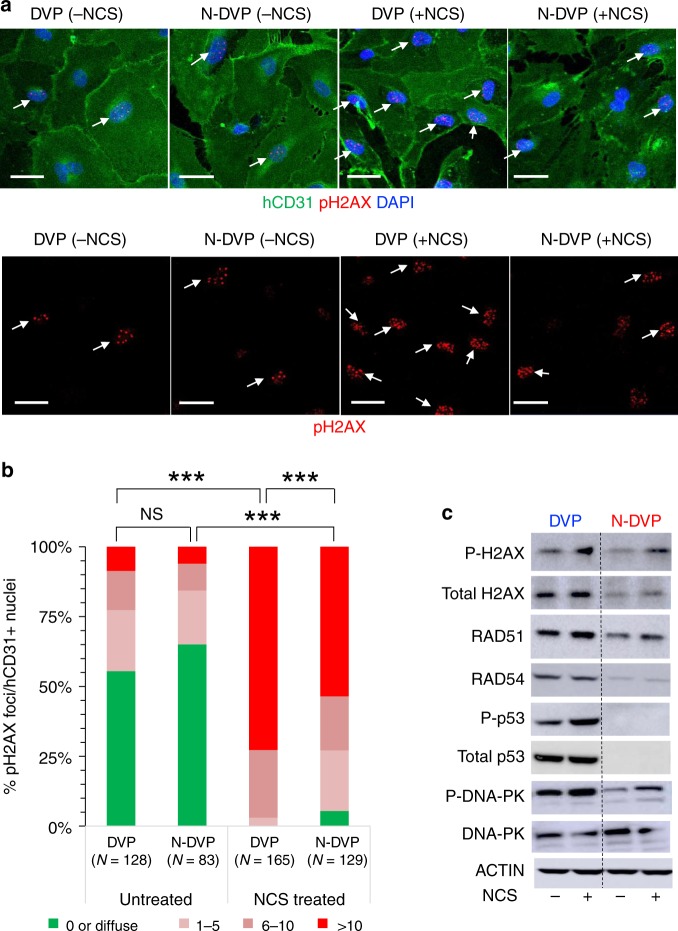
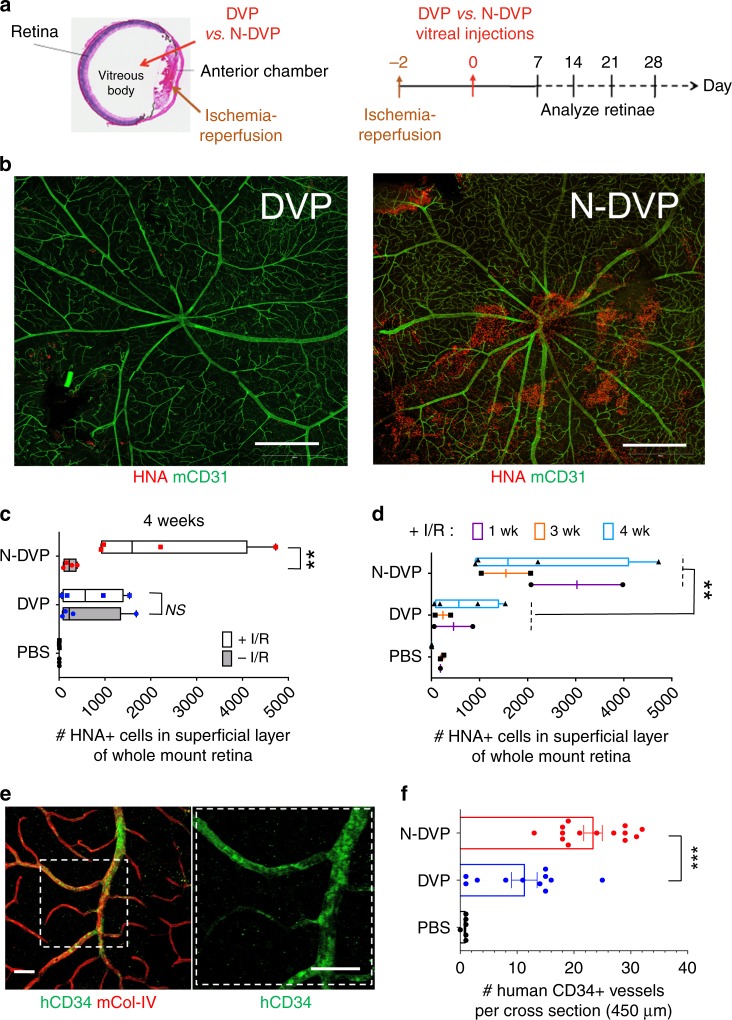
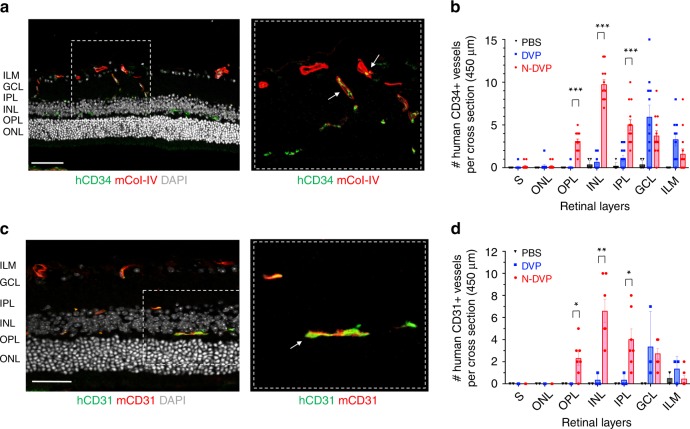
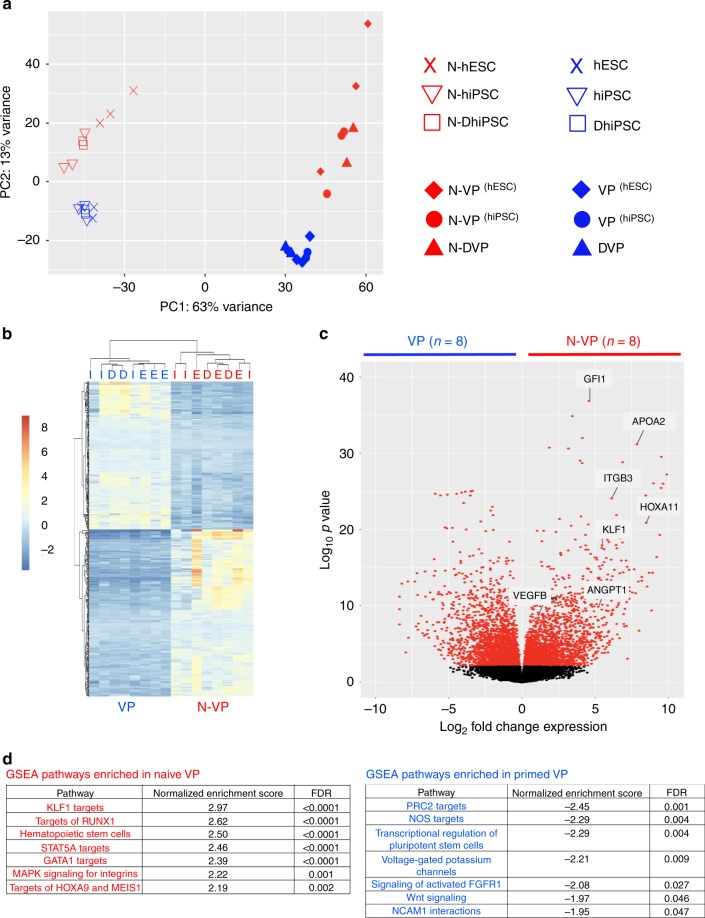
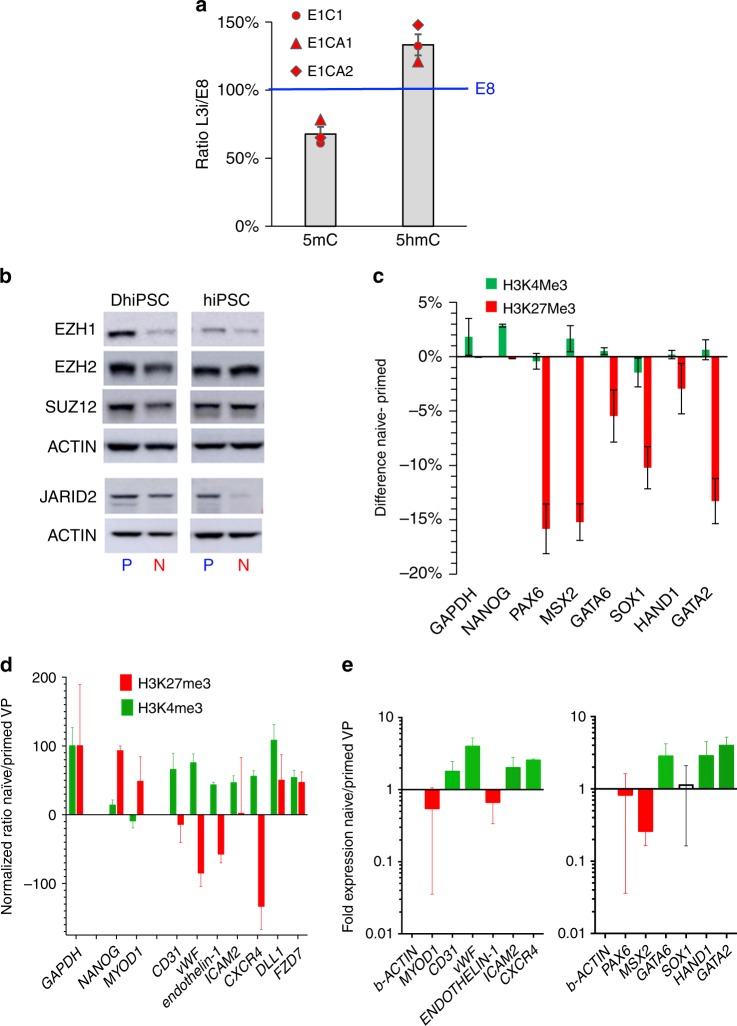
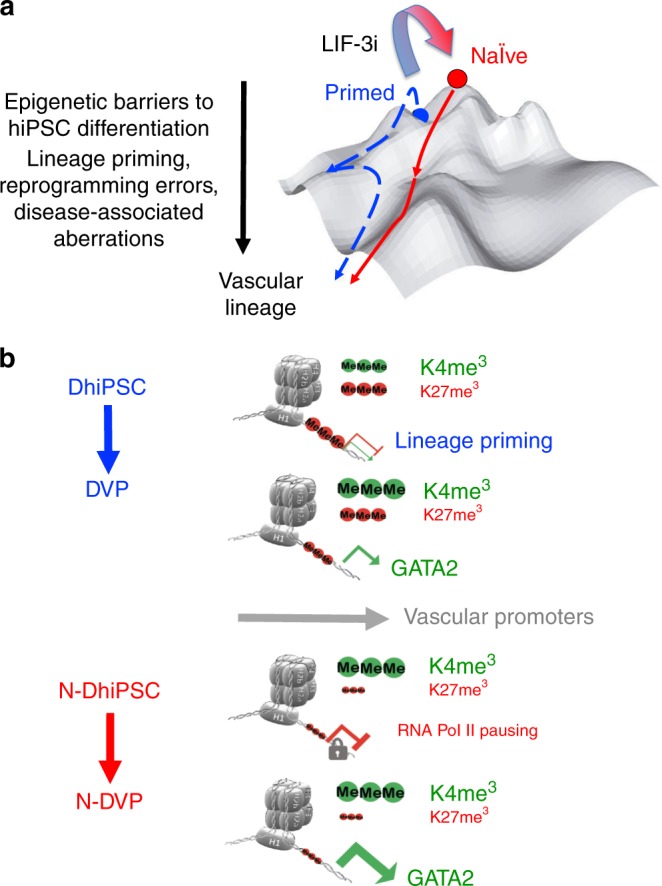
Here, we report that the functionality of vascular progenitors (VP) generated from normal and disease-primed conventional human induced pluripotent stem cells (hiPSC) can be significantly improved by reversion to a tankyrase inhibitor-regulated human naïve epiblast-like pluripotent state. Naïve diabetic vascular progenitors (N-DVP) differentiated from patient-specific naïve diabetic hiPSC (N-DhiPSC) possessed higher vascular functionality, maintained greater genomic stability, harbored decreased lineage-primed gene expression, and were more efficient in migrating to and re-vascularizing the deep neural layers of the ischemic retina than isogenic diabetic vascular progenitors (DVP). These findings suggest that reprogramming to a stable naïve human pluripotent stem cell state may effectively erase dysfunctional epigenetic donor cell memory or disease-associated aberrations in patient-specific hiPSC. More broadly, tankyrase inhibitor-regulated naïve hiPSC (N-hiPSC) represent a class of human stem cells with high epigenetic plasticity, improved multi-lineage functionality, and potentially high impact for regenerative medicine.


Conflict of interest statement

The authors declare no competing interests.

Figures

Fig. 1
Fig. 1. Teratoma organoid quantifications in isogenic non-diabetic hiPSC.
The non-diabetic human fibroblast-hiPSC line C1.2 (Supplementary Data 1) was cultured in parallel in either primed, conventional E8 (PRIMED; P) or LIF-3i/MEF (NAÏVE; N) conditions prior to parallel injections into sibling NOG mice (5 × 106 cells/site) for teratoma assays. Paraffin sections of 8 week-old N vs. P teratomas were evaluated and individual microscopic sections quantified by (a, b) H&E staining (cartilage (cart); neural rosettes (NR); retinal pigmented epithelium (RPE) (Scale Bar = 500 μm), or (c, d) Immunofluorescence (IF) staining (Scale Bar = 50 μm). Shown are individual tissue section measurements from at least 3 independent teratoma experiments quantified for organoid structures and markers of endodermal (Cytokeratin 8+ (CK8); gut/glandular structures), mesodermal (NG2+ chondroblasts), and ectodermal (SOX2+ neural rosettes) lineages along with the proliferation marker Ki-67. **p < 0.01; ***p < 0.001 (Mann-Whitney tests).
Fig. 2
Fig. 2. Characterization of primed vs. naïve DhiPSC.
a IF stains of N-DhiPSC (line E1C1) for general pluripotency factors (TRA-1-81, NANOG) and naïve pluripotency proteins (NR5A2, STELLA/DPPA3, E-CADHERIN; Scale Bar = 50 μm). b Primed (P) vs. naïve (N) phosphorylated-STAT3 (P-STAT3) expression. Western blots were performed of isogenic P vs. N lysates of (left panel) three independent DhiPSC lines (E1C1, E1CA1, E1CA2), or (right panel) two independent non-diabetic fibroblast-hiPSC lines (C1.2, C2). ACTIN and total STAT3 (T-STAT3) served as internal loading controls. c Naïve-specific protein expression of TFAP2C in DhiPSC (E1C1) in P vs. N conditions. d Isogenic teratoma organoid quantifications from DhiPSC (E1C1) cultured in primed (blue bar) vs. naïve (red bar) conditions. Shown are quantifications per cross section of mesodermal (NG2+ chondroblast), definitive endodermal (CK8+ gut/glandular cells), and ectodermal (SOX2+ neural rosettes; retinal pigmented epithelium) structures from H&E stained slides. **p < 0.01; ***p < 0.001 (Mann-Whitney tests). e Western blots of XAV939-inhibited proteolysis of tankyrases 1 and 2 (TANK ½) and AXIN-1 proteins in isogenic primed vs. naïve conditions from DhiPSC (E1C1), and non-diabetic hiPSC (E5C3) and hESC (H9).
Fig. 3
Fig. 3. Vascular differentiations of primed vs. naïve non-diabetic and diabetic hiPSC.
a Vascular-lineage differentiation of non-diabetic isogenic primed vs. naïve hiPSC (n = 5 lines; Supplementary Data 1). Shown are % cells quantitated by flow cytometry on Day 10 differentiation cultures expressing surface markers for endothelial-vascular progenitors (e.g., CD31+, CD34+, CD144+, CD31+CD146+, KDR+), pericytes (e.g., CD140b+, CD90+NG2+), angioblasts (e.g., CD105+, CD143+), and non-vascular-lineage markers (e.g., SSEA1+). *p < 0.05; **p < 0.01 (two-tailed unpaired t-tests). b Schematic of experimental design for CD31+CD146+ DVP differentiation of isogenic primed vs. naïve sibling hiPSC/DhiPSC. DhiPSC/hiPSC were directly differentiated (without need for an additional re-priming or capacitation step) in parallel APEL vascular conditions for 8–10 days. c Representative flow cytometry analyses of isogenic day 10 differentiations of (c) CD31+CD146+ VP vs N-VP from non-diabetic hESC (RUES02), and d CD31+CD146+ DVP vs N-DVP from diabetic hiPSC (E1C1). e Average percentages of CD31+CD146+ primed (blue) and naïve (red) VP cells obtained from isogenic day 8–10 differentiations of non-diabetic (E5C3) and diabetic hiPSC (E1CA1, E1CA2). *p < 0.05 (unpaired two-tailed t-tests). f TEM images of primed DVP and N-DVP differentiated and expanded from parallel primed and naïve isogenic conditions of the DhiPSC (E1C1). Weibel-Palade body (WPB), nucleus (n), transcytotic endothelial channel (TEC); Scale Bar = 400 nm.
Fig. 4
Fig. 4. Vascular functionality of primed vs. naïve VP.
a Endothelial function. Shown are representative flow cytometry (left panel) and immunofluorescent Dil-acetylated-LDL (Dil-Ac-LDL) endothelial uptake assays (right panel); merged phase contrast/ Ac-Dil-LDL-labeled primed DVP vs. N-DVP cells; Scale Bar = 100 μm. DVP cells were generated from primed vs. naïve isogenic DhiPSC line E1CA2. b Expanded (non-diabetic) VP and N-VP and (diabetic) DVP and N-DVP were quantitated for senescent cells by β-galactosidase activity colorimetric assay. Shown are independent isogenic comparisons of both non-diabetic primed VP and N-VP (i.e., generated from H9 hESC, E5C3 CB-hiPSC, C1.2, C2 fibroblast-hiPSC lines) and diabetic DVP and N-DVP (i.e., generated from E1CA1, E1CA2, E1C1 fibroblast-DhiPSC lines). Each quantitation is an independent measurement of EGM2 cultures at indicated matched passages for each VP and N-VP type. ***p < 0.001 (multiple unpaired t-tests). c Quantification of vascular tube lengths formed from in vitro Matrigel tube assays from primed non-diabetic VP (E5C3) and isogenic primed DVP vs. N-DVP (E1CA2). The number (n) of total measurements of each of the three experimental groups from 3–5 independent experiments per group is labeled. *p < 0.05 (unpaired t-tests).
Fig. 5
Fig. 5. DNA damage response of primed vs. naïve DVP.
a purified and expanded DVP or N-DVP (E1CA2) were treated with the radiomimetic drug NCS for 5 h before fixation and staining with antibodies for detection of human CD31+ cells and phosphorylated H2AX (pH2AX) positive nuclear foci (i.e., DAPI co-staining) to reveal double-strand DNA breaks (arrows); Scale Bar = 50 μm. b Quantification of pH2AX foci per nuclei in isogenic DVP vs. N-DVP with or without induction of NCS DNA damage. Shown are numbers of DAPI+ nuclei per field with no pH2AX foci (green), and DAPI+ nuclei with 1–5 foci (light pink), 6–10 (dark pink) and >10 pH2AX foci (red). ***p < 0.0001; Chi-Square tests (c) Lysates of primed DVP and N-DVP (E1C1) cultured in EGM2 and treated with (+) or without (−) NCS were analyzed by Western blotting for expressions of proteins activated by DNA damage and apoptosis (i.e., total H2AX and phosphorylated H2AX (P-H2AX), RAD51, RAD54, phosphorylated p53 (P-p53), total DNA-PK, and phosphorylated DNA-PK (P-DNA-PK).
Fig. 6
Fig. 6. Survival and vascular engraftment of primed vs. naïve DVP in I/R-injured murine retinae.
a Schematic of NOG mouse ocular I/R experimental system for testing in vivo functionality of human primed DVP vs. N-DVP (modified from Park et al., 2014). (left) Anatomical structures where I/R (anterior chamber) and human DVP and N-DVP cell injections (vitreous body) were performed (left panel). (right) Timeline for I/R injury surgery, human DVP injections (Day 0), human cell survival and engraftment analysis. b Human DVP survival at the superficial layer of murine retina at 3 weeks following injection of 50,000 DVP or N-DVP into the vitreous of I/R-treated NOG mouse eyes. Flat whole-mounted retinae were stained with antibodies for human-specific HNA (red), and tile scanned by confocal microscopic imaging (10x objective, 9 × 9 tiles). Shown are representative whole retinal images with HNA+ cells from primed DVP cell-injected (left panel) vs. N-DVP cell-injected (right panel) eyes. Scale bars = 500 μm. c Quantitation of HNA+ cells detected in the outer superficial layers of whole mount retinae following treatment of eyes with and without I/R, and injected with either primed DVP or N-DVP at (c) 4 weeks or (d) at 1, 3, and 4 weeks following DVP vs. N-DVP vs. control saline (PBS) injections, in eyes treated with and without I/R injury. Shown are the mean numbers from independent eye experiments of total HNA+ cells counted with imaging software per superficial layer of each whole-mounted retinae (whole field). **p < 0.01 (Mann-Whitney tests). e, f Human vascular engraftment into murine vessels. Whole-mounted retinae of I/R-injured eyes 2 weeks following DVP vs. N-DVP vs. PBS injections were immunostained with human CD34 (hCD34) to detect human endothelial engraftment. Antibodies for murine collagen type-IV (mCol-IV) were also employed to detect murine blood vessel basement membrane, and murine CD31 (mCD31) to detect murine endothelium. f The number of CD34+ human-murine chimeric vessels per 450 μm cross-section was quantitated via confocal microscopy and imaging software. Shown are results of independent measurements. ***p < 0.001 (unpaired t-tests).
Fig. 7
Fig. 7. Migration and vascular engraftment of primed vs. naïve DVP into ischemia-injured blood vessels of the neural retina.
Cross-sectioned retinae of I/R-injured eyes of NOG mice were immunostained with either human CD34 (a, b; hCD34) or human CD31 (c, d; hCD31) antibodies 2 weeks following DVP vs. N-DVP injections. Antibodies for murine collagen type-IV (mCol-IV) were also employed to detect murine blood vessel basement membrane, and murine CD31 (mCD31) detected murine endothelium. The number of b human CD34+ or d human CD31+ cells detected within transverse layers of the murine neural retina (per 450 μm retinal cross section) was quantitated with imaging software. Each data point represents a replicate individual 450 μm retinal cross section that was analyzed from I/R- treated eyes injected with saline (PBS), primed DVP or N-DVP. Human CD34+ or human CD31+ endothelial cell engraftment was enumerated in each distinct layer of neural retina shown; only N-DVP migrated into the inner nuclear layer (INL) while most of the primed DVP remained primarily in the superficial ganglion cell layer (GCL). ILM: inner limiting membrane, IPL: inner plexiform layer, outer nuclear layer (ONL), OPL: outer plexiform layer, S: segments. All scale bars = 50 μm. Each individual quantitation shown is an independent experimental measurement with (standard error of mean) SEM from an individually-immunostained cryosection for each of the three groups of injected mouse eyes (i.e., saline-PBS (n = 8), DVP (n = 3, CD31; n = 11, CD34), N-DVP (n = 7, CD31; n = 14, CD34). ***p < 0.001; **p < 0.01; *p < 0.05 (multiple unpaired t-tests).
Fig. 8
Fig. 8. Transcriptional profiling of primed vs. naïve VP from normal and diabetic hPSC.
a PCA of whole genome transcriptomes from RNA-Seq samples from primed VP/DVP vs. N-VP/DVP, and their parental isogenic hPSC lines (i.e., primed or naïve hESC-derived VP, primed or naïve hiPSC-derived VP, and primed or naïve DhiPSC-derived DVP). b Heatmap-cluster dendrogram of the top 500 most differentially expressed genes (Supplementary Data 4); hierarchical clustering (Euclidian distance) of isogenic primed vs. naïve VP RNA-Seq samples. Isogenic paired VP samples are same above (n=8; VP/DVP and N-VP/N-DVP). (hESC-derived VP or N-VP: ‘E’; hiPSC-derived VP or N-VP: ‘I’ ; DhiPSC-derived DVP or N-DVP: ‘D’). c Volcano plot of differentially expressed transcripts in whole genome of primed vs. naïve VP; log10 p-values vs. log2 fold change in expressions. RNA-Seq VP samples are same as in PCA above (n = 8). d GSEA of pathways enriched in primed VP/DVP vs. N-VP/N-DVP. Paired isogenic primed and naive VP samples used for analysis are same as PCA (n = 8).
Fig. 9
Fig. 9. Epigenetic configuration of bivalent and vascular-lineage-specific promoters in primed vs. naïve hiPSC and VP.
a Densitometric quantitation of dot immunoblots of genomic DNA samples for global levels of 5-methylcytosine (5mC) and 5-hydroxymethylcytosine (5hmC) in three isogenic pairs of primed vs. naïve DhiPSC. Immunoblot naïve/primed densitometric ratios were determined with ImageJ software at steady state conditions (200 ng), and normalized at 100% for E8 values. b Western blot analysis of PRC2 components (EZH1, EZH2, SUZ12, and JARID2) in primed vs. naïve normal (C1.2) and diabetic (E1C1) hiPSC lysates. c ChIP-qPCR for H3K27me3 and H3K4me3 histone marks at bivalent developmental promoters (e.g., PAX6, MSX2, GATA6, SOX1, HAND1, GATA2) in primed vs. naïve DhiPSC (E1C1). GAPDH and NANOG are controls for actively-transcribed genes. Data are presented as differences in percent input materials of naïve minus primed genomic DNA samples. Error bars represent the SEM of replicates. d ChIP-qPCR for H3K27me3 and H3K4me3 histone marks at vascular developmental promoters in primed vs. naïve VP genomic samples. Data are presented as GAPDH-normalized ratios of percent input materials between naïve and primed VP differentiated from DhiPSC (E1C1). Results are shown as ratios of expression of isogenic N-DVP vs. DVP for GATA2-regulated genes (CD31, vWF, endothelin-1, ICAM2) and genes regulated by histone marks that are known to effect vascular functionality (CXCR4, DLL1, FZD7). GAPDH served as housekeeping control gene; NANOG and MYOD1 represented control promoters that are normally repressed during vascular differentiation. e qRT-PCR gene expression analysis of vascular-lineage genes (left panel) and PRC2-regulated lineage-specific genes (right panel) in DVP vs. N-DVP that were differentiated from isogenic pairs of naïve vs. primed D-hiPSC (n = 3; E1C1, E1CA1, E1CA2). Fold changes are normalized to beta-actin expression.
Fig. 10
Fig. 10. Epigenetic model for improvement of multi-lineage differentiation by reversion of primed hiPSC to a naïve pluripotent state.
a Waddington landscape model for the epigenetic barriers posed by lineage priming, incomplete reprogramming, and disease-associated epigenetic aberrations in primed hiPSC (blue). These obstacles may be overcome with molecular reversion to a tankyrase/PARP inhibitor-regulated naïve epiblast-like state (red) possessing a developmentally naïve epigenetic configuration. b Compared to lineage-primed DhiPSC, N-DhiPSC possessed a de-repressed naïve epiblast-like epigenetic configuration at bivalent PRC2-regulated developmental promoters that was highly poised for non-biased, multi-lineage lineage specification.

References

    1. Lutty GA. Diabetic choroidopathy. Vis. Res. 2017;139:161–167. doi: 10.1016/j.visres.2017.04.011. - DOI - PMC - PubMed
    1. Zheng L, Gong B, Hatala DA, Kern TS. Retinal ischemia and reperfusion causes capillary degeneration: similarities to diabetes. Invest. Ophthalmol. Vis. Sci. 2007;48:361–367. doi: 10.1167/iovs.06-0510. - DOI - PubMed
    1. Joussen AM, et al. A central role for inflammation in the pathogenesis of diabetic retinopathy. FASEB J. 2004;18:1450–1452. doi: 10.1096/fj.03-1476fje. - DOI - PubMed
    1. Joussen AM, et al. Leukocyte-mediated endothelial cell injury and death in the diabetic retina. Am. J. Pathol. 2001;158:147–152. doi: 10.1016/S0002-9440(10)63952-1. - DOI - PMC - PubMed
    1. D'Amore PA. Mechanisms of retinal and choroidal neovascularization. Invest. Ophthalmol. Vis. Sci. 1994;35:3974–3979. - PubMed

Publication types

MeSH terms