. 2020 Mar 5;11(1):1220.
doi: 10.1038/s41467-019-14198-8.

Identification of region-specific astrocyte subtypes at single cell resolution

Affiliations

Identification of region-specific astrocyte subtypes at single cell resolution

Mykhailo Y Batiuk et al. Nat Commun. .

Abstract

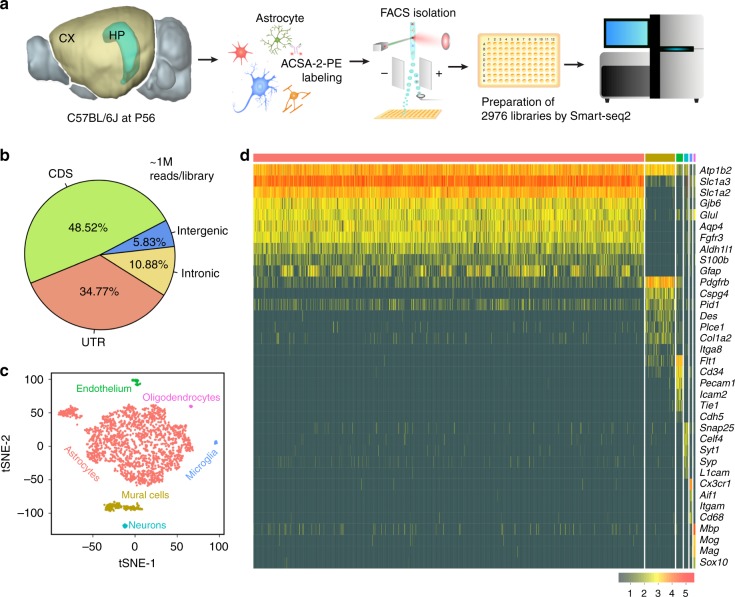
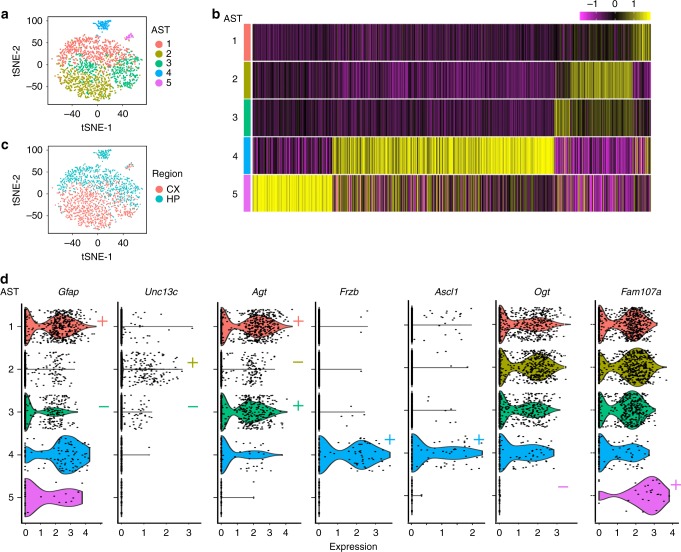
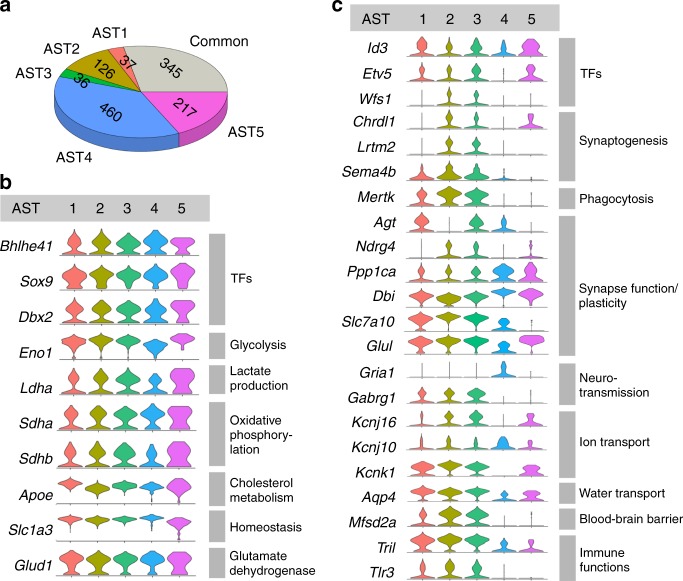
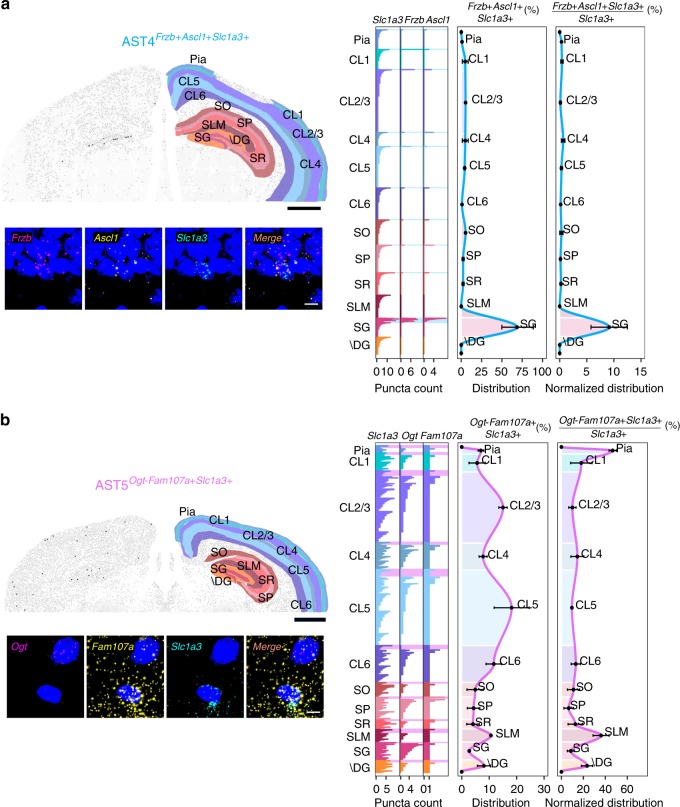
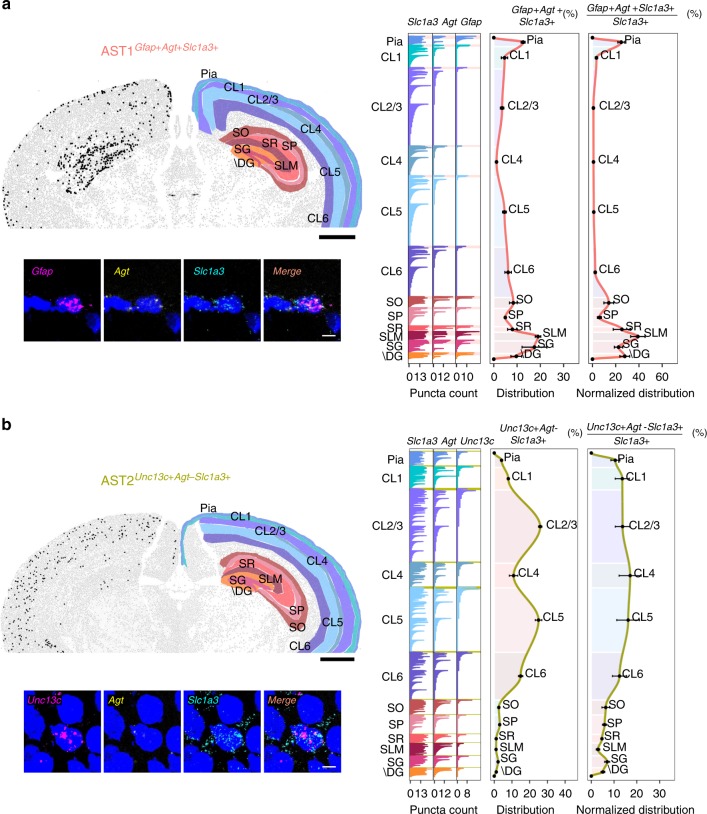
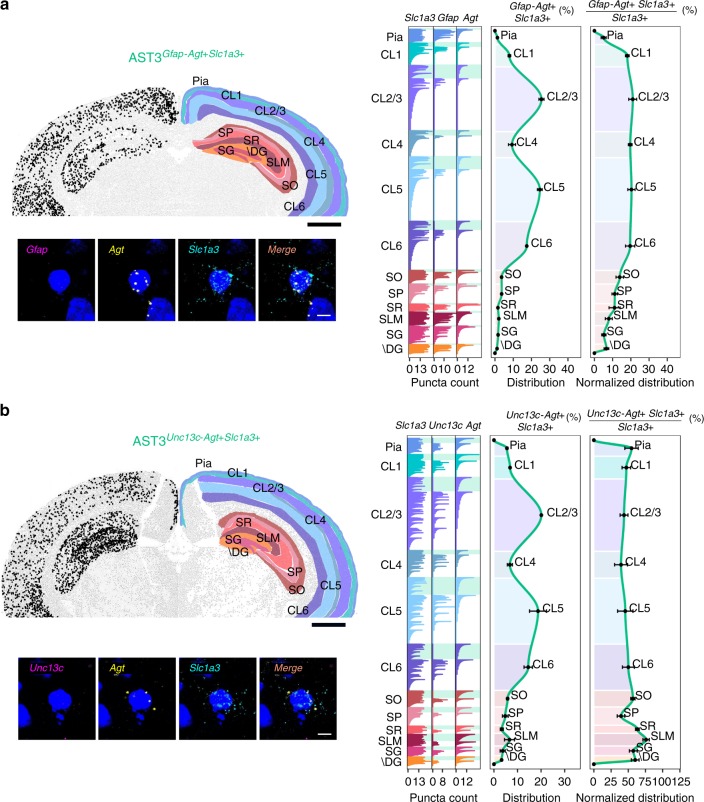
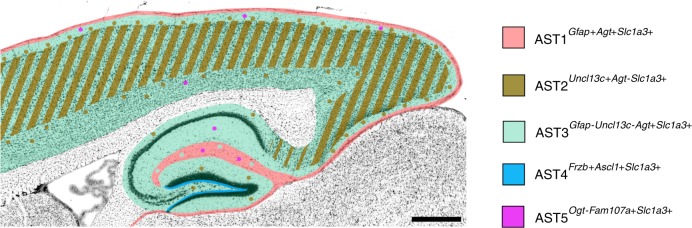
Astrocytes, a major cell type found throughout the central nervous system, have general roles in the modulation of synapse formation and synaptic transmission, blood-brain barrier formation, and regulation of blood flow, as well as metabolic support of other brain resident cells. Crucially, emerging evidence shows specific adaptations and astrocyte-encoded functions in regions, such as the spinal cord and cerebellum. To investigate the true extent of astrocyte molecular diversity across forebrain regions, we used single-cell RNA sequencing. Our analysis identifies five transcriptomically distinct astrocyte subtypes in adult mouse cortex and hippocampus. Validation of our data in situ reveals distinct spatial positioning of defined subtypes, reflecting the distribution of morphologically and physiologically distinct astrocyte populations. Our findings are evidence for specialized astrocyte subtypes between and within brain regions. The data are available through an online database (https://holt-sc.glialab.org/), providing a resource on which to base explorations of local astrocyte diversity and function in the brain.


Conflict of interest statement

T.G.B. is currently chief executive officer at The Bioinformatics CRO. The remaining authors declare no competing interests.

Figures

Fig. 1
Fig. 1. Single-cell sequencing strategy and cell-type identification.
a Whole brains were obtained from C57BL/6J mice at postnatal (P) day 56. Cortical (CX) and hippocampal (HP) astrocytes were prepared separately, using enzymatic digestion followed by mechanical trituration. Two separate batches of astrocytes for each region were prepared. Cortical cell suspensions were prepared from two littermate animals in parallel using separate tubes. Hippocampal cell suspensions were also prepared in parallel using separate tubes; in this case, two different sets of four littermate animals were used. Astrocytes were then specifically labeled with the ASCA-2-PE antibody and single cells were deposited in individual wells of a PCR plate using FACS. Single-cell library preparation was performed using a modified Smart-seq2 protocol. In total, 2976 libraries were prepared and sequenced using a NextSeq 500 system (Illumina). b Each library was sequenced to optimal coverage (on average 1 M reads per library). In total, 2015 high-quality libraries were retained for further analysis. In these libraries, a high fraction of reads mapped to exons (CDS, coding sequence; UTR, untranslated region). Conversely, a low fraction of reads mapped to intronic and intergenic regions. c Visualization of the major higher-order cell types (2015 cells) identified by Seurat using tSNE plots. Each dot represents a single cell. Cells with similar molecular profiles group together; cell types were assigned according to the expression of specific marker genes (and are labeled in different colors). d Gene expression heatmap for higher-order cell types (columns) grouped according to the Seurat classification shown in Fig. 1c. Color-coding from Fig. 1c is retained. Gray, no expression; yellow, low expression; red, high expression, In-normalized gene expression data is shown.
Fig. 2
Fig. 2. Identification of astrocyte subtypes in adult mouse cortex and hippocampus.
Single-cell data were used to identify distinct astrocyte subtypes (AST). a A total of 1811 astrocytes were identified from higher-order clustering. This data was extracted and reclustered using Seurat and five distinct astrocyte subtypes were identified. Clusters are presented in tSNE plots, with each AST color-coded. b Hierarchically clustered average gene expression heatmap for genes overexpressed across subtypes. Rows correspond to cells, columns to genes. Magenta, low gene expression; yellow, high expression. Scaled ln-normalized data are shown. c Astrocytes derived from the cortex (CX) or hippocampus (HP) segregate based on gene expression. d Expression of subtype-specific marker genes selected for in situ hybridization experiments. Markers are classed as absent/low “−” or highly expressed “+,” based on ln-normalized expression data. See also Supplementary Data.
Fig. 3
Fig. 3. Identification of common and differentially expressed genes in astrocytes.
a Chart showing the number of genes expressed in at least 60% of sampled astrocytes (common) and the number of genes specifically enriched in each subtype. b Examples of genes common across astrocyte subtypes, classified by biological function. TFs, transcription factors. c Examples of genes highly enriched in specific astrocyte subtypes, classified by biological function. Note, some genes, e.g. Gabrg1 (γ-aminobutyric acid type A receptor γ1 subunit), could be classified as either an ion channel or as involved in synaptic function/plasticity. Here, classification was based on the principal identified function—ion channel activity.
Fig. 4
Fig. 4. Differential patterning of AST4 and AST5 in adult mouse brain.
Multiplexed fluorescence in situ hybridization was used to map locations of AST4 and AST5. a AST4 was identified by high expression levels of Frzb, Ascl1, and Slc1a3. b AST5 was identified by absence/low expression of Ogt and high expression of both Fam107a and Slc1a3. Mapping was performed on three sections obtained from three independent animals aged between P56–P60. Representative images are shown. Top left: low-magnification image of a coronal section. Black dots show the distribution of the astrocyte subtype through one brain hemisphere. Brain regions are defined manually based on definitions from the Allen Brain Atlas. High-magnification images (below) show the localization of markers to specific cells defined on the basis of nuclear (DAPI, blue) staining. Right: bar plots (showing from left to right) fluorescence counts per RNA marker per cell (shown for all cells across all sections analyzed), the distribution of the subtype between brain regions and the distribution of the subtype normalized to the total number of astrocytes per brain region (all Slc1a3 + cells). Astrocytes belonging to the subtype of interest are highlighted by a shaded box (color-coded according to the scheme used in Fig. 2a). Astrocyte numbers across layers are given as average per section analyzed. Error bars are equivalent across the figure and represent SEM. Scale bars, low magnification 1000 µm; high magnification, 10 µm. “+” high gene expression, “−” low or absent gene expression. SO Stratum oriens, SP Stratum pyramidale, SR Stratum radiatum, SG Subgranular zone, \DG Dentate gyrus without SG, SLM Stratum lacunosum-moleculare.
Fig. 5
Fig. 5. Differential patterning of AST1 and AST2 in adult mouse brain.
Multiplexed fluorescence in situ hybridization was used to map locations of AST1 and AST2. a AST1 was identified by high expression levels of Gfap, Agt, and Slc1a3. b AST2 was identified by low expression/absence of Agt and high expression of both Unc13c and Slc1a3. Mapping was performed on three sections obtained from three independent animals aged between P56 and P60. Representative images are shown. Top left: low-magnification image of a coronal section. Black dots show the distribution of the astrocyte subtype through one brain hemisphere. Brain regions are defined manually based on definitions from the Allen Brain Atlas. High-magnification images (below) show the localization of markers to specific cells defined on the basis of nuclear (DAPI, blue) staining. Right: bar plots (showing from left to right) fluorescence counts per RNA marker per cell (shown for all cells across all sections analyzed), the distribution of the subtype between brain regions, and the distribution of the subtype normalized to the total number of astrocytes per brain region (all Slc1a3 + cells). Astrocytes belonging to the subtype of interest are highlighted by a shaded box (color-coded according to the scheme used in Fig. 2a). Astrocyte numbers across layers are given as average per section analyzed. Error bars are equivalent across the figure and represent SEM. Scale bars, low magnification 1000 µm; high magnification, 10 µm. “+” high gene expression, “−” low or absent gene expression. SO Stratum oriens, SP Stratum pyramidale, SR Stratum radiatum, SG Subgranular zone, \DG Dentate gyrus without SG, SLM Stratum lacunosum-moleculare.
Fig. 6
Fig. 6. Differential patterning of AST3 in adult mouse brain.
Multiplexed fluorescence in situ hybridization was used to map the location of AST3. Due to technical limitations, AST3 was mapped using a split marker approach. Sections were assessed for (a) low expression/absence of Gfap with expression of Agt and Slc1a3 (to differentiate AST3 from AST1) and (b) low expression/absence of Unc13c with expression of Agt and Slc1a3 (to discriminate between AST3 and AST2). Mapping was on three sections from three independent animals aged P56–P60. Representative images are shown. Top left: low-magnification image of a coronal section. Black dots show astrocyte subtype distribution through one hemisphere. Regions are defined manually based on the Allen Brain Atlas. High-magnification images (below) show the localization of markers to specific cells based on nuclear (DAPI, blue) staining. Right: bar plots (showing left to right) fluorescence counts per marker per cell (for all cells across all sections analyzed), the distribution of the subtype between brain regions and the distribution of the subtype normalized to the number of astrocytes per brain region (all Slc1a3 + cells). Astrocytes belonging to the subtype of interest are highlighted by a shaded box (color-coded according to the scheme used in Fig. 2a). Astrocyte numbers across layers are given as average per section analyzed. Error bars are equivalent across the figure and represent SEM. Scale bars, low magnification 1000 µm; high magnification, 10 µm. “+” high gene expression, “−” low or absent gene expression. SO Stratum oriens, SP Stratum pyramidale, SR Stratum radiatum, SG Subgranular zone, \DG Dentate gyrus without SG, SLM Stratum lacunosum-moleculare.
Fig. 7
Fig. 7. Schematic summary of astrocyte subtype positions in adult mouse brain.
Indicated positions are based on in situ hybridization data (Figs. 4–6) and are marked on a representative sagittal section of adult mouse brain (adapted from the Allen Mouse Brain Atlas). Subtypes are color-coded (as in Fig. 2a). Scale bar, 500 µm.
Fig. 8
Fig. 8. Astrocyte subpopulations display distinct Ca2+ transient properties.
Calcium transients in SR101-labeled astrocytes were detected using Fluo-4. Measurements were made in acute brain slices containing cortical layer 1 (L1), cortical layers 3–5 (L3–5), and the CA1 region of the hippocampus (CA1). Transients were recorded under sequential conditions of baseline activity (BASE), tetrodotoxin (TTX), and TTX plus phenylephrine (PHE). a Representative astrocytes (arrowheads) and the calcium transients recorded from them under each experimental condition. Scale bar, 50 µm. b The total population of active astrocytes was defined as cells responding to application of PHE. The fraction of this population displaying Ca2+ transients under BASE and TTX conditions is shown in blue. c Transient parameters grouped by the brain region recorded. Numerical values are the means for each condition. d Hierarchical clustering of Ca2+ transient parameters after application of PHE. e Proportion of astrocytes from the various brain regions per cluster defined in d. f Astrocyte peak parameters grouped per cluster. One dot equals one cell in c, d, and f. Plots in c and f show mean ± SD. Data normality was tested using a Shapiro–Wilk test. Significant differences were verified using a Kruskal–Wallis test with post-hoc Dunn’s test, with p-values adjusted with the Benjamini–Hochberg method. *p ≤ 0.05, **p ≤ 0.01, ***p ≤ 0.001. AUC area under the curve. Nine animals were used. In total, 614 cells were analyzed.

Similar articles

Cited by

References

    1. Barres BA. The mystery and magic of glia: a perspective on their roles in health and disease. Neuron. 2008;60:430–440. doi: 10.1016/j.neuron.2008.10.013. - DOI - PubMed
    1. Ramón y Cajal S. Histology of the Nervous System of Man and Vertebrates (Oxford Univ. Press, 1897).
    1. Khakh BS, Deneen B. The emerging nature of astrocyte diversity. Annu. Rev. Neurosci. 2019;42:187–207. doi: 10.1146/annurev-neuro-070918-050443. - DOI - PubMed
    1. Zeisel A, et al. Molecular architecture of the mouse nervous system. Cell. 2018;174:999–1014 e1022. doi: 10.1016/j.cell.2018.06.021. - DOI - PMC - PubMed
    1. Saunders A, et al. Molecular diversity and specializations among the cells of the adult mouse brain. Cell. 2018;174:1015–1030 e1016. doi: 10.1016/j.cell.2018.07.028. - DOI - PMC - PubMed

Publication types