. 2020 Mar 5;10(1):4080.
doi: 10.1038/s41598-020-60998-0.

Temporal changes in the gene expression heterogeneity during brain development and aging

Affiliations

Temporal changes in the gene expression heterogeneity during brain development and aging

Ulaş Işıldak et al. Sci Rep. .

Erratum in

Abstract

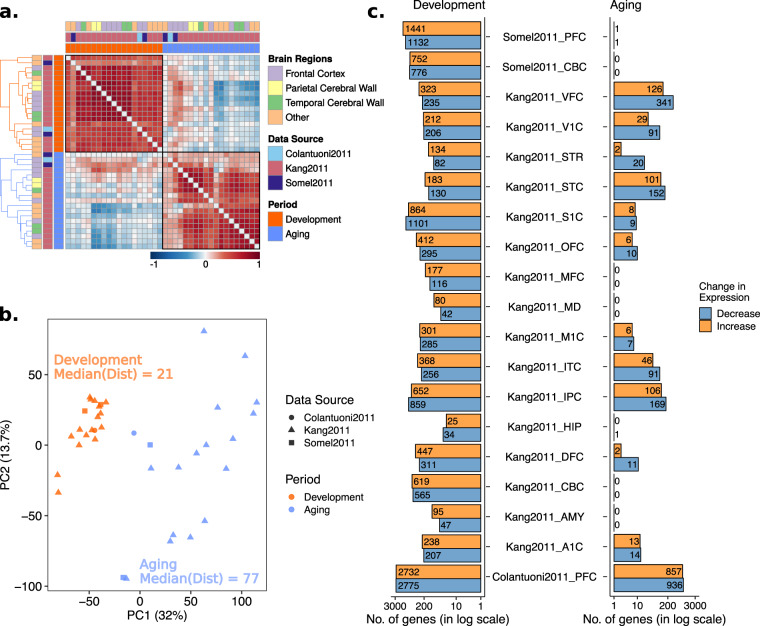
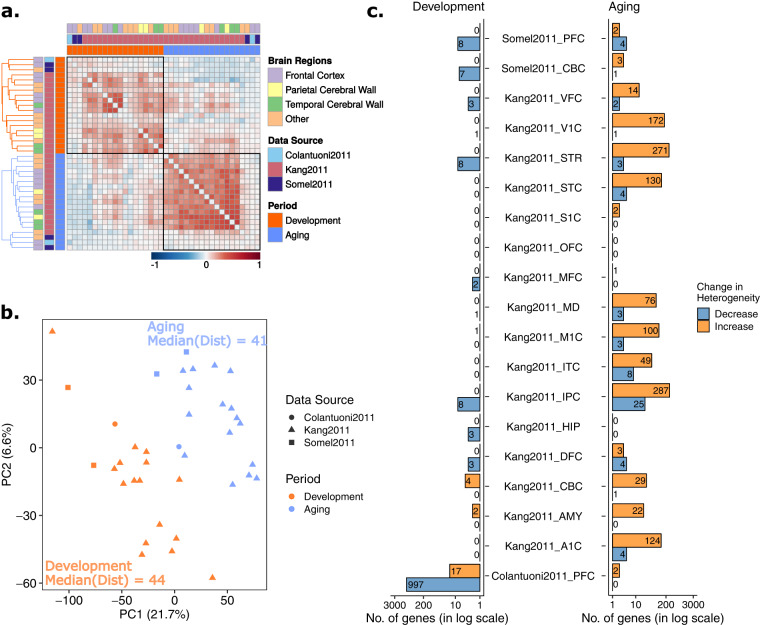
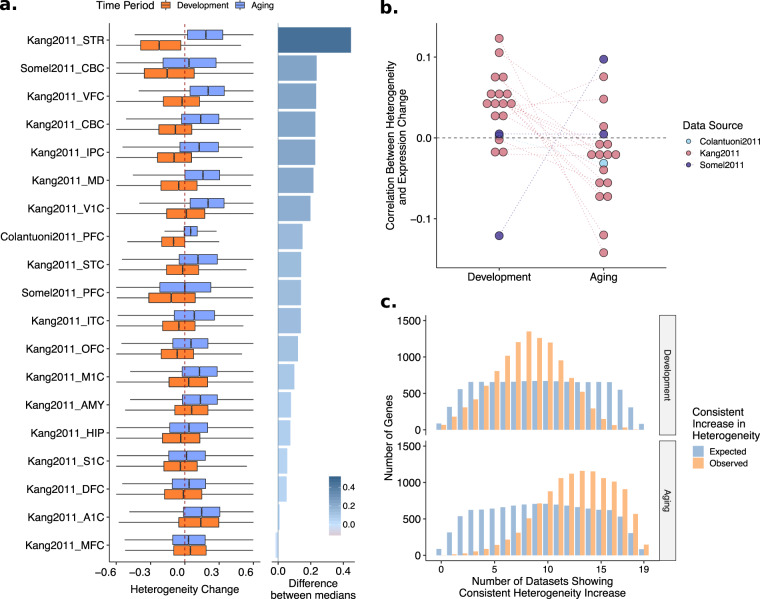
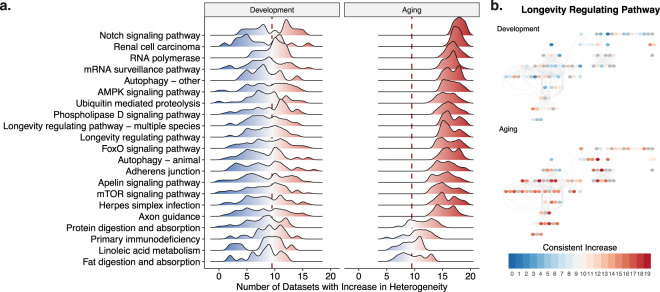
Cells in largely non-mitotic tissues such as the brain are prone to stochastic (epi-)genetic alterations that may cause increased variability between cells and individuals over time. Although increased inter-individual heterogeneity in gene expression was previously reported, whether this process starts during development or if it is restricted to the aging period has not yet been studied. The regulatory dynamics and functional significance of putative aging-related heterogeneity are also unknown. Here we address these by a meta-analysis of 19 transcriptome datasets from three independent studies, covering diverse human brain regions. We observed a significant increase in inter-individual heterogeneity during aging (20 + years) compared to postnatal development (0 to 20 years). Increased heterogeneity during aging was consistent among different brain regions at the gene level and associated with lifespan regulation and neuronal functions. Overall, our results show that increased expression heterogeneity is a characteristic of aging human brain, and may influence aging-related changes in brain functions.


Conflict of interest statement

The authors declare no competing interests.

Figures

Figure 1
Figure 1
Age-related change in gene expression during postnatal development and aging. (a) Spearman correlations among age-related expression changes (β values) across datasets. The color of the squares indicates if the correlation between the corresponding pair of datasets (across β values of 11,137 common genes) is positive (red) or negative (blue), while darker color specifies a stronger correlation. Diagonal values were removed in order to enhance visuality. Annotation rows and columns indicate data source, brain region and period of each dataset. Hierarchical clustering was performed for each period separately (color of the dendrogram indicates periods) to determine the order of datasets. (b) Principal component analysis (PCA) of age-related expression changes during aging and development. The analysis was performed on age-related expression change values of 11,137 common genes among all 38 datasets. The values of the first principal component on the x-axis and second principal component on the y-axis were drawn, where the values in the parenthesis indicate the variation explained by the corresponding principal component. Median Euclidean pairwise distances among development and aging datasets calculated using PC1 and PC2 were annotated on the figure. Different shapes show different data sources and colors show development (dark orange) and aging (blue) (c) Number of significant (FDR corrected p < 0.05) gene expression changes in development (left panel) and aging (right panel). The x-axis shows the number of genes in the log scale. The color of the bars shows the direction of change, decrease (steel gray), and increase (orange). The exact number of genes are also displayed on the plot.
Figure 2
Figure 2
Age-related change in gene expression heterogeneity during development and aging. The procedures are similar to those in Fig. 1, except, age-related heterogeneity changes (ρ values) were used instead of expression changes (β values). (a) Spearman correlations among age-related heterogeneity changes (ρ values) across datasets. (b) Principal component analysis (PCA) of heterogeneity change with age. (c) The number of genes showing significant heterogeneity change in aging and development.
Figure 3
Figure 3
(a) Boxplots, showing distributions of age-related heterogeneity changes (ρ values) of 11,1137 common genes for each dataset and period separately. The dotted red line (vertical line at x = 0) reflects no change in heterogeneity. The difference between median heterogeneity change in aging and development is given as a bar plot on the right panel. Datasets are ordered by the differences in median heterogeneity changes in aging and development. (b) The relationship between expression and heterogeneity change with age. Spearman correlation analysis was performed between age-related expression changes (β values) and age-related heterogeneity changes (ρ values) of 11,137 common genes, separately for each dataset. The dotted gray line at y = 0 reflects no correlation between expression and heterogeneity. (c) Expected and observed consistency in the heterogeneity change across datasets in development and aging. There is a significant shift toward heterogeneity increase in aging (lower panel), while there is no significant consistency in either direction in development (upper panel). The expected distribution is constructed using a permutation scheme that accounts for the dependence among datasets and is more stringent than random permutations (see Supplementary Fig. S10 for details).
Figure 4
Figure 4
Clusters of genes showing a consistent heterogeneity increase in aging (n = 147). Clustering was performed based on patterns of the change in heterogeneity, using the k-means clustering method (see Methods). The x- and y-axes show age and heterogeneity levels, respectively. Mean heterogeneity change for the genes in each cluster was drawn by spline curves. The colors and line-types of curves specify different brain regions and data sources, respectively.
Figure 5
Figure 5
Functional analysis of consistent heterogeneity changes. (a) Distribution of consistent heterogeneity increase for the significantly enriched KEGG pathways, in development and aging. x- and y-axes show the number of datasets with a consistent increase and the density for each significant pathway, respectively. The dashed red line shows x = 9.5, which is the middle point for 19 datasets, representing no tendency to increase or decrease. Values higher than 9.5, shown with red color, indicate an increase in heterogeneity while values lower than 9.5, shown with blue color, indicate a decrease in heterogeneity and the darkness shows the consistency in change across datasets. (b) The longevity regulating pathway (KEGG Pathway ID: hsa04211), exemplifying the distribution of the genes (circles), their heterogeneity across datasets (color – the same color scheme as panel (a)), and their relationship in the pathway (edges). More detailed schemes for all significant pathways with the gene names are given as SI.
Figure 6
Figure 6
Correlation between the change in heterogeneity and number of transcriptional regulators, i.e. miRNA and transcription factors. Each point represents a dataset, and the color shows the data source. p-values are calculated using a permutation test. The dashed line at y = 0 shows zero correlation.

References

    1. Gorbunova V, Seluanov A, Mao Z, Hine C. Changes in DNA repair during aging. Nucleic Acids Res. 2007;35:7466–74. doi: 10.1093/nar/gkm756. - DOI - PMC - PubMed
    1. Lu T, et al. Gene regulation and DNA damage in the ageing human brain. Nature. 2004;429:883–891. doi: 10.1038/nature02661. - DOI - PubMed
    1. Sowell ER, Thompson PM, Toga AW. Mapping Changes in the Human Cortex throughout the Span of Life. Neurosci. 2004;10:372–392. - PubMed
    1. Grillo FW, et al. Increased axonal bouton dynamics in the aging mouse cortex. Proc. Natl. Acad. Sci. 2013;110:E1514–E1523. doi: 10.1073/pnas.1218731110. - DOI - PMC - PubMed
    1. Dorszewska J. Cell biology of normal brain aging: synaptic plasticity–cell death. Aging Clin. Exp. Res. 2013;25:25–34. doi: 10.1007/s40520-013-0004-2. - DOI - PubMed

Publication types