. 2020 Mar 5;3(1):104.
doi: 10.1038/s42003-020-0812-9.

Genetic and phenotypic landscape of the mitochondrial genome in the Japanese population

Affiliations

Genetic and phenotypic landscape of the mitochondrial genome in the Japanese population

Kenichi Yamamoto et al. Commun Biol. .

Abstract

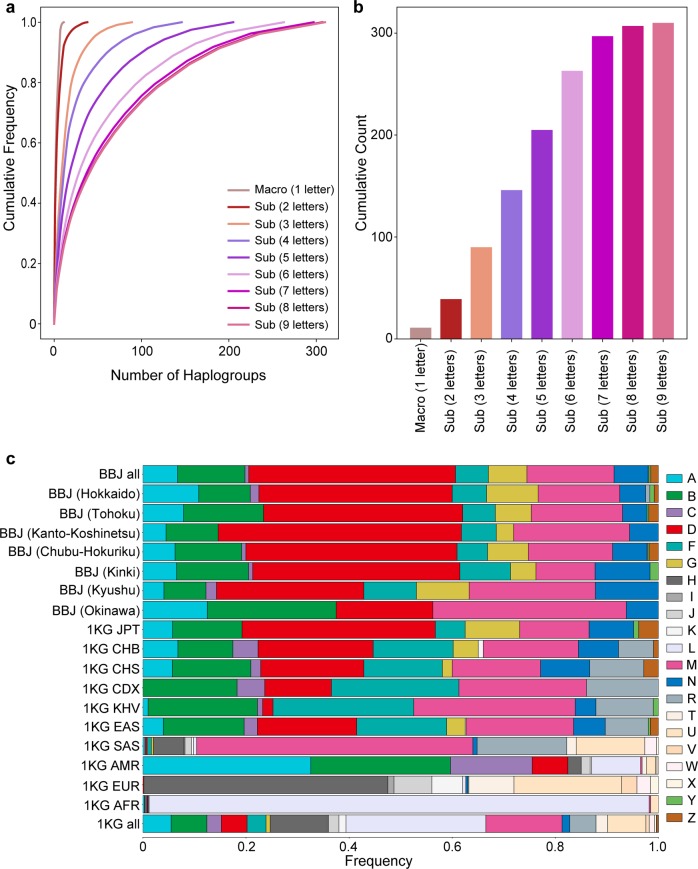
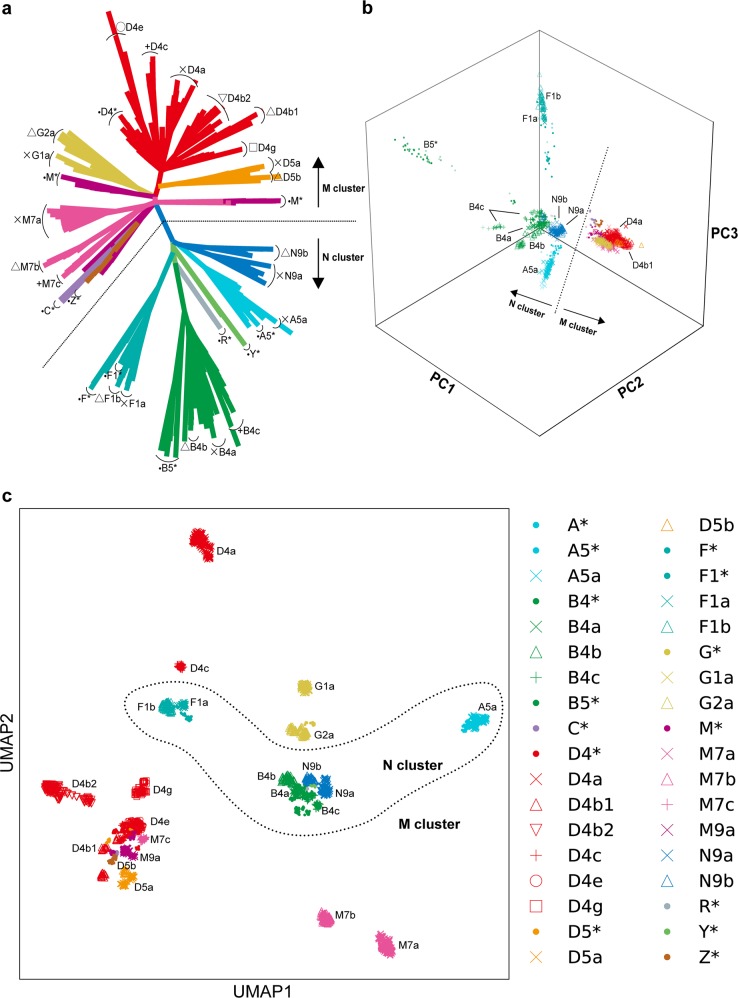
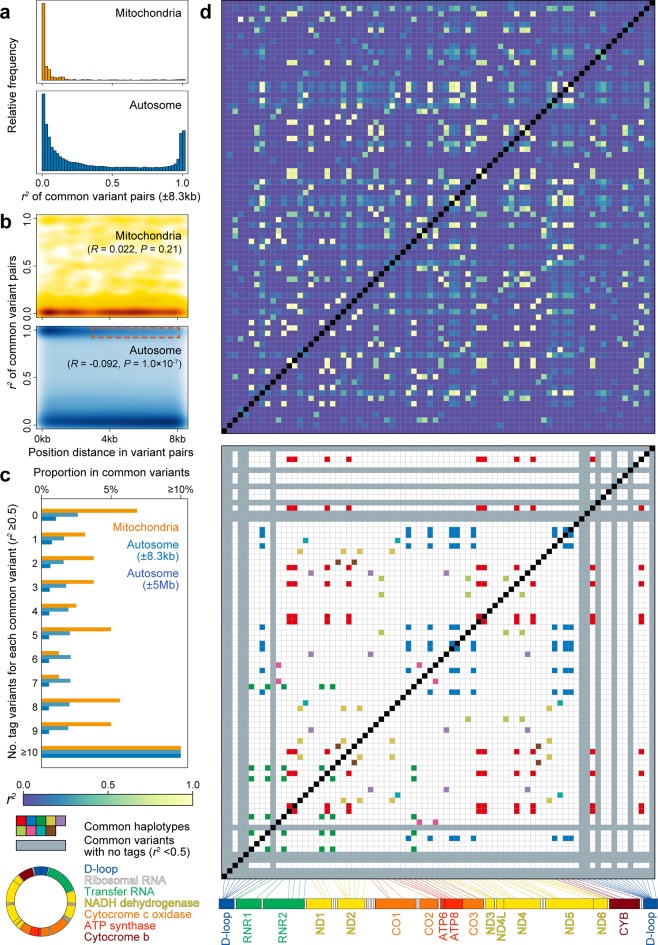
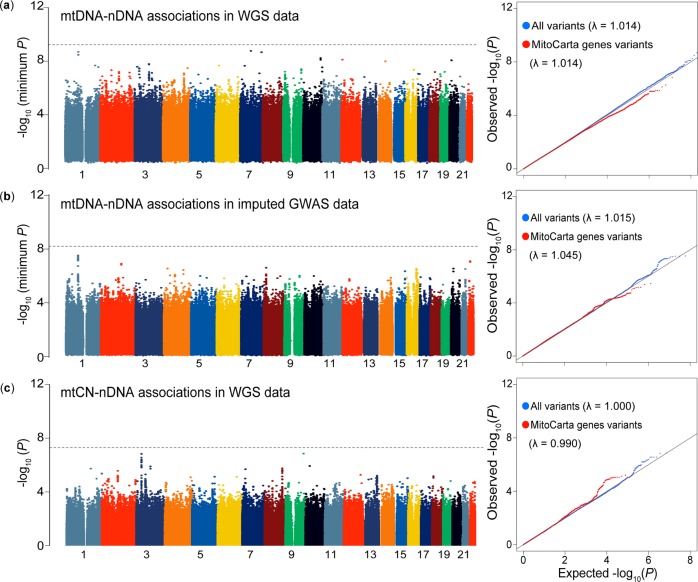
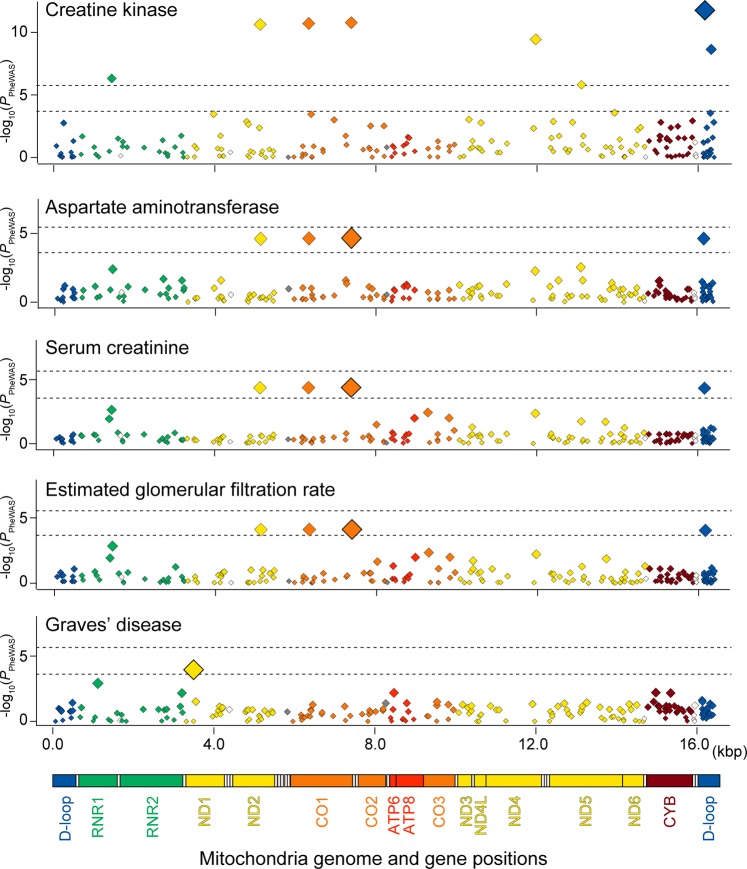
The genetic landscape of mitochondrial DNA (mtDNA) has been elusive. By analyzing mtDNA using the whole genome sequence (WGS) of Japanese individuals (n = 1928), we identified 2023 mtDNA variants and high-resolution haplogroups. Frequency spectra of the haplogroups were population-specific and were heterogeneous among geographic regions within Japan. Application of machine learning methods could finely classify the subjects corresponding to the high-digit mtDNA sub-haplogroups. mtDNA had distinct genetic structures from that of nuclear DNA (nDNA), characterized by no distance-dependent linkage disequilibrium decay, sparse tagging of common variants, and the existence of common haplotypes spanning the entire mtDNA. We did not detect any evidence of mtDNA-nDNA (or mtDNA copy number-nDNA) genotype associations. Together with WGS-based mtDNA variant imputation, we conducted a phenome-wide association study of 147,437 Japanese individuals with 99 clinical phenotypes. We observed pleiotropy of mtDNA genetic risk on the five late-onset human complex traits including creatine kinase (P = 1.7 × 10⁻¹²).


Conflict of interest statement

The authors declare no competing interests.

Figures

Fig. 1
Fig. 1. High-resolution spectra of mtDNA haplogroups in the Japanese population.
The detailed haplogroup distributions based on the Japanese WGS data (n = 1928). a Cumulative frequency spectra of the haplogroups from macrohaplogroup (one letter) to sub-haplogroups (nine letters). b Cumulative counts of the haplogroups from macrohaplogroup (one letter) to sub-haplogroup (nine letters). c Stacked bar plots of the frequencies of the macrohaplogroups within the geographical regions in Japan and subpopulations from 1KG. The geographical regions in Japan are defined as Hokkaido, Tohoku, Kanto-Koshinetsu, Chubu-Hokuriku, Kinki, Kyushu, and Okinawa from northeast to southwest areas of Japan, as described elsewhere.
Fig. 2
Fig. 2. Unsupervised ML-based sample classification of the Japanese mtDNA variant data.
All the three unsupervised ML method classifications were performed on the WGS variant data of the Japanese population (n = 1928). a The unrooted phylogenetic tree using maximum-parsimony method. b The 3D plot of the top three components of PCA. c The plot of the two components of UMAP. Each color and marker represents haplogroups. Distinction between the M and N haplogroup clusters is displayed with dotted lines in each panel.
Fig. 3
Fig. 3. LD structure of the mtDNA variants.
LD structure of the common mtDNA variants identified by WGS. a Distributions of the haplotype correlations (r2) and b distance-dependent LD decay in the mtDNA and nDNA variants are illustrated in parallel. LD calculation of the nDNA variant pairs was adjusted for the distance corresponding to the mtDNA length (±8.3 kbp, P = 0.21 [R = 0.022] and P = 1.0 × 10−7 [R = −0.092] for mtDNA and nDNA, respectively). Distance-dependent LD decay in nDNA is highlighted with red. c Distributions of the number of the tag variants (r2 ≥ 0.5) per a common variant. d Pairwise LD matrix among the common mtDNA variants (MAF ≥ 5%). In the upper panel, the r2-values are colored according to the legend. In the lower panel, the variants without any tag variants are highlighted in gray, whereas the variants included in the common haplotypes spanning the entire mtDNA are separately colored as in the legend. Mitochondrial gene positions in mtDNA are indicated in the legend.
Fig. 4
Fig. 4. Genome-wide scan of the mtDNA–nDNA (or mtCN-) genotype associations.
The plotted P-value is the association P-value for each analysis. In each panel, a Manhattan plot and a quantile–quantile (QQ) plot are indicated. The y-axes of the Manhattan plots in a and b indicate −log10(minimum P) at each nDNA variant extracted from the results for all mtDNA variants tested. The horizontal gray lines represent the study-wide significant threshold (P < 5.8 × 10−10, 6.3 × 10−9, and 5.0 × 10−8 for a, b, and c, respectively). In the QQ plot, blue dots indicate all the variants and red dots are the variants within ±10k bp of the 1105 mitochondria-related genes in nDNA. a The genome-wide mtDNA–nDNA genotype associations obtained from the WGS data (n = 1928, mtDNA variants = 86 [MAF ≥ 5%], and nDNA variants = 7,124,343 [MAF ≥ 1%]). b The genome-wide mtDNA–nDNA genotype associations obtained from the imputed GWAS data (n = 141,552, mtDNA variants = 8 [MAF ≥ 5%], and nDNA variants = 7,402,102 [Rsq ≥ 0.7 and MAF ≥ 1%]). c The genome-wide mtCN–nDNA associations obtained from the WGS data (n = 1928, nDNA variants = 7,124,343 [MAF ≥ 1%]).
Fig. 5
Fig. 5. Mitochondrial regional plots indicating genotype–phenotype associations identified by PheWAS.
Regional association plots of the entire mtDNA illustrating the genotype–phenotype associations identified by the mitochondrial PheWAS in the Japanese population (n = 147,310). Y-axes represent –log10(P) of the associations of the variants and x-axes represent the base pair positions in mtDNA. An upper horizontal bar in each plot represents the study-wide significance threshold of P = 2.5 × 10−6, considering multiple comparisons of both the numbers of the variants and phenotypes. A lower horizontal bar in each plot represent the study-wide significance threshold of P = 2.4 × 10−4, considering multiple comparisons of the number of the variants. Mitochondrial gene positions are indicated in the bottom panel.

References

    1. Wallace DC. Mitochondrial genetic medicine. Nat. Genet. 2018;50:1642–1649. doi: 10.1038/s41588-018-0264-z. - DOI - PubMed
    1. Wallace DC. Mitochondrial DNA variation in human radiation and disease. Cell. 2015;163:33–38. doi: 10.1016/j.cell.2015.08.067. - DOI - PMC - PubMed
    1. Guyatt AL, et al. A genome-wide association study of mitochondrial DNA copy number in two population-based cohorts. Hum. Genomics. 2019;13:6–17. doi: 10.1186/s40246-018-0190-2. - DOI - PMC - PubMed
    1. Rusecka J, Kaliszewska M, Bartnik E, Tońska K. Nuclear genes involved in mitochondrial diseases caused by instability of mitochondrial DNA. J. Appl. Genet. 2018;59:43–57. doi: 10.1007/s13353-017-0424-3. - DOI - PMC - PubMed
    1. Zaidi AA, Makova KD. Investigating mitonuclear interactions in human admixed populations. Nat. Ecol. Evol. 2019;3:213–222. doi: 10.1038/s41559-018-0766-1. - DOI - PMC - PubMed

Publication types

Substances