. 2020 Apr;39(18):3666-3679.
doi: 10.1038/s41388-020-1243-2. Epub 2020 Mar 5.

Lipogenic signalling modulates prostate cancer cell adhesion and migration via modification of Rho GTPases

Affiliations

Lipogenic signalling modulates prostate cancer cell adhesion and migration via modification of Rho GTPases

Mario De Piano et al. Oncogene. 2020 Apr.

Abstract

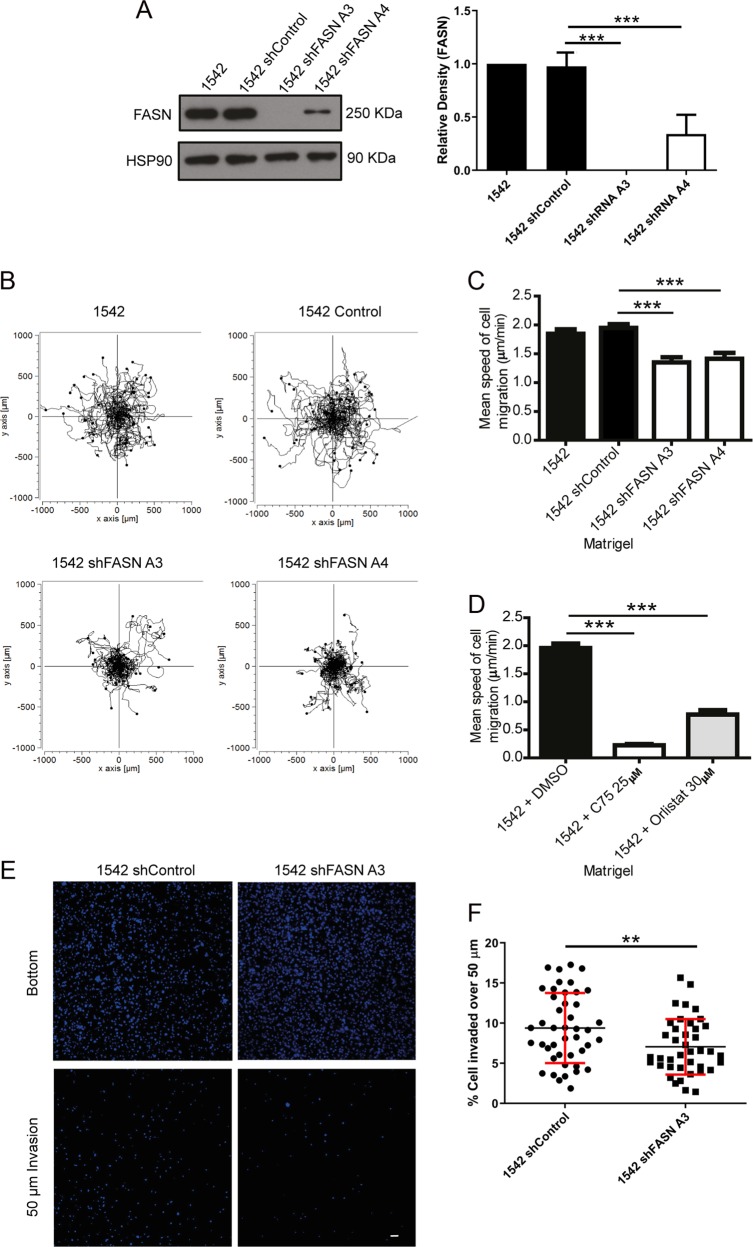
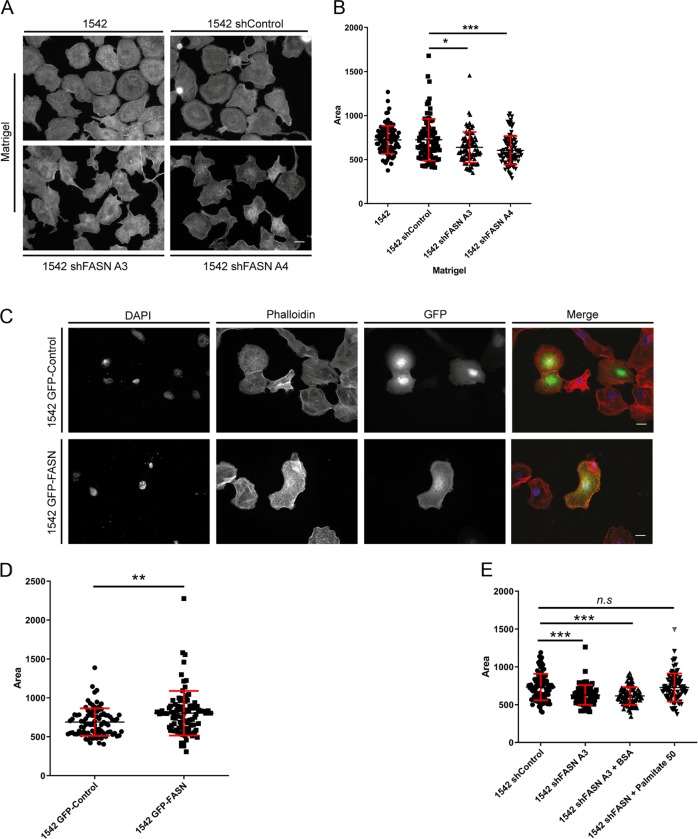
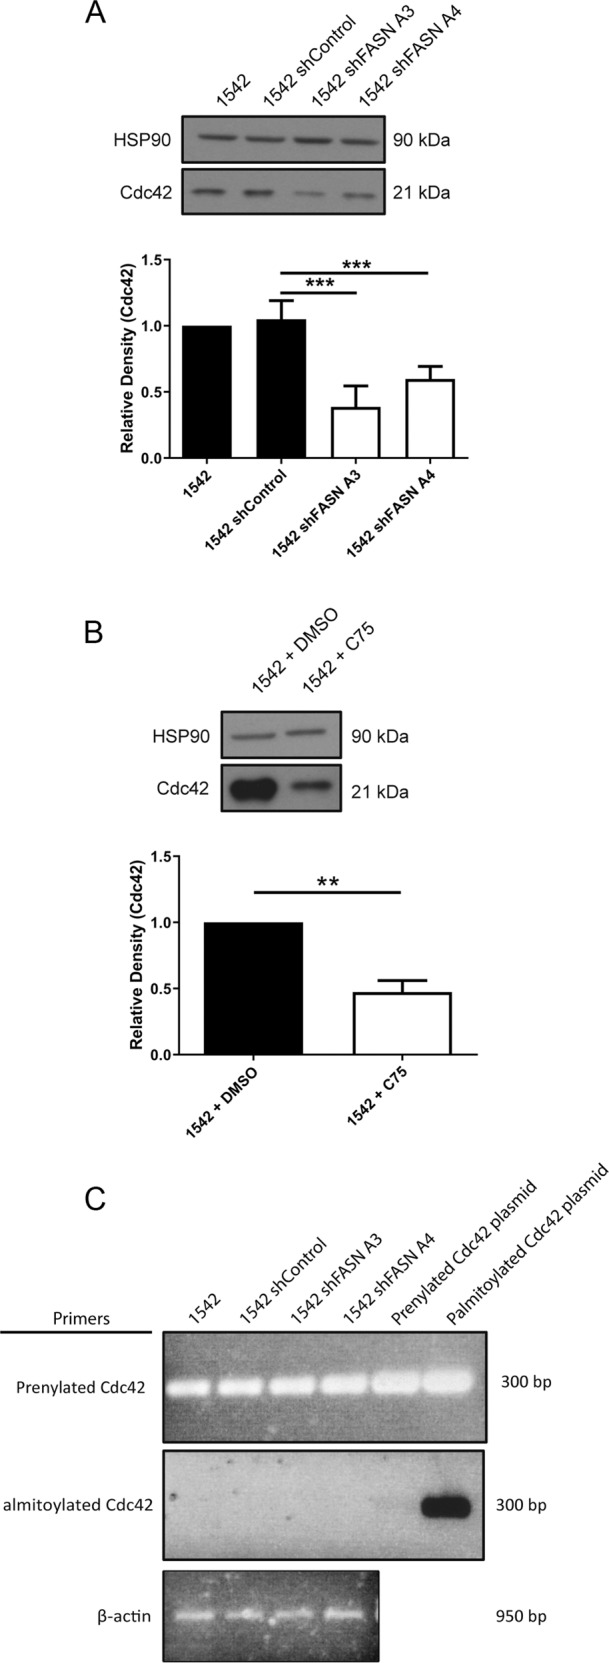
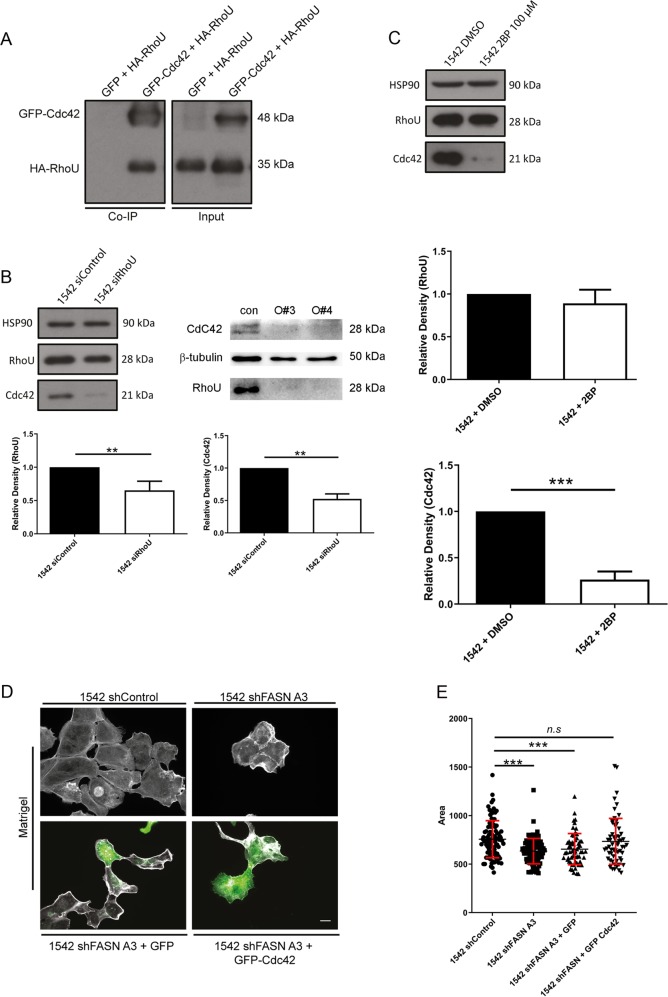
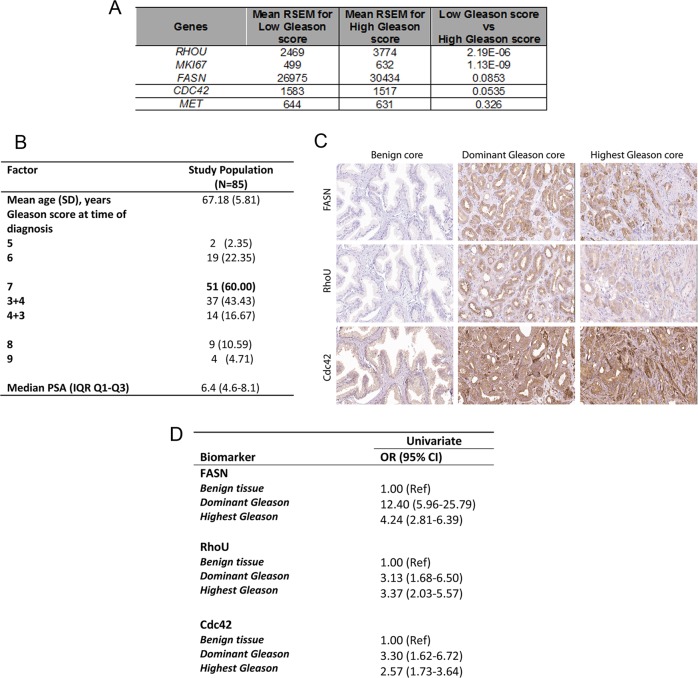
Fatty acid synthase (FASN) is commonly overexpressed in prostate cancer and associated with tumour progression. FASN is responsible for de novo synthesis of the fatty acid palmitate; the building block for protein palmitoylation. Recent work has suggested that alongside its established role in promoting cell proliferation FASN may also promote invasion. We now find depletion of FASN expression increases prostate cancer cell adhesiveness, impairs HGF-mediated cell migration and reduces 3D invasion. These changes in motility suggest that FASN can mediate actin cytoskeletal remodelling; a process known to be downstream of Rho family GTPases. Here, we demonstrate that modulation of FASN expression specifically impacts on the palmitoylation of the atypical GTPase RhoU. Impaired RhoU activity in FASN depleted cells leads to reduced adhesion turnover downstream of paxillin serine phosphorylation, which is rescued by addition of exogenous palmitate. Moreover, canonical Cdc42 expression is dependent on the palmitoylation status of RhoU. Thus we uncover a novel relationship between FASN, RhoU and Cdc42 that directly influences cell migration potential. These results provide compelling evidence that FASN activity directly promotes cell migration and supports FASN as a potential therapeutic target in metastatic prostate cancer.


Conflict of interest statement

The authors declare that they have no conflict of interest.

Figures

Fig. 1
Fig. 1. Loss of FASN expression impairs migration and invasion.
a Cell lysates were immunoblotted for FASN and loading control HSP90. Densitometry analysis was performed and relative quantification of FASN levels calculated. b cells were seeded on Matrigel, serum starved, stimulated with 10 ng/ml HGF and imaged for 16 h at 5 min intervals. Migration plots of each cell line (60 cells per condition). c Mean (±SEM) speed of migration. d 1542 cells were seeded on Matrigel, serum starved, incubated with DMSO, C75 or orlistat and then stimulated with 10 ng/ml HGF. Images were taken and processed as described above (c) Mean (±SDev). 60 cells per condition. e Cells were overlaid with a type I collagen for 24 h. Cells were fixed and stained with Hoechst. Cells at 0 μm (bottom) and 50 μm were imaged. f Percentage of cells invading over 50 μm. All data represent the mean values ± SDev from three independent experiments. Statistical significance was determined by Student’s t test. **p < 0.01, ***p < 0.001.
Fig. 2
Fig. 2. Loss of FASN expression modulates cell adhesion dynamics.
Cells were seeded on Matrigel (a) or type I collagen for 1 h (b). Absorbance measurements at OD540. c 1542 shControl, 1542 shFASN A3, BSA-treated 1542 shFASN A3, BSA-palmitate (50 μM) treated 1542 shFASN A3 cells were incubated for 1 h fixed and stained for paxillin. White arrows indicate magnified area. An asterisk (*) indicates a cell with prominent paxillin associated adhesions. d Percentage of cells with visible peripheral paxillin positive adhesions. 90 cells counted per condition. e Mean adhesion length > 10 adhesions counted per cell. All data represent the mean adhesion length per cell ± SDev accumulated from three independent experiments. Statistical significance was determined by an ANOVA Tukey’s test, *p < 0.05, **p < 0.01, ***p < 0.001, n.s not significant. f Cell lysates were probed for paxillin, S272 phospho-paxillin and HSP90 as a loading control. Densitometry analysis was performed and relative quantification of paxillin, S272 phospho-paxillin levels calculated. All data represent the mean values ± SDev from three independent experiments. Statistical significance was determined by Student’s t test. *p < 0.05, **p < 0.01. n/s not significant. Bar = 10 μM.
Fig. 3
Fig. 3. Palmitoylation of RhoU is impaired in a FSAN depleted background.
a Cell lysates were probed for RhoU and HSP90 as a loading control. b HEK293 cells were transfected with GFP-RhoU. Cell lysates were assayed for protein palmitoylation. Biotinylated-BMCC modified samples (palmitoylation positive) were detected using streptavidin-HRP. Omission of hydroxylamine (Hydroxyl) acts as a negative control. Cell lysates were probed with anti-GFP and anti-HSP90. c HEK293 cells were transfected with GFP-RhoU in the absence/presence of Flag-FASN, as indicated. Cell lysates were assayed for protein palmitoylation as described above. Cell lysates were probed with anti-FASN, anti-GFP and anti-HSP90. d Cells were transfected with GFP-RhoU. Whole cells lysates were assayed for protein palmitoylation as described above. Cell lysates were probed with anti-FASN, anti-GFP and anti-HSP90. e Quantification of RhoU palmitoylation in d. f RhoU was immunoprecipitated using an in-house anti-PAK4 antibody [14]. A palmitoylation assay was conducted on immunoprecipitated protein as described above. In all above densitometry analysis was performed and relative levels calculated. All data represent the mean values ± SDev from three independent experiments. Statistical significance was determined by Student’s t test. *p < 0.05, **p < 0.01. g 1542 cells were treated as indicated with control or RhoU siRNA. Cells were then transfected with HA-tagged RhoU-WT or RhoU-PALM (mutant that cannot be palmitoylated). Cells were then fixed and stained for paxillin and expression of HA-tagged protein. Mean adhesion length was calculated and statistical significance determined by an ANOVA Tukey’s test. p < 0.001.
Fig. 4
Fig. 4. Loss of FASN expression reduces cell spread area.
a Cells were seeded on Matrigel, fixed and stained for phalloidin. b Mean cell area (90 cells per condition). c 1542 cells transfected with either GFP alone or GFP-FASN were seeded on Matrigel. Cells were stained with DAPI and phalloidin. d Mean cell area (90 cells per condition). e Cells were seeded onto Matrigel in the absence or presence of BSA /BSA conjugated-palmitate 50 μM as indicated. Cells were incubated for 1 h fixed and stained for F-actin. Mean cell area (90 cells per condition). In all above data represent the mean values ± SDev from three independent experiments. Statistical significance was determined by an ANOVA Tukey’s test, *p < 0.05, **p < 0.01, ***p < 0.001. n.s not significant. Scale bar = 10 μm.
Fig. 5
Fig. 5. Loss of FASN activity leads to concomitant loss of canonical Cdc42 expression.
a Cell lysates were probed for Cdc42 and HSP90 as a loading control. Quantification of protein expression was then determined by densitometry analysis. b 1542 cells were treated with DMSO or C75 25 μM for 24 h before lysing. Cell lysates were probed for Cdc42 and HSP90 as a loading control. In all above data represent the mean values ± SDev accumulated from three independent experiments. Statistical significance was determined by Student’s t test. *p < 0.05, **p < 0.01, ***p < 0.001. c cDNA was generated and used in a PCR reaction. PCR primers designed to the prenylated isoform of Cdc42 or the palmitoylated isoform of Cdc42 were used. cDNA plasmids containing either the prenylated or palmitoylated isoform were used as controls. β-actin primers were used as a loading control.
Fig. 6
Fig. 6. Cdc42 expression is dependent on RhoU.
a HEK293 cells were co-transfected with either GFP-Cdc42 and HA-RhoU or GFP and HA-RhoU. Cells were lysed and a GFP-TRAP was performed. GFP-TRAP samples and input lysates were probed for GFP and HA simultaneously. b 1542 cells were transfected with siControl and siRhoUpool for 48 h (left panel) and 1542 cells were transfected with siControl and siRhoU single oligos (#3 and #4) from pool for 48 h (right panel). Cell lysates were probed for RhoU, Cdc42 and HSP90 as a loading control. Quantification of left hand panel. c Palmitate incorporation was inhibited by treating the cells with 2-Bromopalmitate (2BP) 100 μM for 24 h. Cell lysates were probed for RhoU, Cdc42 and HSP90 as a loading control. d Cells transfected with GFP or GFP-Cdc42 cells were seeded onto Matrigel. Cells were fixed and stained for F-actin (grey). e ImageJ was used to calculate the cell area (60 cells per condition). All above quantification of protein expression was determined by densitometry analysis. Data represent the mean values ± SDev from three independent experiments. Statistical significance was determined by an ANOVA Tukey’s test. *p < 0.05, **p < 0.01, ***p < 0.001. n.s not significant. Bar = 10 μM.
Fig. 7
Fig. 7. High expression of FASN, RhoU and Cdc42 is detected in human prostate cancer.
a Normalised RSEM expression levels of MKI67 and RHOU for all samples available in TCGA. The expression of both genes increases with Gleason Score and are significantly different (t-test, p < 0.00005) when comparing low Gleason score samples (Gleason 6 and Gleason 7 (3 + 4) with high Gleason score (Gleason (4 + 3) to Gleason 10). b Baseline characteristics of radical prostatectomy patients included in the U-CAN database. SD standard deviation, IQR interquartile range. c Representative immunohistochemistry for FASN, RhoU and Cdc42 in benign tissue and prostatic adenocarcinoma (dominant and highest Gleason): images for each protein were taken from the same core on the same TMA. d Univariate odds ratios (OR) with 95% confidence intervals (CI) to predict abnormal expression levels of FASN, RhoU, Cdc42 based on prostate tissue type (i.e. dominant and highest Gleason score tissue versus benign tissue). Movie 1 = Control 1542 cells on Matrigel. Movie 2 = ShRNA A3 1542 cells on Matrigel.

References

    1. American Cancer Society. Survival rates for prostate cancer. American Cancer Society; 2016. http://www.cancer.org/cancer/prostate-cancer/detection-diagnosis-staging....
    1. Dasgupta S, Srinidhi S, Vishwanatha JK. Oncogenic activation in prostate cancer progression and metastasis: molecular insights and future challenges. J Carcinog. 2012;11:4. doi: 10.4103/1477-3163.93001. - DOI - PMC - PubMed
    1. Friedl P, Wolf K. Tumour-cell invasion and migration: diversity and escape mechanisms. Nat Rev Cancer. 2003;3:362–74. doi: 10.1038/nrc1075. - DOI - PubMed
    1. Lawson CD, Ridley AJ. Rho GTPase signaling complexes in cell migration and invasion. J Cell Biol. 2017;2. - PMC - PubMed
    1. Baenke F, Peck B, Miess H, Schulze A. Hooked on fat: the role of lipid synthesis in cancer metabolism and tumour development. Dis Model Mech. 2013;6:1353–63. doi: 10.1242/dmm.011338. - DOI - PMC - PubMed

Publication types

MeSH terms