Comparative Study
. 2020 Feb 19:11:255.
doi: 10.3389/fimmu.2020.00255. eCollection 2020.

Characterization of Rat ILCs Reveals ILC2 as the Dominant Intestinal Subset

Affiliations
Comparative Study

Characterization of Rat ILCs Reveals ILC2 as the Dominant Intestinal Subset

Ahmed Abidi et al. Front Immunol. .

Abstract

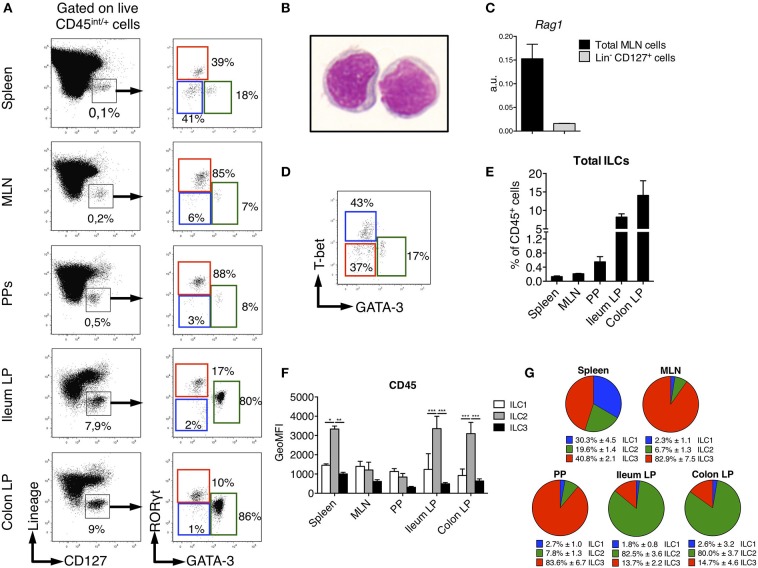
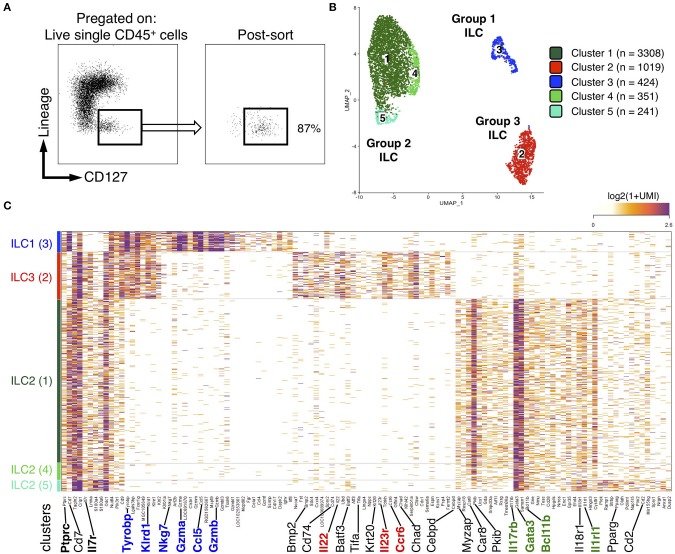
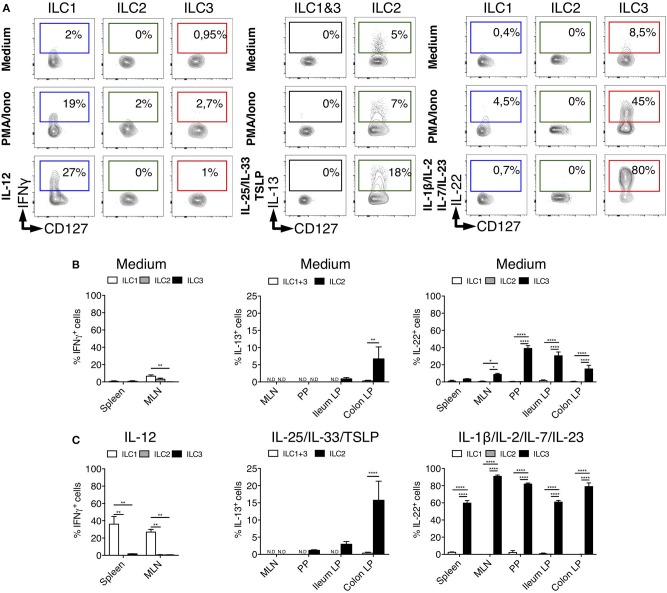
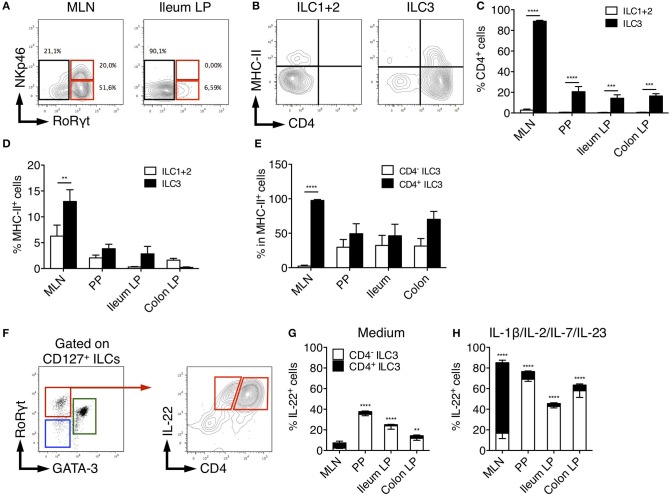
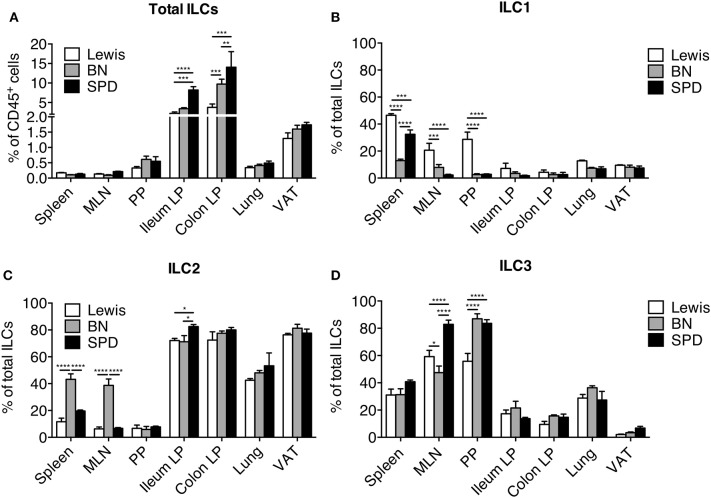
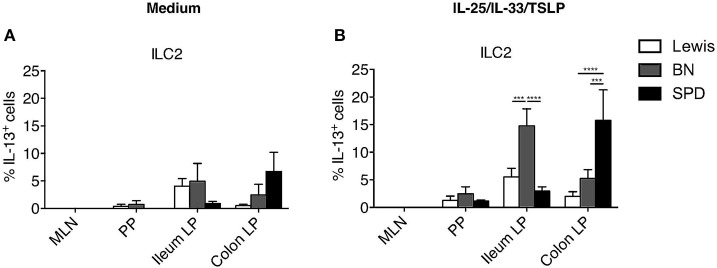
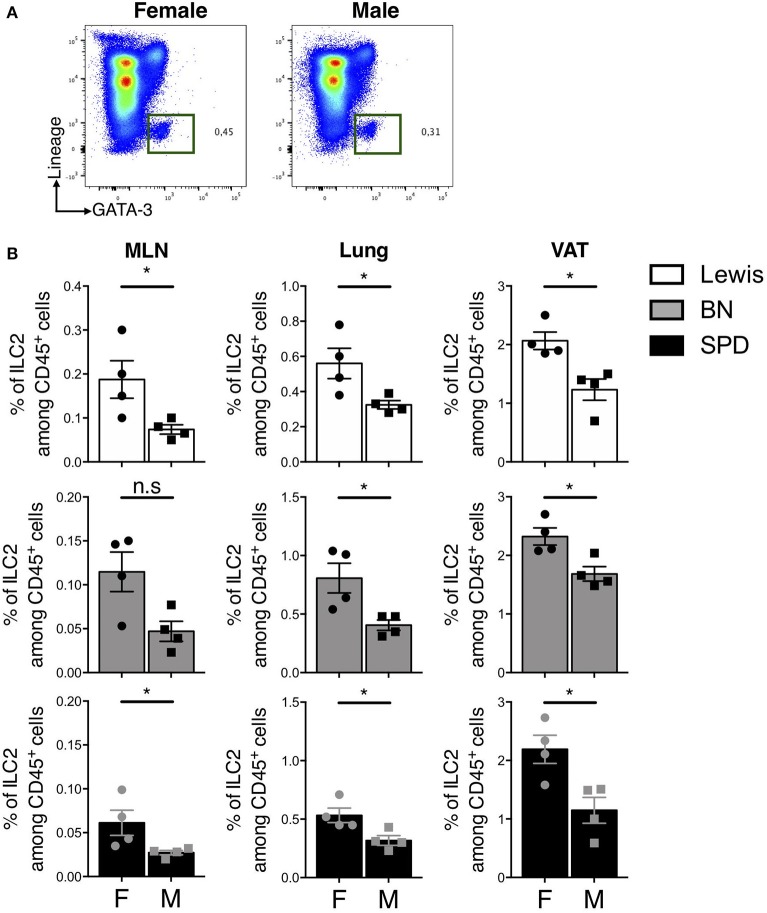
Innate lymphoid cells (ILCs) are tissue-resident lymphocytes that lack antigen-specific receptors and exhibit innate effector functions such as cytokine production that play an important role in immediate responses to pathogens especially at mucosal sites. Mouse and human ILC subsets have been extensively characterized in various tissues and in blood. In this study, we present the first characterization of ILCs and ILC subsets in rat gut and secondary lymphoid organs using flow cytometry and single cell RNA sequencing. Our results show that phenotype and function of rat ILC subsets are conserved as compared to human and mouse ILCs. However, and in contrast to human and mouse, our study unexpectedly revealed that ILC2 and not ILC3 was the dominant ILC subset in the rat intestinal lamina propria. ILC2 predominance in the gut was independent of rat strain, sex or housing facility. In contrast, ILC3 was the predominant ILC subset in mesenteric lymph nodes and Peyer patches. In conclusion, our study demonstrates that in spite of highly conserved phenotype and function between mice, rat and humans, the distribution of ILC subsets in the intestinal mucosa is dependent on the species likely in response to both genetic and environmental factors.

Keywords: ILC2; innate lymphoid cells; intestine; rat; secondary lymphoid organs.


Figures

Figure 1
Figure 1
Identification of ILC subsets in SPD Rats. To characterize ILC subsets in lymphoid and gut-associated tissues, cells were isolated from mesenteric lymph nodes (MLN), Peyer's patches (PP), ileum and colon LP of SPD rats. (A) Representative flow cytometry plots showing the gating approach used to identify putative ILCs (Left panels) and ILC subsets (Right panels) on the basis of the expression of the transcription factors GATA-3 and RORγt in the depicted tissues. (B) May-Grünwald-Giemsa staining (original magnification X100) of rat Lin CD127+ ILCs as gated in (A) that were sort-purified from MLN of SPD rats. (C) Rag1 gene expression was assessed by qPCR on total MLN cells and sorted Lin CD127+ cells SPD rats (n = 3). (D) Representative flow cytometric plot showing T-bet vs. GATA-3 expression in spleen ILC subsets from SPD rats. (E) Frequencies of total Lin CD127+ ILCs expressed as percentage of CD45+ leukocytes in different tissues from SPD rats. (n = 6). (F) CD45 mean fluorescence intensity (MFI) on ILC subsets from the depicted tissues from SPD rat. (G) Distribution of ILC subsets among total ILCs from SPD rats. n = 6 for each tissue. *p < 0.05, **p < 0.01, ***p < 0.001.
Figure 2
Figure 2
scRNAseq reveals distinct clusters of ILCs from colon LP of rat. (A) FACS-sorting plots showing the sorted CD45+ Lin CD127+ ILCs from the colon LP of one SPD rat (left panel) and cells purity after sorting (right panel). (B) Uniform manifold approximation and projection (UMAP) visualizing clusters of colonic Lin CD127+ cells analyzed by scRNAseq (n = 1 SPD rat). (C) Heatmap visualization color-coding the mRNA (UMI) counts per single cells (stacked rows) for selected genes (columns). Visualized are randomly selected cells, which were downsampled to 2,000 UMIs/cell. Clusters are separated by gray bars and ordered by ILC subtype.
Figure 3
Figure 3
Tissues quantification of cytokine production by ILC subsets in rats. (A) Representative intracellular staining for IFNγ (in spleen from LEW rats), IL-22 and IL-13 (in Colon LP from SPD rats) in ILC subsets as defined in Figure 1A after 4 h of culture in the absence (medium) or the presence of PMA/Ionomycin or IL-12, a cocktail of IL-25, IL-33, and TSLP or a cocktail of IL-1β, IL-2, IL-7, and IL-23. Flow cytometry quantification of cytokine-producing cells among ILC subset in the depicted tissues after 4 h of culture in the absence (B) or the presence (C) of indicated cytokine cocktails. Data are representative of 2 (PMA+ionomycin) to 6 (cytokines) independent experiments, numeric data represents means ± SEM, ND, not detected. *p < 0.05, **p < 0.01, ****p < 0.0001.
Figure 4
Figure 4
Characterization of rat ILC3 subsets. (A) Representative flow cytometry plots showing NKp46 and RORγt expression among total ILC cells isolated from the MLN and ileum LP of SPD rat (B) Representative flow cytometry plots showing CD4 and MHC-II expression by ILC1/2 and ILC3 cells isolated from the MLN of SPD rat. (C) The percentage of CD4+ and (D) MHC-II+ cells among ILC1/2 (white bars) or ILC3 (black bars) isolated from the indicated tissues of SPD rat. (E) The percentage of MHC-II+ cells amongst CD4 (white bars) and CD4+ (black bars) ILC3 cells. (F) Representative flow cytometry plots showing the gating strategy to identify CD4 and CD4+ IL-22-producing cells among ILC3 isolated from the colon LP of SPD rat. (G) Frequencies of the CD4+ and CD4 cells amongst IL-22 producing ILC3 after 4 h of culture in the absence (G) or the presence of the indicated stimulating cytokines (H). n = 6 per each tissue. **p < 0.01, ***p < 0.001, ****p < 0.0001.
Figure 5
Figure 5
Tissue distribution of ILC populations between rat strains. (A) Frequencies of total Lin CD127+ ILCs expressed as percentage of CD45+ leukocytes in different tissues from LEW (white bars), BN (gray bars) and SPD (black bars) rats (B–D) Frequencies of ILC1 (B), ILC2 (C), and ILC3 (D) among total ILCs within each rat strain in different tissues. n = 6 per each tissue and rat strain except lung and VAT (n = 4). Numeric data represents means ± SEM, significance was determined at P < 0.05. *p < 0.05, **p < 0.01, ***p < 0.001, ****p < 0.0001.
Figure 6
Figure 6
Comparison of ILC2-derived IL-13 production between rat strains. (A) The percentage of constitutive ILC2-derived IL-13 production in the indicated tissues of LEW (white bars), BN (gray bars) and SPD (black bars) rats and (B) after 4 h of stimulation with ILC2 specific cocktail. (n = 6) per each tissue and rat strain. Numeric data represents means ± SEM, significance was determined at P < 0.05. ***p < 0.001, ****p < 0.0001.
Figure 7
Figure 7
Sex-effect on ILC2 proportions in MLN, lung and VAT of rats. (A) Representative plots of Lin GATA-3+ (Pregated on live CD45+ cells) ILC2 in the lung of SPD female vs. male rats. (B) ILC2 frequencies in MLN, lung and visceral adipose tissues (VAT) of different rat strains. (n = 4), numeric data represents means ± SEM, statistical differences were determined by nonparametric Mann Whitney test with significance was determined. F, Female; M, Male. *p < 0.05, n.s, not significant.

References

    1. Hazenberg MD, Spits H. Human innate lymphoid cells. Blood. (2014) 124:700–9. 10.1182/blood-2013-11-427781 - DOI - PubMed
    1. Spits H, Cupedo T. Innate lymphoid cells: emerging insights in development, lineage relationships, and function. Annu Rev Immunol. (2012) 30:647–75. 10.1146/annurev-immunol-020711-075053 - DOI - PubMed
    1. Bernink JH, Peters CP, Munneke M, te Velde AA, Meijer SL, Weijer K, et al. Human type 1 innate lymphoid cells accumulate in inflamed mucosal tissues. Nat Immunol. (2013) 14:221–9. 10.1038/ni.2534 - DOI - PubMed
    1. Huang Y, Paul WE. Inflammatory group 2 innate lymphoid cells. Int Immunol. (2016) 28:23–8. 10.1093/intimm/dxv044 - DOI - PMC - PubMed
    1. Chen L, He Z, Slinger E, Bongers G, Lapenda TLS, Pacer ME, et al. IL-23 activates innate lymphoid cells to promote neonatal intestinal pathology. Mucosal Immunol. (2015) 8:390–402. 10.1038/mi.2014.77 - DOI - PMC - PubMed

Publication types