Pirfenidone Is an Agonistic Ligand for PPARα and Improves NASH by Activation of SIRT1/LKB1/pAMPK
- PMID: 32140659
- PMCID: PMC7049672
- DOI: 10.1002/hep4.1474
Pirfenidone Is an Agonistic Ligand for PPARα and Improves NASH by Activation of SIRT1/LKB1/pAMPK
Abstract
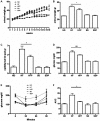
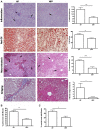
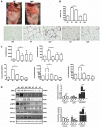
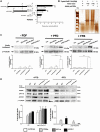
Nonalcoholic steatohepatitis (NASH) is recognized by hepatic lipid accumulation, inflammation, and fibrosis. No studies have evaluated the prolonged-release pirfenidone (PR-PFD) properties on NASH features. The aim of this study is to evaluate how PR-PFD performs on metabolic functions, and provide insight on a mouse model of human NASH. Male C57BL/6J mice were fed with either normo diet or high-fat/carbohydrate diet for 16 weeks and a subgroup also fed with PR-PFD (300 mg/kg/day). An insulin tolerance test was performed at the end of treatment. Histological analysis, determination of serum hormones, adipocytokines measurement, and evaluation of proteins by western blot was performed. Molecular docking, in silico site-directed mutagenesis, and in vitro experiments using HepG2 cultured cells were performed to validate PR-PFD binding to peroxisome proliferator-activated receptor alpha (PPAR-α), activation of PPAR-α promoter, and sirtuin 1 (SIRT1) protein expression. Compared with the high-fat group, the PR-PFD-treated mice displayed less weight gain, cholesterol, very low density lipoprotein and triglycerides, and showed a significant reduction of hepatic macrosteatosis, inflammation, hepatocyte ballooning, fibrosis, epididymal fat, and total adiposity. PR-PFD restored levels of insulin, glucagon, adiponectin, and resistin along with improved insulin resistance. Noteworthy, SIRT1-liver kinase B1-phospho-5' adenosine monophosphate-activated protein kinase signaling and the PPAR-α/carnitine O-palmitoyltransferase 1/acyl-CoA oxidase 1 pathway were clearly induced in high fat + PR-PFD mice. In HepG2 cells incubated with palmitate, PR-PFD induced activation and nuclear translocation of both PPARα and SIRT1, which correlated with increased SIRT1 phosphorylated in serine 47, suggesting a positive feedback loop between the two proteins. These results were confirmed with both synthetic PPAR-α and SIRT1 activators and inhibitors. Finally, we found that PR-PFD is a true agonist/ligand for PPAR-α. Conclusions: PR-PFD provided an anti-steatogenic effect and protection for inflammation and fibrosis.
© 2020 The Authors. Hepatology Communications published by Wiley Periodicals, Inc., on behalf of the American Association for the Study of Liver Diseases.
Figures


Similar articles
-
Prolonged-release pirfenidone prevents obesity-induced cardiac steatosis and fibrosis in a mouse NASH model.Cardiovasc Drugs Ther. 2021 Oct;35(5):927-938. doi: 10.1007/s10557-020-07014-9. Cardiovasc Drugs Ther. 2021. PMID: 32621046
-
H3K9me3 demethylation by JMJD2B is regulated by pirfenidone resulting in improved NASH.Sci Rep. 2024 Oct 21;14(1):24714. doi: 10.1038/s41598-024-75458-2. Sci Rep. 2024. PMID: 39433954 Free PMC article.
-
LB100 ameliorates nonalcoholic fatty liver disease via the AMPK/Sirt1 pathway.World J Gastroenterol. 2019 Dec 7;25(45):6607-6618. doi: 10.3748/wjg.v25.i45.6607. World J Gastroenterol. 2019. PMID: 31832001 Free PMC article.
-
Regulation of energy metabolism by long-chain fatty acids.Prog Lipid Res. 2014 Jan;53:124-44. doi: 10.1016/j.plipres.2013.12.001. Epub 2013 Dec 18. Prog Lipid Res. 2014. PMID: 24362249 Review.
-
n-3 Polyunsaturated fatty acids for the management of alcoholic liver disease: A critical review.Crit Rev Food Sci Nutr. 2019;59(sup1):S116-S129. doi: 10.1080/10408398.2018.1544542. Epub 2018 Dec 22. Crit Rev Food Sci Nutr. 2019. PMID: 30580553 Review.
Cited by
-
Exserolide J ameliorates lipid accumulation in vitro by regulating liver X receptor alpha and peroxisome proliferator-activated receptor alpha proteins.Heliyon. 2024 May 23;10(11):e31861. doi: 10.1016/j.heliyon.2024.e31861. eCollection 2024 Jun 15. Heliyon. 2024. PMID: 38947487 Free PMC article.
-
Dietary supplementation with Mexican foods, Opuntia ficus indica, Theobroma cacao, and Acheta domesticus: Improving obesogenic and microbiota features in obese mice.Front Nutr. 2022 Dec 2;9:987222. doi: 10.3389/fnut.2022.987222. eCollection 2022. Front Nutr. 2022. PMID: 36532548 Free PMC article.
-
Pirfenidone ameliorates liver steatosis by targeting the STAT3-SCD1 axis.Inflamm Res. 2023 Sep;72(9):1773-1787. doi: 10.1007/s00011-023-01776-2. Epub 2023 Sep 2. Inflamm Res. 2023. PMID: 37659014
-
An Update in Epigenetics in Metabolic-Associated Fatty Liver Disease.Front Med (Lausanne). 2022 Jan 11;8:770504. doi: 10.3389/fmed.2021.770504. eCollection 2021. Front Med (Lausanne). 2022. PMID: 35087844 Free PMC article. Review.
-
PPARs as Metabolic Sensors and Therapeutic Targets in Liver Diseases.Int J Mol Sci. 2021 Aug 2;22(15):8298. doi: 10.3390/ijms22158298. Int J Mol Sci. 2021. PMID: 34361064 Free PMC article. Review.
References
-
- Younossi ZM, Koenig AB, Abdelatif D, Fazel Y, Henry L, Wymer M. Global epidemiology of nonalcoholic fatty liver disease—meta‐analytic assessment of prevalence, incidence, and outcomes. Hepatology 2016;64:73‐84. - PubMed
LinkOut - more resources
Full Text Sources
Research Materials

