Review
. 2020 Mar;35(3):205-222.
doi: 10.1007/s10654-020-00615-6. Epub 2020 Mar 5.

Identifying typical trajectories in longitudinal data: modelling strategies and interpretations

Affiliations
Review

Identifying typical trajectories in longitudinal data: modelling strategies and interpretations

Moritz Herle et al. Eur J Epidemiol. 2020 Mar.

Abstract

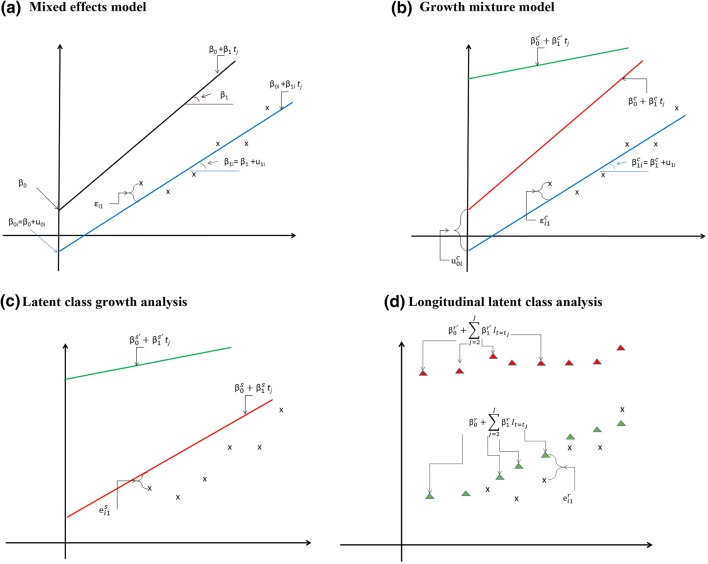
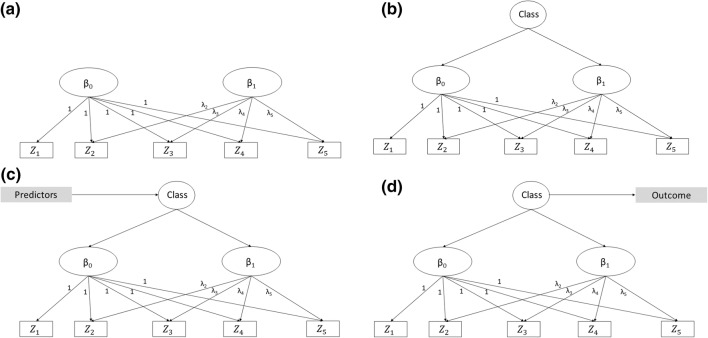
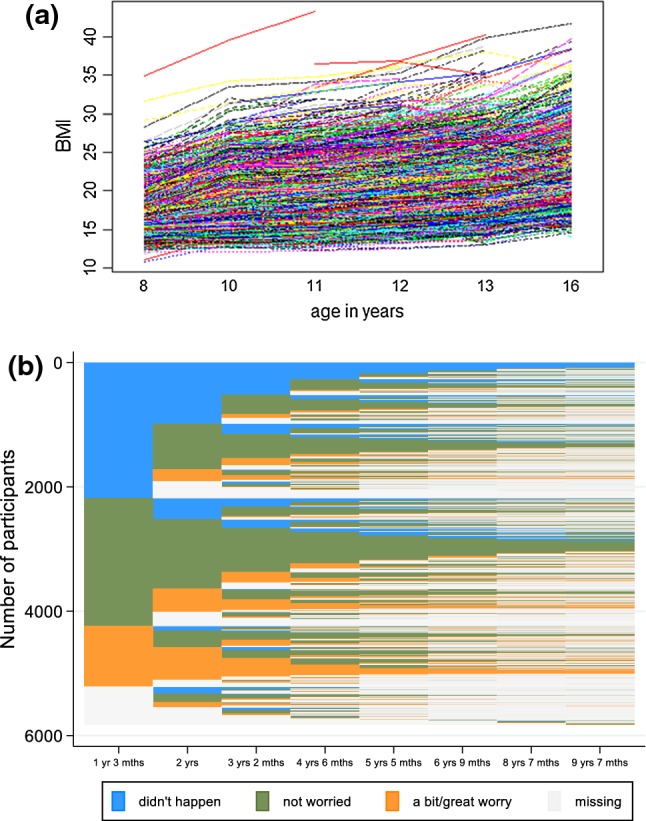
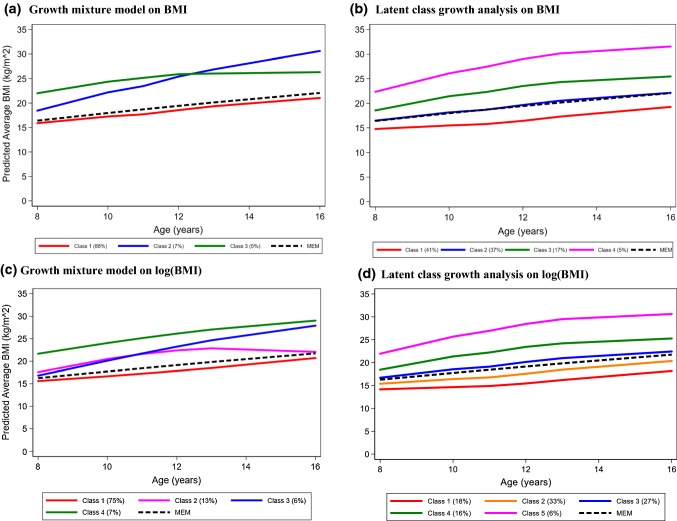
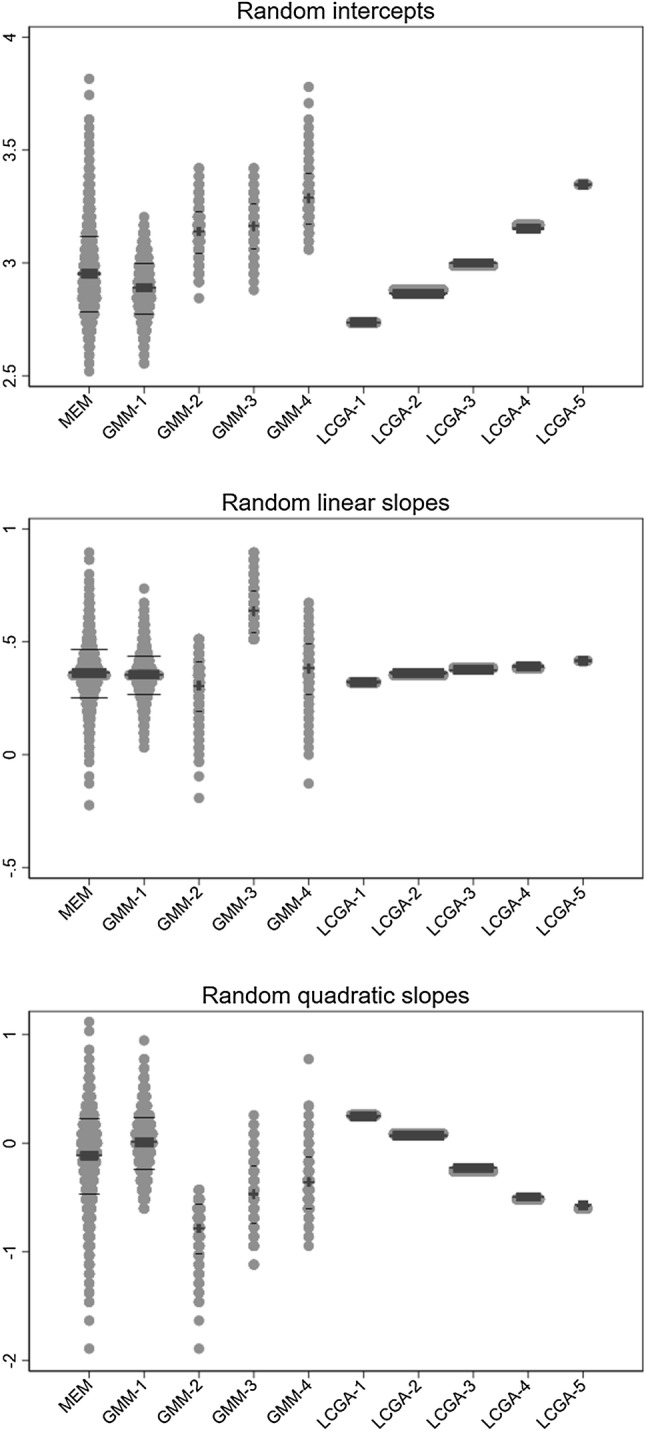
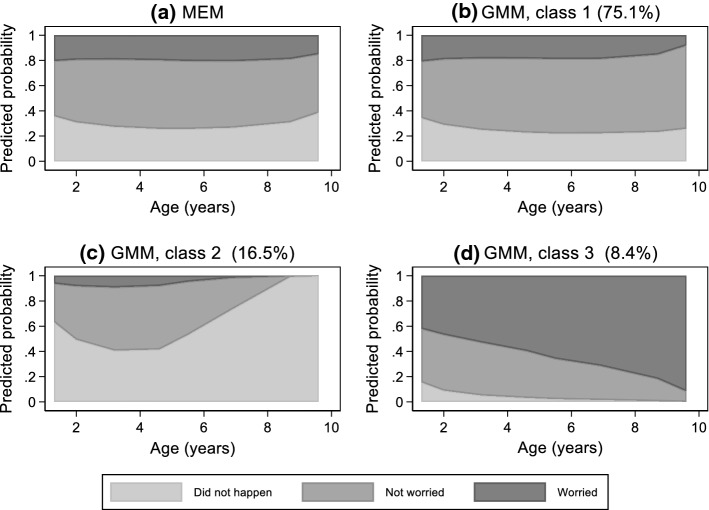
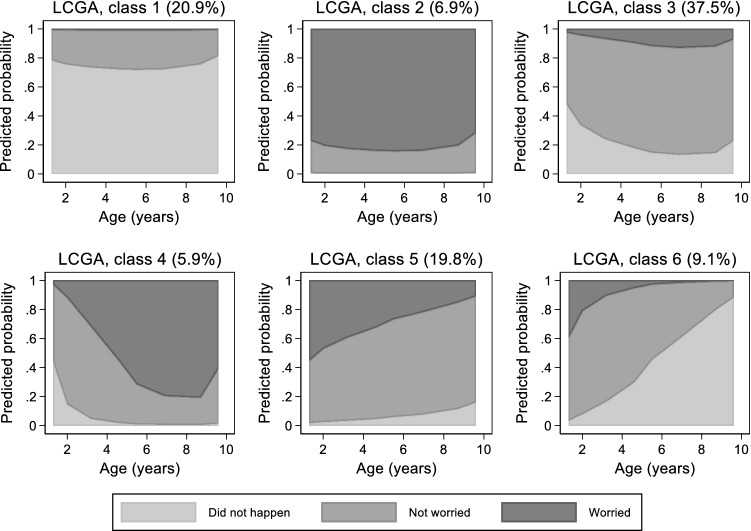
Individual-level longitudinal data on biological, behavioural, and social dimensions are becoming increasingly available. Typically, these data are analysed using mixed effects models, with the result summarised in terms of an average trajectory plus measures of the individual variations around this average. However, public health investigations would benefit from finer modelling of these individual variations which identify not just one average trajectory, but several typical trajectories. If evidence of heterogeneity in the development of these variables is found, the role played by temporally preceding (explanatory) variables as well as the potential impact of differential trajectories may have on later outcomes is often of interest. A wide choice of methods for uncovering typical trajectories and relating them to precursors and later outcomes exists. However, despite their increasing use, no practical overview of these methods targeted at epidemiological applications exists. Hence we provide: (a) a review of the three most commonly used methods for the identification of latent trajectories (growth mixture models, latent class growth analysis, and longitudinal latent class analysis); and (b) recommendations for the identification and interpretation of these trajectories and of their relationship with other variables. For illustration, we use longitudinal data on childhood body mass index and parental reports of fussy eating, collected in the Avon Longitudinal Study of Parents and Children.

Keywords: ALSPAC; Growth mixture models; Latent class growth analysis; Longitudinal latent class analysis; Mixed effects models.


Conflict of interest statement

Bulik reports: Shire (Scientific Advisory Board member), Idorsia (Consultant), and Pearson (author, royalty recipient). All others authors declare no conflicts of interest.

Figures

Fig. 1
Fig. 1
Graphical representation of alternative longitudinal models: a mixed effects model; b growth mixture model (GMM); c latent class growth analysis (LCGA); d longitudinal latent class analysis (LLCA). Black line: population mean trajectory; blue line: individual-specific trajectory; red and green lines: class-specific trajectories; red and green triangles: class-specific values; x: observations for individual i
Fig. 2
Fig. 2
Structural equation modelling representation of: a mixed effects model; b growth mixture model; c growth mixture model with predictors; d growth mixture model with distal outcome
Fig. 3
Fig. 3
Observed trajectories in a body mass index (BMI; kg/m2), N = 4571 and b fussy eating, N = 5824, Avon Longitudinal Study of parents and children
Fig. 4
Fig. 4
Bayesian information criterion (BIC) by number of classes for different specifications of the growth mixture model (GMM) (with/without homogeneous within-individual correlation matrix, Ωc) and of the latent class growth analysis (LCGA) model for body mass index (BMI) and log(BMI)
Fig. 5
Fig. 5
Best fitting trajectories of body mass index (BMI) obtained using a mixed effects model (MEM), a growth mixture model (left hand side panel) and a latent class growth analysis (right hand side panel) on the original BMI data (top) and log-transformed BMI (bottom); Avon Longitudinal Study of Parents and Children, N = 4517
Fig. 6
Fig. 6
Distribution of the random coefficients predicted by alternative models, fitted to log-transformed body mass index (BMI); Avon Longitudinal Study of parents and children, N = 4517. MEM mixed effects model, GMM growth mixture model, LCGA latent class growth analysis; GMM-n nth class of GMM with 4 classes, LCGA-n nth class of LCGA model with 5 classes. Grey dots: observation, thick black line: median, thin black line: 1st and 3rd quartile
Fig. 7
Fig. 7
Stacked predicted probabilities of parental reports of their child’s fussy eating (“Did not happen”, “Not worried” and “A bit/greatly worried”) predicted by the best fitting mixed effects model (MEM) and the best fitting growth mixture model (GMM) with 3 classes; Avon Longitudinal Study of parents and children, N = 5824
Fig. 8
Fig. 8
Stacked predicted probabilities of parental reports of their child’s fussy eating (“Did not happen”, “Not worried” and “A bit/greatly worried”) predicted by the best fitting latent class growth analysis (LCGA) with 6 classes; Avon Longitudinal Study of parents and children (ALSPAC) study, N = 5824
Fig. 9
Fig. 9
Distribution of the random coefficients predicted by alternative models fitted to fussy eating; Avon Longitudinal Study of parents and children, N = 5824. MEM mixed effects model, GMM growth mixture model, LCGA latent class growth analysis, GMM-n nth class of GMM with 4 classes, LCGA-n nth class of LCGA model with 6 classes. Grey dots: observation, thick black line: median, thin black line: 1st and 3rd quartile

References

    1. Verbeke G, Molenberghs G. Linear mixed models for longitudinal data. In: Fitzmaurice GM, Laird NM, Ware JH, editors. Applied longitudinal analysis. Berlin: Springer; 2000.
    1. Goldstein H. Multilevel statistical models. 4. London: Arnold; 2011.
    1. Audrain-McGovern J, et al. Identifying and characterizing adolescent smoking trajectories. Cancer Epidemiol Biomark Prev. 2004;13(12):2023–2034. - PubMed
    1. Falkenstein MJ, et al. Empirically-derived response trajectories of intensive residential treatment in obsessive-compulsive disorder: a growth mixture modeling approach. J Affect Disord. 2019;245:827–833. doi: 10.1016/j.jad.2018.11.075. - DOI - PMC - PubMed
    1. Strauss VY, et al. Distinct trajectories of multimorbidity in primary care were identified using latent class growth analysis. J Clin Epidemiol. 2014;67(10):1163–1171. doi: 10.1016/j.jclinepi.2014.06.003. - DOI - PMC - PubMed