

Trends in Regional Supply of Peritoneal Dialysis in an Era of Health Reform, 2006 to 2013
- PMID: 32141363
- PMCID: PMC7483785
- DOI: 10.1177/1077558720910633
Trends in Regional Supply of Peritoneal Dialysis in an Era of Health Reform, 2006 to 2013
Abstract
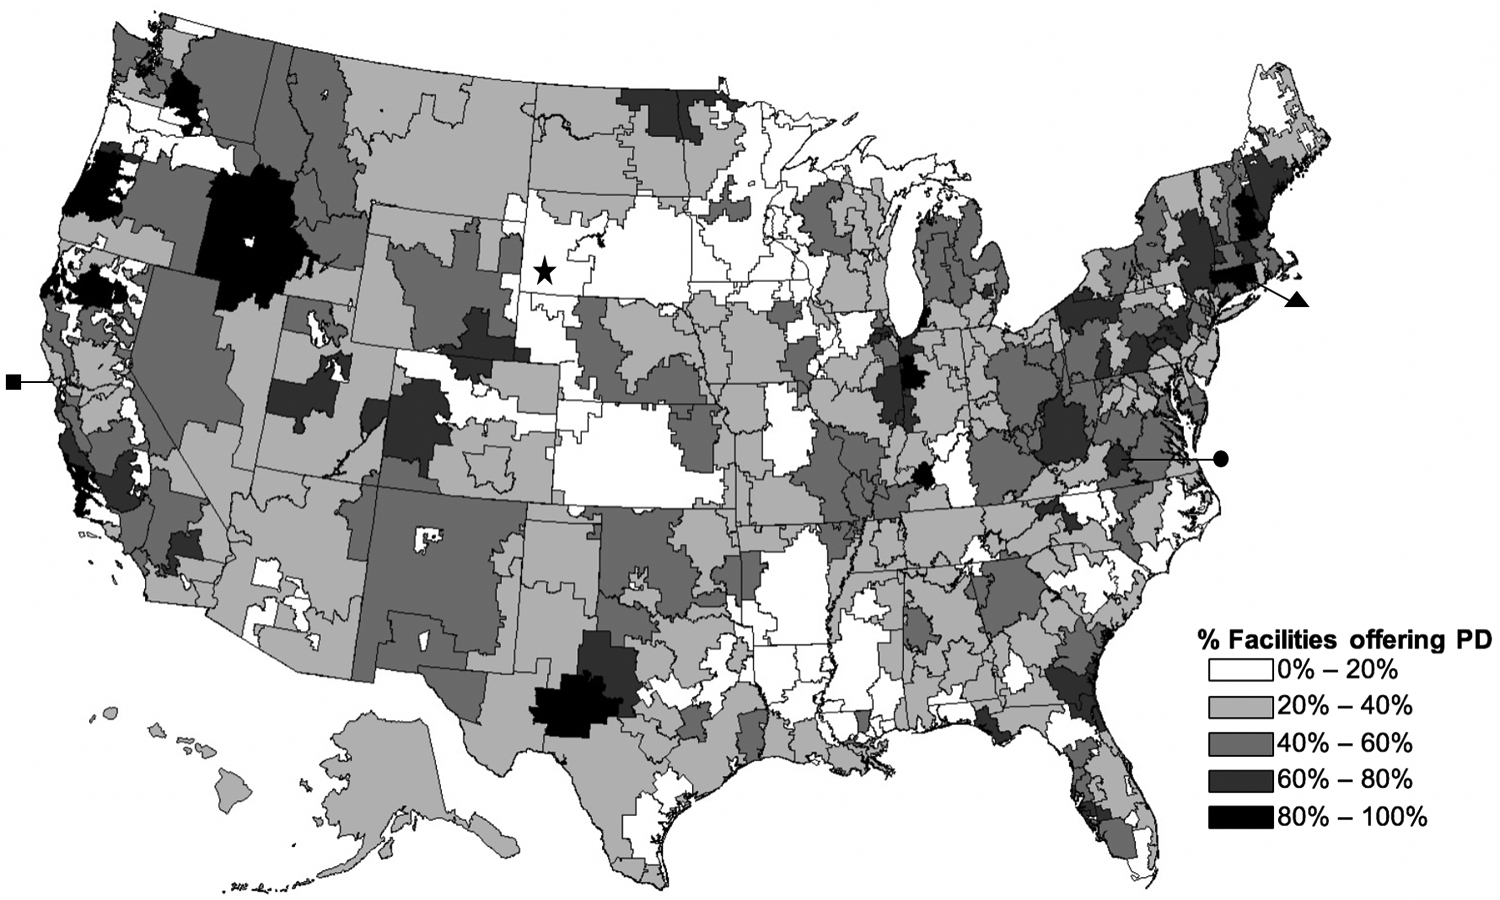
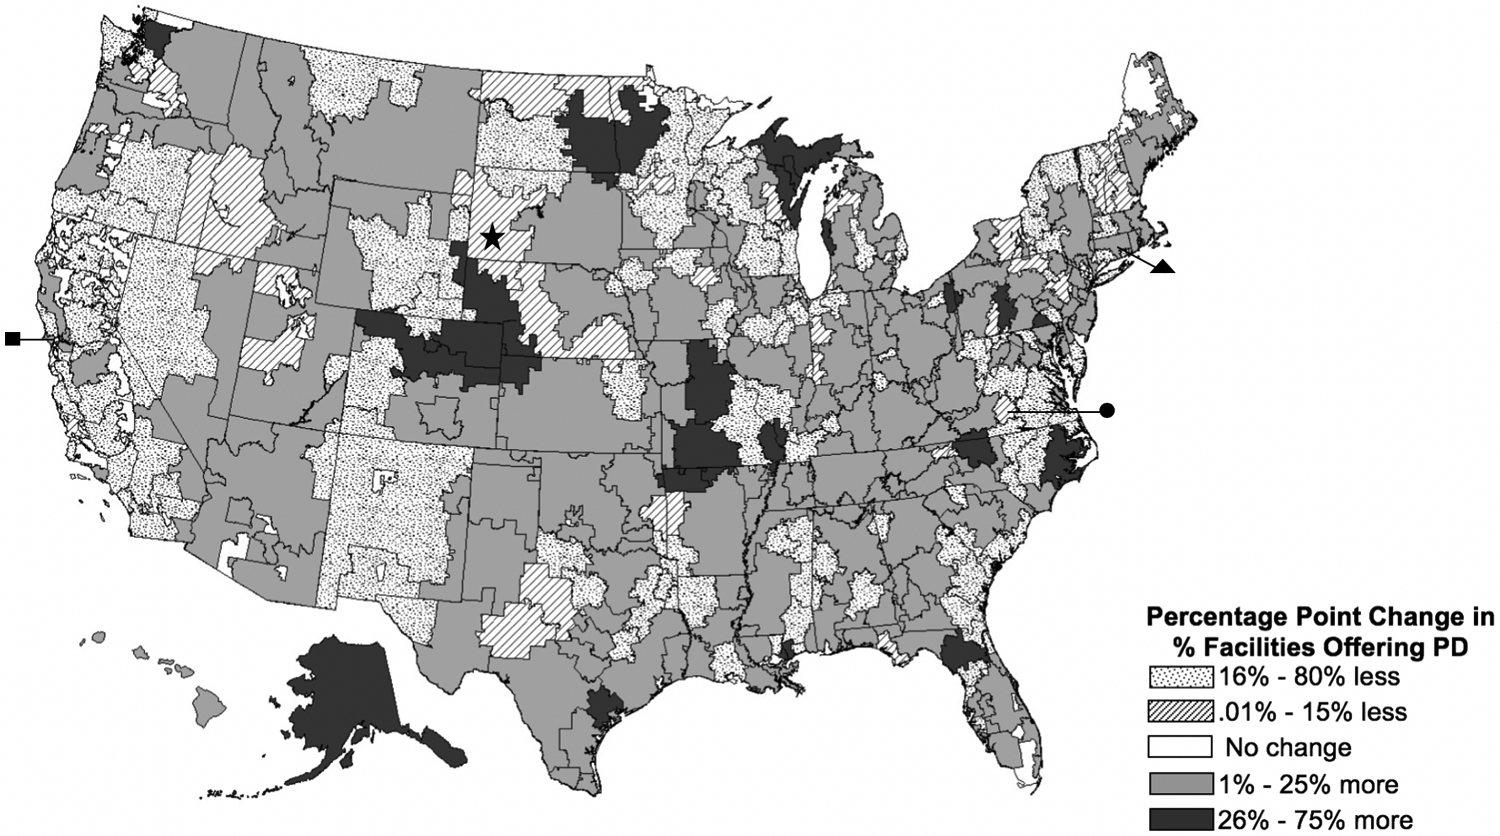
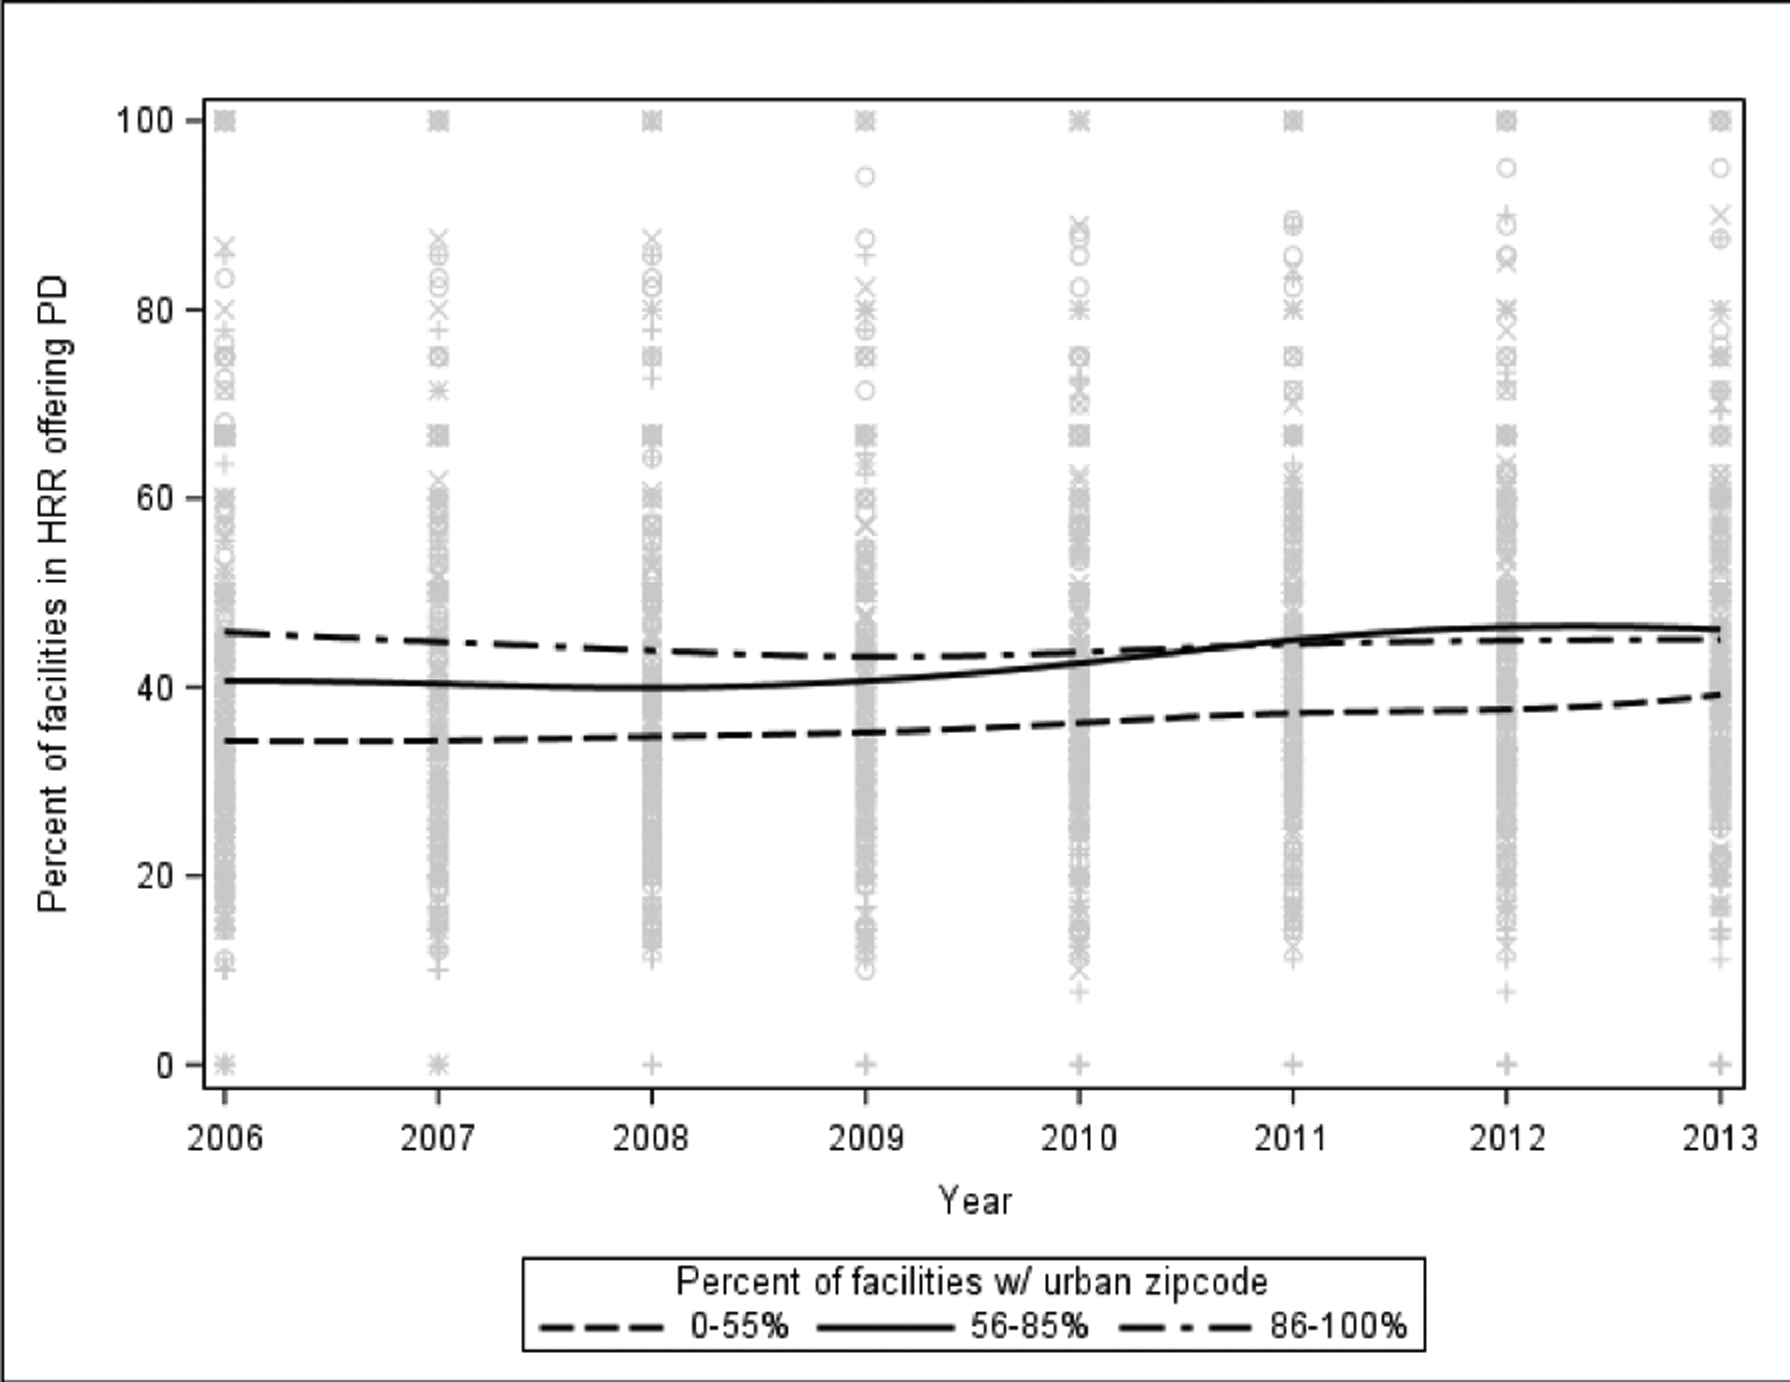
Peritoneal dialysis (PD), a home-based treatment for kidney failure, is associated with similar mortality, higher quality of life, and lower costs compared with hemodialysis. Yet <10% of patients receive PD. Access to this alternative treatment, vis-à-vis providers' supply of PD services, may be an important factor but has been sparsely studied in the current era of national payment reform for dialysis care. We describe temporal and regional variation in PD supply among Medicare-certified dialysis facilities from 2006 to 2013. The average proportion of facilities offering PD per hospital referral region increased from 40% (2006) to 43% (2013). PD supply was highest in hospital referral regions with higher percentage of facilities in urban areas (p = .004), prevalence of PD use (p < .0001), percentage of White end-stage renal disease patients (p = .02), and per capita income (p = .02). Disparities in PD access persist in rural, non-White, and low-income regions. Policy efforts to further increase regional PD supply should focus on these underserved communities.
Keywords: access to care; end-stage renal disease; hospital referral regions; peritoneal dialysis.
Conflict of interest statement
Conflicts of interest: Dr. Maciejewski reports ownership of Amgen stock due to his spouse’s employment. The other authors (CS, CJC, LLS, SYDL, RH, and VW) report no relationship or financial interest with any entity that would pose a conflict of interest regarding the subject matter of this article.
Figures
References
-
- Bhattacharya J, Hyde T, and Tu P. 2014. Health Economics. London, UK: Palgrave and MacMillan.
-
- Blake PG, and Finkelstein FO. 2001. Why is the proportion of patients doing peritoneal dialysis declining in North America? Perit Dial Int 21 (2):107–14. - PubMed
-
- Centers for Medicare & Medicaid Services. 2015. Provider of Service Files. Available at: https://www.cms.gov/Research-Statistics-Data-and-Systems/Downloadable-Pu.... Baltimore, MD.
-
- Centers for Medicare & Medicaid Services. 2018. End Stage Renal Disease (ESRD) Prospective Payment System (PPS). Available at: https://www.cms.gov/Medicare/Medicare-Fee-for-Service-Payment/ESRDpaymen... (accessed August 8, 2018). Baltimore, MD.
-
- Centers for Medicare & Medicaid Services. 2019. Medicare Program: Specialty Care Models To Improve Quality of Care and Reduce Expenditures (Proposed Rule CMS-5527-P). In Docket number CMS-2019–0101, edited by C. f. M. a. M. S. Department of Health and Human Services. Washington, DC: Federal Register.
Publication types
MeSH terms
Grants and funding
LinkOut - more resources
Full Text Sources
Medical
