

Self-reported Sleep Problems Related to Amyloid Deposition in Cortical Regions with High HOMER1 Gene Expression
- PMID: 32142100
- PMCID: PMC7174994
- DOI: 10.1093/cercor/bhz228
Self-reported Sleep Problems Related to Amyloid Deposition in Cortical Regions with High HOMER1 Gene Expression
Abstract
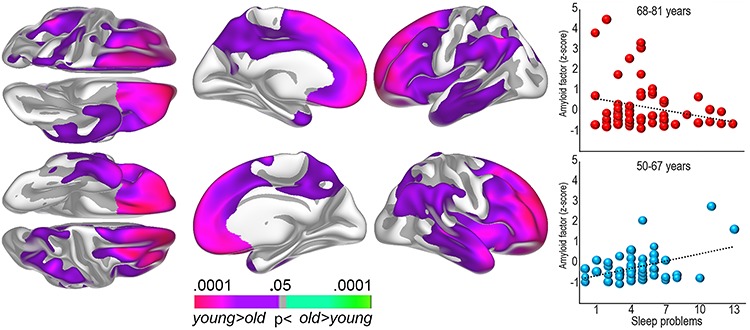
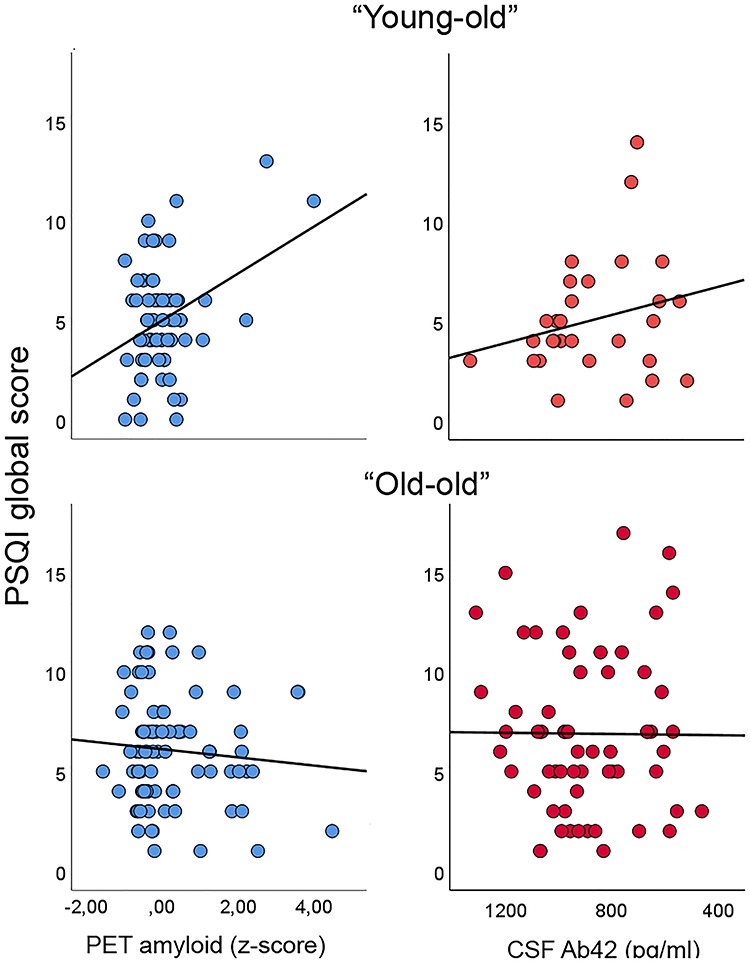
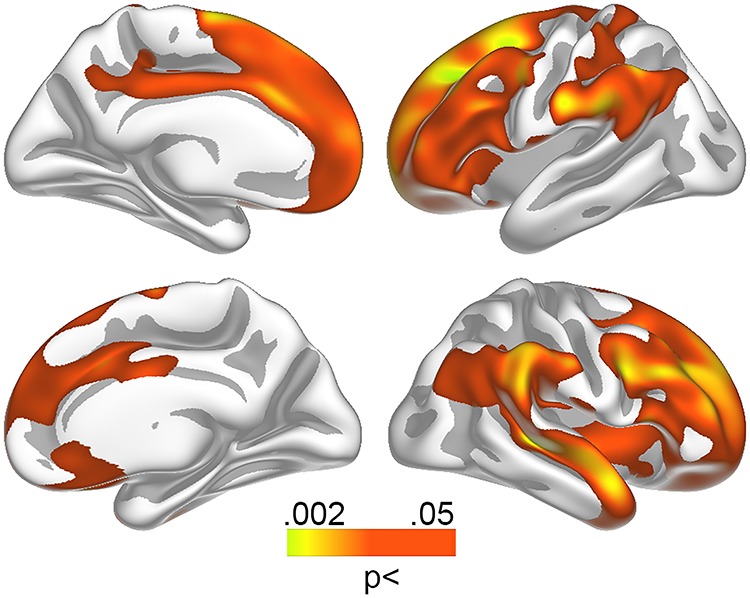
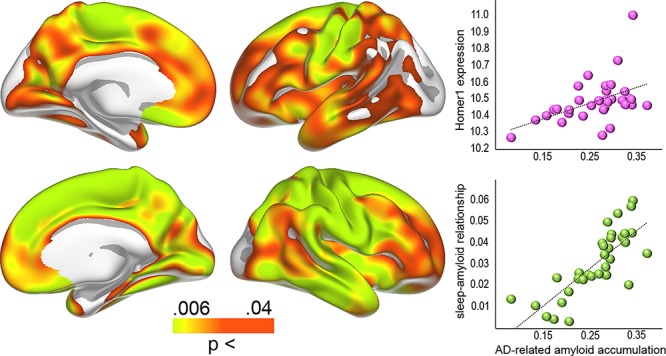
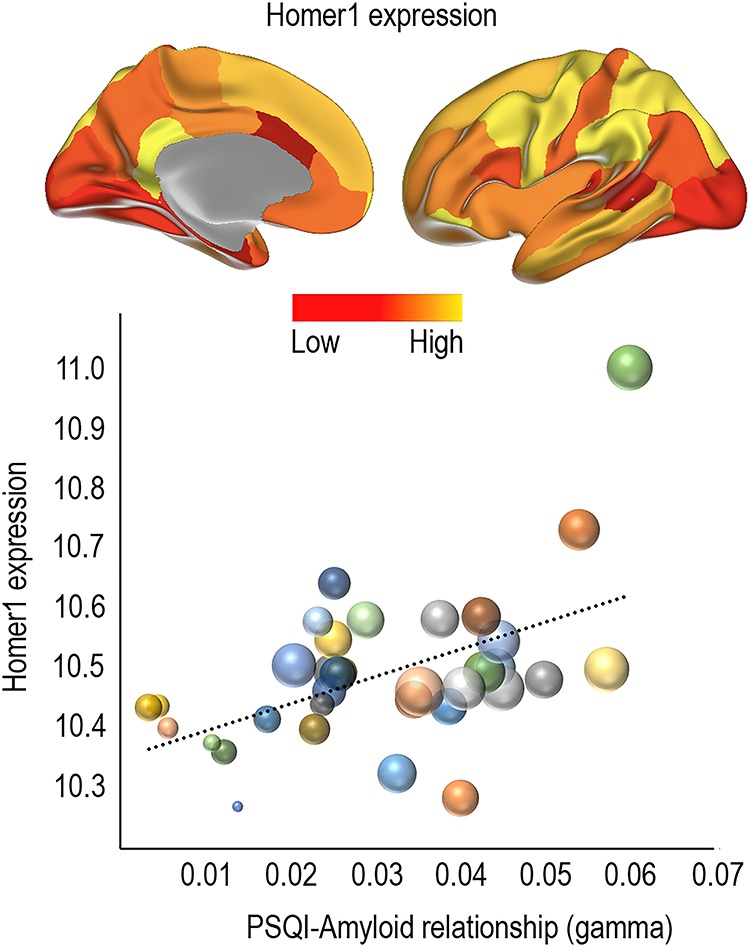
Sleep problems are related to the elevated levels of the Alzheimer's disease (AD) biomarker β-amyloid (Aβ). Hypotheses about the causes of this relationship can be generated from molecular markers of sleep problems identified in rodents. A major marker of sleep deprivation is Homer1a, a neural protein coded by the HOMER1 gene, which has also been implicated in brain Aβ accumulation. Here, we tested whether the relationship between cortical Aβ accumulation and self-reported sleep quality, as well as changes in sleep quality over 3 years, was stronger in cortical regions with high HOMER1 mRNA expression levels. In a sample of 154 cognitively healthy older adults, Aβ correlated with poorer sleep quality cross-sectionally and longitudinally (n = 62), but more strongly in the younger than in older individuals. Effects were mainly found in regions with high expression of HOMER1. The anatomical distribution of the sleep-Aβ relationship followed closely the Aβ accumulation pattern in 69 patients with mild cognitive impairment or AD. Thus, the results indicate that the relationship between sleep problems and Aβ accumulation may involve Homer1 activity in the cortical regions, where harbor Aβ deposits in AD. The findings may advance our understanding of the relationship between sleep problems and AD risk.
Keywords: HOMER1; Alzheimer’s disease; amyloid; gene expression; sleep.
© The Author(s) 2019. Published by Oxford University Press. All rights reserved. For permissions, please e-mail: journals.permission@oup.com.
Figures
References
-
- Archer SN, Oster H. 2015. How sleep and wakefulness influence circadian rhythmicity: effects of insufficient and mistimed sleep on the animal and human transcriptome. J Sleep Res. 24:476–493. - PubMed
-
- Beck A. 1987. Beck depression inventory scoring manual. New York: The Psychological Corporation.
-
- Beck AT, Steer RA. 1984. Internal consistencies of the original and revised Beck depression inventory. J Clin Psychol. 40:1365–1367. - PubMed
-
- Brakeman PR, Lanahan AA, O'Brien R, Roche K, Barnes CA, Huganir RL, Worley PF. 1997. Homer: a protein that selectively binds metabotropic glutamate receptors. Nature. 386:284–288. - PubMed
-
- Branger P, Arenaza-Urquijo EM, Tomadesso C, Mezenge F, Andre C, Flores R, Mutlu J, Sayette V, Eustache F, Chetelat G et al. 2016. Relationships between sleep quality and brain volume, metabolism, and amyloid deposition in late adulthood. Neurobiol Aging. 41:107–114. - PubMed
Publication types
MeSH terms
Substances
Grants and funding
LinkOut - more resources
Full Text Sources
Medical
