. 2020 May 8;29(7):1144-1153.
doi: 10.1093/hmg/ddaa038.

Single cell transcriptome profiling of the human alcohol-dependent brain

Affiliations

Single cell transcriptome profiling of the human alcohol-dependent brain

Eric Brenner et al. Hum Mol Genet. .

Abstract

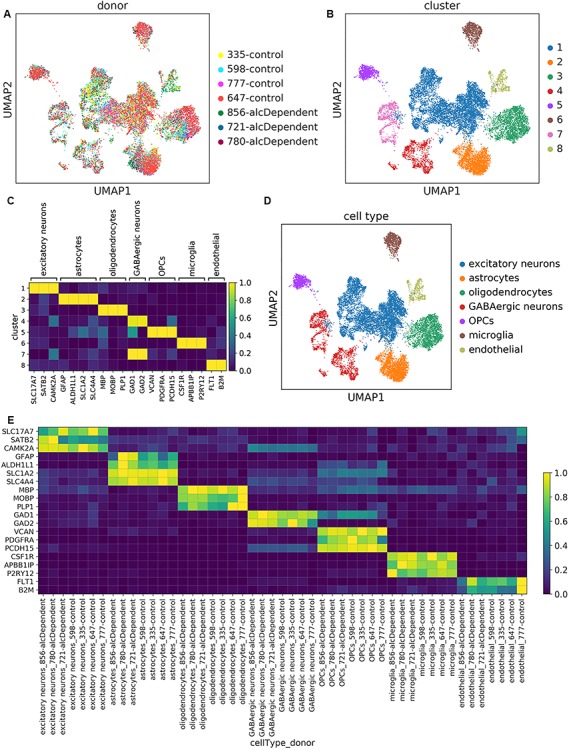
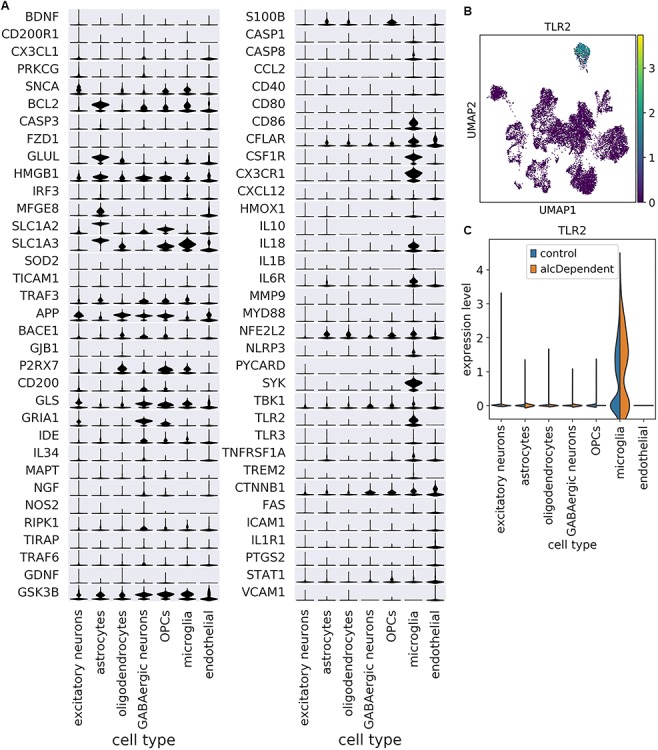
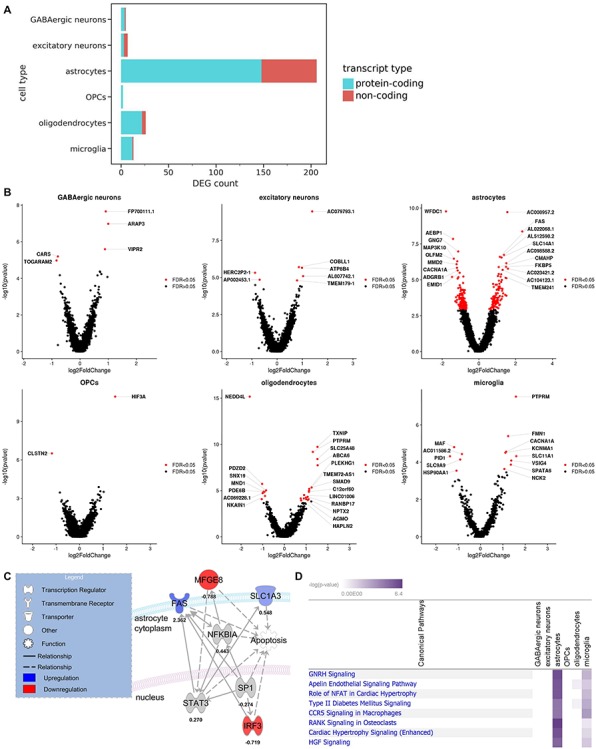
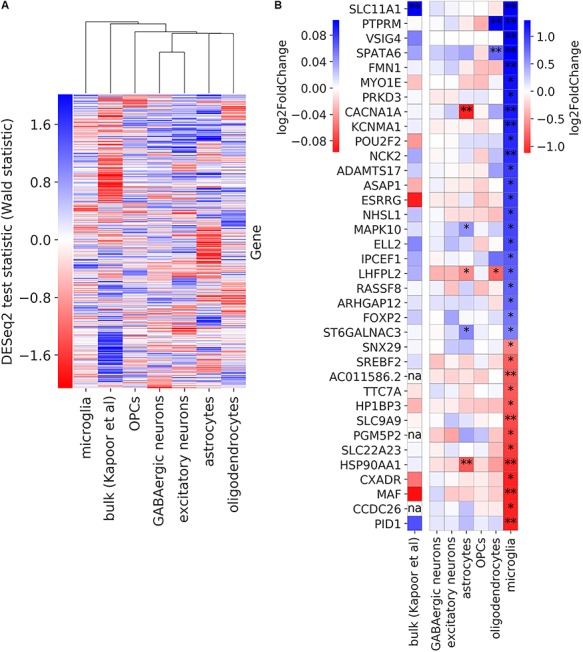
Alcoholism remains a prevalent health concern throughout the world. Previous studies have identified transcriptomic patterns in the brain associated with alcohol dependence in both humans and animal models. But none of these studies have systematically investigated expression within the unique cell types present in the brain. We utilized single nucleus RNA sequencing (snRNA-seq) to examine the transcriptomes of over 16 000 nuclei isolated from the prefrontal cortex of alcoholic and control individuals. Each nucleus was assigned to one of seven major cell types by unsupervised clustering. Cell type enrichment patterns varied greatly among neuroinflammatory-related genes, which are known to play roles in alcohol dependence and neurodegeneration. Differential expression analysis identified cell type-specific genes with altered expression in alcoholics. The largest number of differentially expressed genes (DEGs), including both protein-coding and non-coding, were detected in astrocytes, oligodendrocytes and microglia. To our knowledge, this is the first single cell transcriptome analysis of alcohol-associated gene expression in any species and the first such analysis in humans for any addictive substance. These findings greatly advance the understanding of transcriptomic changes in the brain of alcohol-dependent individuals.


Figures

Figure 1
Figure 1
Unsupervised clustering captured expected cell types in every sample. (A) UMAP plots of the 16 305 nuclei in our dataset, colored by donor or (B) transcriptomically distinct clusters determined from unsupervised clustering. (C) Scaled mean expression of known cell type markers in the different clusters. For each gene, expression was scaled from 0.0 to 1.0 to maintain a balanced colormap. (D) UMAP plot of nuclei colored by cell type assignment. (E) Scaled mean expression of marker genes for each cell type in each donor.
Figure 2
Figure 2
Cell type enrichment patterns vary among neuroimmune genes. (A) Scaled expression of neuroimmune genes among cell types. Genes are ordered by which cell type had the highest mean expression. Scaling was done for each gene across all cells. (B) UMAP plot depicting expression of TLR2 as an example of a gene that is enriched in a specific cell type (microglia). (C) TLR2 expression is enriched in microglia among nuclei from both controls and alcoholics.
Figure 3
Figure 3
DEGs associated with alcoholism were detected in every neural cell type. (A) Breakdown of DEGs by cell type and transcript type (FDR < 0.05). (B) Volcano plots of top DEGs in each cell type (FDR < 0.05). (C) An IPA molecular network including four neuroinflammation-associated DEGs in astrocytes (FDR < 0.25). Solid lines indicate direct relationships, while dashed lines indicate indirect relationships. (D) Log2 fold changes and adjusted P-values of genes were processed by IPA with FDR < 0.25 as the cutoff for indicating significant DEGs. The top canonical pathways are shown. Negative log (P-values) are derived from Fisher’s exact test.
Figure 4
Figure 4
Comparison of alcohol dependence-associated DE from human bulk RNA-seq and snRNA-seq data. (A) Gene expression changes in alcoholics for each cell type as well as bulk data from a previous study (3). Groups were hierarchically clustered using average as the linkage method. (B) Log fold change of expression in alcohol-dependent donors compared with controls for genes that are differentially expressed (FDR < 0.25) in microglia. A single asterisk indicates DE at FDR < 0.25, while a double asterisk indicates FDR < 0.05. The three genes with ‘na’ are non-protein-coding genes, which had not been included in the bulk study.

References

    1. Alcohol Facts and Statistics (2011) Alcohol Facts and Statistics https://www.niaaa.nih.gov/alcohol-health/overview-alcohol-consumption/al...(accessed July 16, 2019).
    1. Sacks J.J., Gonzales K.R., Bouchery E.E., Tomedi L.E. and Brewer R.D. (2015) 2010 national and state costs of excessive alcohol consumption. Am. J. Prev. Med., 49, e73–e79. - PubMed
    1. Kapoor M., Wang J.-C., Farris S.P., Liu Y., McClintick J., Gupta I., Meyers J.L., Bertelsen S., Chao M., Nurnberger J. et al. (2019) Analysis of whole genome-transcriptomic organization in brain to identify genes associated with alcoholism. Transl. Psychiatry, 9, 89. - PMC - PubMed
    1. Farris S.P., Arasappan D., Hunicke-Smith S., Harris R.A. and Mayfield R.D. (2015) Transcriptome Organization for chronic alcohol abuse in human brain. Mol. Psychiatry, 20, 1438–1447. - PMC - PubMed
    1. Augier E., Barbier E., Dulman R.S., Licheri V., Augier G., Domi E., Barchiesi R., Farris S., Nätt D., Mayfield R.D. et al. (2018) A molecular mechanism for choosing alcohol over an alternative reward. Science, 360, 1321–1326. - PubMed

Publication types

MeSH terms