. 2020 Apr 8;20(4):2230-2245.
doi: 10.1021/acs.nanolett.9b04083. Epub 2020 Mar 20.

Fluctuation-Based Super-Resolution Traction Force Microscopy

Affiliations

Fluctuation-Based Super-Resolution Traction Force Microscopy

Aki Stubb et al. Nano Lett. .

Abstract

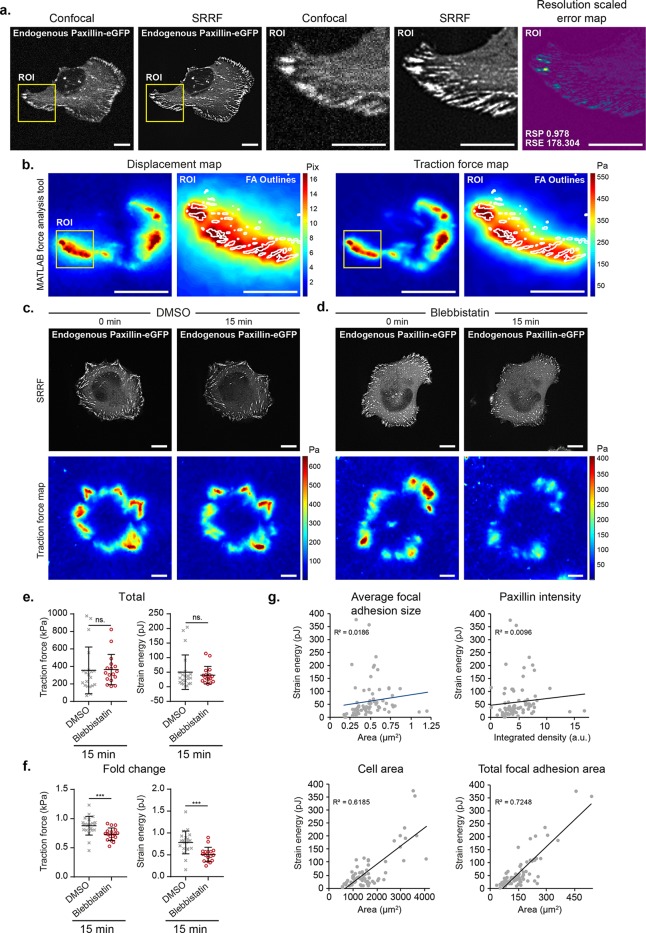
Cellular mechanics play a crucial role in tissue homeostasis and are often misregulated in disease. Traction force microscopy is one of the key methods that has enabled researchers to study fundamental aspects of mechanobiology; however, traction force microscopy is limited by poor resolution. Here, we propose a simplified protocol and imaging strategy that enhances the output of traction force microscopy by increasing i) achievable bead density and ii) the accuracy of bead tracking. Our approach relies on super-resolution microscopy, enabled by fluorescence fluctuation analysis. Our pipeline can be used on spinning-disk confocal or widefield microscopes and is compatible with available analysis software. In addition, we demonstrate that our workflow can be used to gain biologically relevant information and is suitable for fast long-term live measurement of traction forces even in light-sensitive cells. Finally, using fluctuation-based traction force microscopy, we observe that filopodia align to the force field generated by focal adhesions.

Keywords: Fluctuation-based super-resolution microscopy; SACD; SRRF; live imaging; mechanobiology; traction force microscopy.


Conflict of interest statement

The authors declare no competing financial interest.

Figures

Figure 1
Figure 1
FBSR processing enhances bead recognition in TFM specific PAA gels. (a) Cartoon illustrating the key steps used to produce TFM gels for FBSR imaging. (1) TFM gel where 40 nm fluorescent beads are embedded only on the topmost layer of the gel is generated. (2) TFM gels are then imaged using a spinning-disk confocal or widefield microscope. To allow for FBSR processing, each field of view is imaged 100 times. (3) SR images are then generated using available FBSR algorithms such as LiveSRRF or SACD. (b) TFM gel prepared using our improved protocol (40 nm beads embedded only at the top) was imaged using spinning-disk confocal or widefield modes. To allow for FBSR, 50 (SACD) or 100 (SRRF) frames were recorded. Average projections, LiveSRRF and SACD images are displayed. For each condition, the yellow square highlights a region of interest (ROI) that is magnified. All images are from the same field of view. Scale bar: (main) 10 μm; (inset) 2 μm. (c) Resolution scaled error maps of the LiveSRRF and SACD images displayed in b (ROI only) generated with NanoJ-SQUIRREL. Maps are color-coded to visualize areas of low (purple) and high error (yellow). As a control, the same analysis was performed using a reference frame that was rotated 90°. Scale bars 2 μm. (d) Estimation of the resolution of bead images before and after FBSR processing using Fourier ring correlation (FRC) or decorrelation analysis (see Materials and Methods for details). Results are displayed as dot plots (average projections confocal, n = 26, n = 63; LiveSRRF confocal, n = 53, n = 84; SACD confocal, n = 53, n = 56; average projections widefield, n = 24, n = 26; LiveSRRF widefield, n = 26, n = 24; SACD widefield, n = 26, n = 26). (e) Graph showing bead densities (beads per square micrometer) measured from multiple published TFM data sets and from the TFM gels (improved protocol described here) imaged using either spinning-disk confocal or widefield followed by FBSR processing using LiveSRRF or SACD.
Figure 2
Figure 2
Implementation of FBSR for TFM. (a) Schematic pipeline of a TFM experiment that includes FBSR and image quality control. The software needed to complete each step are listed. (b, c) To assess the improvement generated by FBSR-TFM over the classically used confocal-based TFM, U2OS cells expressing endogenously tagged paxillin were plated on 9.6 kPa gels containing both 40 and 200 nm beads and TFM analyses were performed (as in panel a) on the ROI (yellow square, b). Spinning-disk confocal images of 200 and 40 nm beads and FBSR images of the 40 nm beads (LiveSRRF; SACD) were used for TFM analysis using a MATLAB-based software. For each method, images of beads alone and beads (black) + displacement vectors (blue arrows, length scaled up by 2) and maps of bead displacement and traction force are displayed (c). The magnitudes of bead displacement and traction force are color-coded as indicated. Scale bars 10 μm. Analyses of the full field of view from panel b can be found in Supplementary Figure 3. Bead tracking was performed here using cross-correlation within the search window. The same analysis performed using PIV can be found in Supplementary Figure 4.
Figure 3
Figure 3
Applying FBSR-TFM to cell biological experiments. (a–g) U2OS cells expressing endogenously tagged paxillin were plated on 9.6 kPa gels containing 40 nm beads and were imaged using a spinning-disk confocal. In these data sets, both the beads and paxillin were imaged for FBSR processing. All TFM analyses displayed here were performed using MATLAB. Scale bars 10 μm. (a, b) Representative images of paxillin-positive focal adhesions before and after FBSR processing using LiveSRRF. Yellow squares highlight a ROI that is magnified. (a) For the ROI, the resolution scaled error map is also displayed as in Figure 1c. (b) Associated bead displacement and traction force maps are also displayed. In the ROI, the focal adhesion outlines are drawn in white. (c–g) U2OS cells expressing endogenously tagged paxillin were treated with either (c) DMSO or (d) 10 μM blebbistatin for 15 min and FBSR-TFM was performed at both time points. (c, d) Representative images of cells and the corresponding traction maps are displayed. (e, f) Quantification of overall total forces and strain energy (SE) after treatments (cropped to include only one cell) and the fold change in total force and SE per field of view are displayed as dot plots (DMSO, n = 22; blebbistatin, n = 17; 2 biological repeats). Statistics: Mann–Whitney U test. ∗∗∗p ≤ 0.004. (g) Correlations between SE and multiple focal adhesion parameters are also shown (n = 78 cells).
Figure 4
Figure 4
Live cell imaging and large field of view FBSR-TFM. (a) U-251 glioma cells expressing endogenously tagged paxillin were plated on 9.6 kPa TFM gels containing 40 nm beads. Cells were imaged live, every 5 min and FBSR-TFM was performed (spinning-disk confocal imaging, Live-SRRF processing and TFM analysis using MATLAB). The paxillin channel was denoised using the Noise2VOID algorithm. A representative field of view is displayed for the paxillin channel as well as the matching traction force map. The yellow square highlights a ROI that is magnified and displayed for several time points. The full movie is provided as Supporting Information (Video 1). White line depicts the leading edge of the cell. Scale bar: (main) 10 μm; (inset) 5 μm. (b) DCIS.COM lifeact-RFP cells were plated on 9.6 kPa TFM gels containing 40 nm beads. Cells were imaged live, every 20 s (80 ms exposure time per frame) over 16 min and FBSR-TFM was performed (spinning-disk confocal imaging, Live-SRRF processing and TFM analysis using MATLAB). A time projection of the lifeact channel and matching traction force maps for several time points are displayed. The full movie is provided as Supporting Information (Video 2). White line depicts the leading edge of the cell. Scale bar: 25 μm. (c, d) U2OS cells were plated on 2.6 kPa TFM gels containing 200 nm beads (classic protocol), (c) treated with SiR-DNA to label nuclei, and imaged for FBSR TFM using a widefield microscope (20× air objective). (c) The SiR-DNA images were denoised using the Noise2VOID algorithm. Both widefield and FBSR images (LiveSRRF) were used to perform TFM analyses (MATLAB software). (d) Images of the beads and the matching traction force maps are displayed. The outline of the nucleus is overlaid in magenta. Yellow squares highlight ROI that are magnified. Scale bar: (main) 100 μm; (inset) 10 μm. (e, f) Spheroids were generated from DCIS.COM lifeact-RFP cells kept in suspension for 7 days. Spheroids were then seeded on top of 9.6 kPa TFM gels containing 200 nm beads (classic protocol) for 24 h before being imaged using a confocal microscope (20× air objective). Spheroids were imaged live, every 5 min and FBSR-TFM was performed (Live-SRRF processing and TFM analysis using MATLAB). (e) Several time points of a representative field of view are displayed for the lifeact channel as well as the matching traction force maps. (f) A single time point of a larger cell cluster is displayed. White lines depict the outline of the cell clusters. Scale bars: 100 μm.
Figure 5
Figure 5
Relationship between filopodia adhesions and focal adhesions. (a) U2OS cells transiently expressing Paxillin-GFP and Myosin-X-mScarlet were plated on fibronectin-coated glass bottom dishes, fixed, stained for F-actin, and imaged using structured illumination microscopy. A representative field of view is displayed. The yellow square highlights a ROI that is magnified. Scale bar: (main) 20 μm; (inset) 5 μm. The percentage of filopodia directly connected to a paxillin-positive focal adhesion (FA) was quantified and the results are displayed as a bar chart. (b, c) U2OS cells transiently expressing Paxillin-mKate2 and Myosin-X-GFP were plated on 9.6 kPa TFM gels containing 40 nm beads. Cells were imaged using a spinning-disk confocal and FBSR-TFM was performed (Live-SRRF processing and TFM analysis using MATLAB). In this data set, the beads, myosin-X (MYO10) and paxillin were imaged for FBSR processing. A representative field of view is displayed for the paxillin and MYO10 channels with and without the displacement vectors (blue arrows, length scaled up by 2) as well as the matching traction force map. The yellow square highlights a ROI that is magnified. The white lines in the displacement vectors map indicate the filopodia shafts (visible as very low intensity in the MYO10 channel). White circles in the traction map depict the location of filopodia tips. (b) Scale bar: (main) 20 μm; (inset) 5 μm. The alignment of filopodia tips to the force field was then measured using ImageJ. (c) The results are displayed as a frequency bar chart (n = 1022 filopodia). (d, e) U2OS cells transiently expressing Myosin-X-GFP were plated on fibronectin-coated glass bottom dishes for 1 h before being treated with either DMSO or 10 μM blebbistatin for 1 h. Cells were fixed and stained for paxillin and actin before being imaged using a spinning-disk confocal. A representative field of view is displayed. The yellow square highlights a ROI that is magnified. (d) Scale bar: (main) 20 μm; (inset) 10 μm. For each condition, the number of MYO10-positive filopodia per cell (DMSO, n = 70 cells; blebbistatin, n = 77 cells; ∗p value = 0.049), their length (DMSO, n > 446 filopodia; blebbistatin, n = 945 filopodia; ∗∗∗p value < 0.001), and their curvature (DMSO, n = 640 filopodia; blebbistatin, n = 945 filopodia; ∗∗∗p value < 0.001) were quantified. (e) P-values were determined using a randomization test.

References

    1. Conway J. R. W.; Jacquemet G. Cell Matrix Adhesion in Cell Migration. Essays Biochem. 2019, 63, EBC2019001210.1042/EBC20190012. - DOI - PubMed
    1. Kechagia J. Z.; Ivaska J.; Roca-Cusachs P. Integrins as Biomechanical Sensors of the Microenvironment. Nat. Rev. Mol. Cell Biol. 2019, 20 (8), 457–473. 10.1038/s41580-019-0134-2. - DOI - PubMed
    1. Heisenberg C.-P.; Bellaïche Y. Forces in Tissue Morphogenesis and Patterning. Cell 2013, 153 (5), 948–962. 10.1016/j.cell.2013.05.008. - DOI - PubMed
    1. Wickström S. A.; Niessen C. M. Cell Adhesion and Mechanics as Drivers of Tissue Organization and Differentiation: Local Cues for Large Scale Organization. Curr. Opin. Cell Biol. 2018, 54, 89–97. 10.1016/j.ceb.2018.05.003. - DOI - PubMed
    1. Duscher D.; Maan Z. N.; Wong V. W.; Rennert R. C.; Januszyk M.; Rodrigues M.; Hu M.; Whitmore A. J.; Whittam A. J.; Longaker M. T.; et al. Mechanotransduction and Fibrosis. J. Biomech. 2014, 47 (9), 1997–2005. 10.1016/j.jbiomech.2014.03.031. - DOI - PMC - PubMed

Publication types

MeSH terms

LinkOut - more resources