. 2020 Mar;13(3):e006115.
doi: 10.1161/CIRCOUTCOMES.119.006115. Epub 2020 Mar 6.

The PCORnet Blood Pressure Control Laboratory: A Platform for Surveillance and Efficient Trials

Affiliations

The PCORnet Blood Pressure Control Laboratory: A Platform for Surveillance and Efficient Trials

Mark J Pletcher et al. Circ Cardiovasc Qual Outcomes. 2020 Mar.

Abstract

Background: Uncontrolled blood pressure (BP) is a leading preventable cause of death that remains common in the US population despite the availability of effective medications. New technology and program innovation has high potential to improve BP but may be expensive and burdensome for patients, clinicians, health systems, and payers and may not produce desired results or reduce existing disparities in BP control.

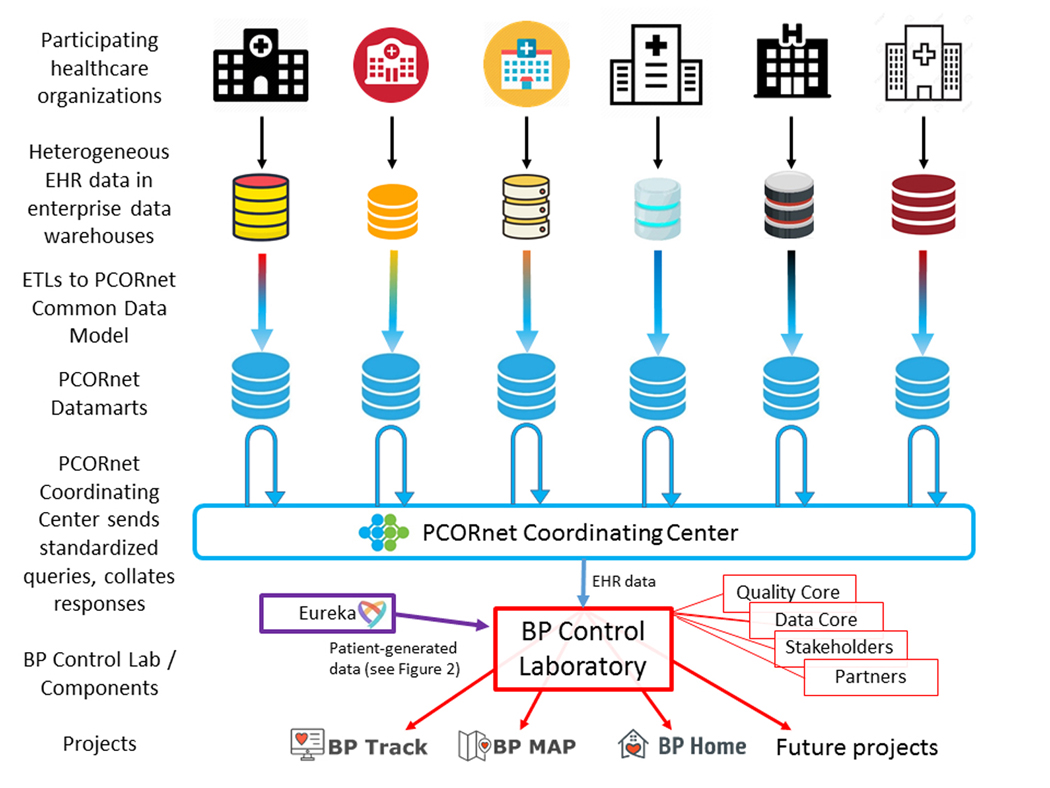
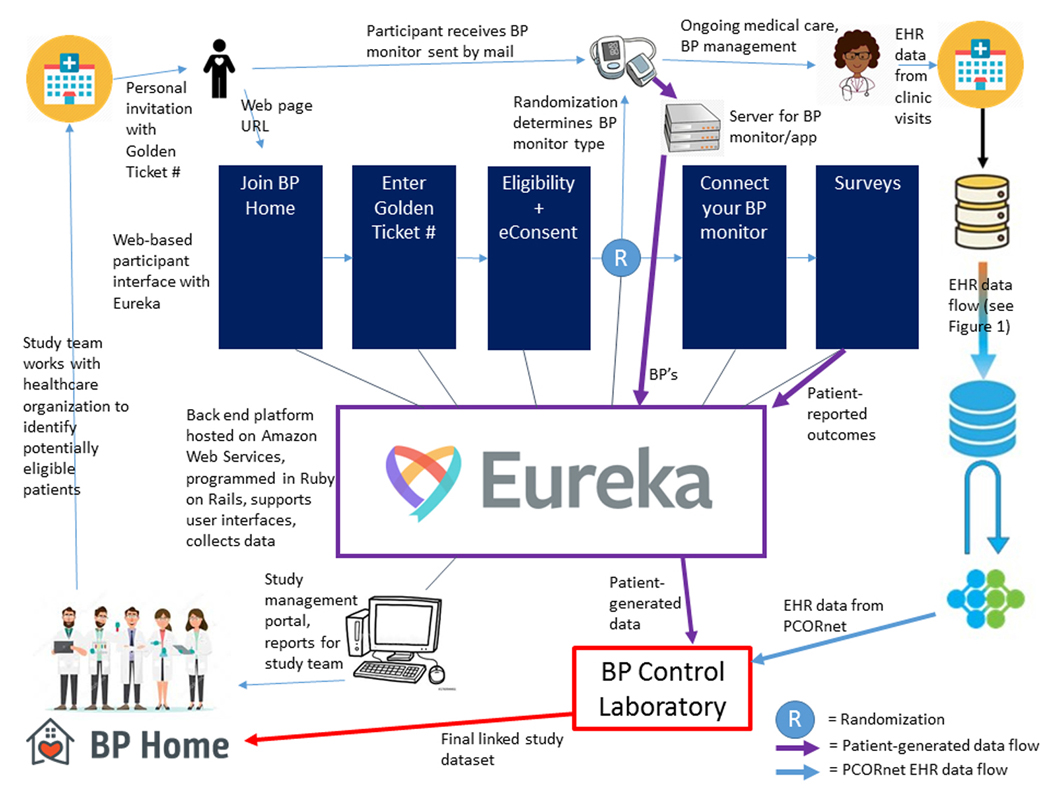
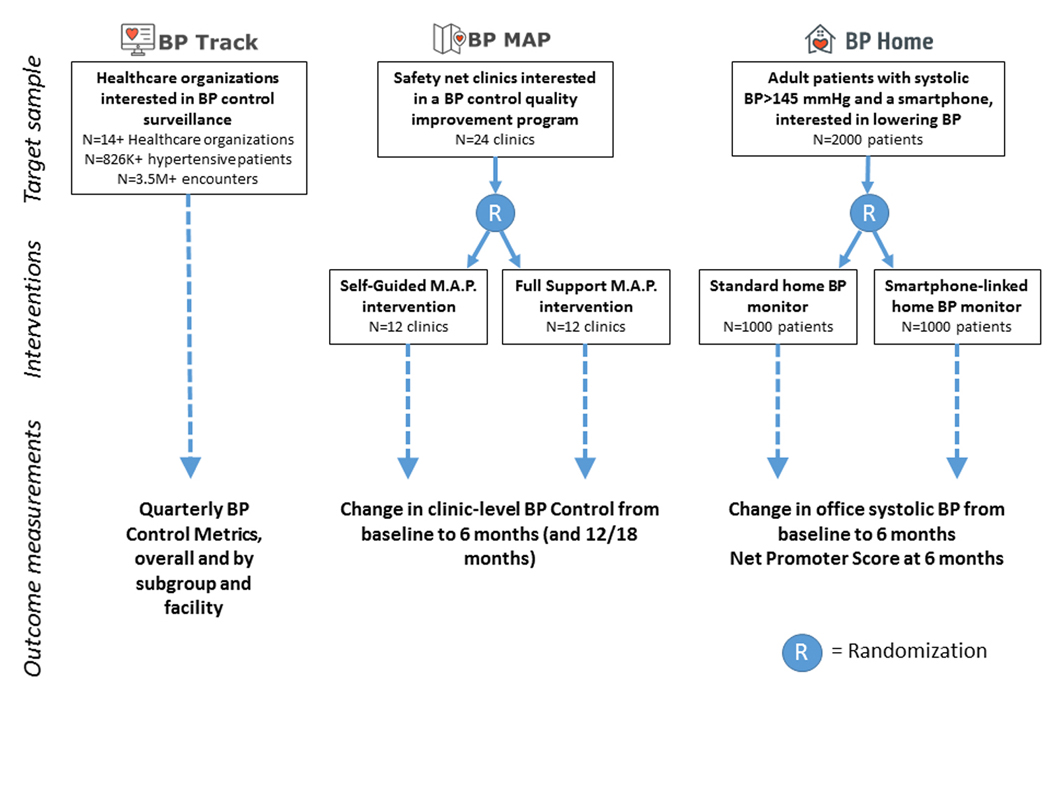
Methods and results: The PCORnet Blood Pressure Control Laboratory is a platform designed to enable national surveillance and facilitate quality improvement and comparative effectiveness research. The platform uses PCORnet, the National Patient-Centered Clinical Research Network, for engagement of health systems and collection of electronic health record data, and the Eureka Research Platform for eConsent and collection of patient-reported outcomes and mHealth data from wearable devices and smartphones. Three demonstration projects are underway: BP track will conduct national surveillance of BP control and related clinical processes by measuring theory-derived pragmatic BP control metrics using electronic health record data, with a focus on tracking disparities over time; BP MAP will conduct a cluster-randomized trial comparing effectiveness of 2 versions of a BP control quality improvement program; BP Home will conduct an individual patient-level randomized trial comparing effectiveness of smartphone-linked versus standard home BP monitoring. Thus far, BP Track has collected electronic health record data from over 826 000 eligible patients with hypertension who completed ≈3.1 million ambulatory visits. Preliminary results demonstrate substantial room for improvement in BP control (<140/90 mm Hg), which was 58% overall, and in the clinical processes relevant for BP control. For example, only 12% of patients with hypertension with a high BP measurement during an ambulatory visit received an order for a new antihypertensive medication.

Conclusions: The PCORnet Blood Pressure Control Laboratory is designed to be a reusable platform for efficient surveillance and comparative effectiveness research; results from demonstration projects are forthcoming.

Keywords: blood pressure; quality improvement; randomized controlled trial; smartphone.


Conflict of interest statement

DISCLOSURES

The authors have no other conflicts to report.

Figures

Figure 1.
Figure 1.. Electronic Health Record Data Flow and Distributed Querying in PCORnet.
Electronic health record (EHR) data are generated by participating healthcare organizations and stored in local, heterogeneously-structured comprehensive enterprise data warehouses (e.g., Clarity for Epic EHR systems). To support PCORnet, each organization executes regular extract, transform and load (ETL) operations that transform those EHR data into a homogeneous and simplified/intuitive set of relational data tables – the PCORnet Common Data Model – that are maintained on locally-controlled servers – PCORnet Datamarts – at each participating healthcare organization (blue database icons). The data are not stored centrally by PCORnet or by the Blood Pressure (BP) Control Laboratory. To access these data, The BP Control Laboratory Data Core, with input from the Quality Core, Partners, and Stakeholders, develops Common Data Model queries (written in SAS) that are distributed by the PCORnet Coordinating Center to each participating datamart. Datamarts then run the query locally and return results to the PCORnet Coordinating Center, which collates results and delivers them to the BP Control Lab. The BP Control Lab then links the EHR data with patient-generated data from Eureka as needed (e.g. for BP Home, see Figure 2), and delivers it to the project teams supported by the Laboratory. Ongoing projects include BP Track, BP MAP and BP Home (see Figure 3).
Figure 2.
Figure 2.. Patient-Generated Health Data Collection via the Eureka Research Platform.
For BP Home and future projects like it, patient-generated health data including patient-reported outcomes and blood pressure (BP) measurements from home BP monitors are collected via the Eureka Research Platform. Study teams (lower left corner) work with site personnel at healthcare organizations to identify potentially eligible patients and send them personal invitations to join the study. Interested patients go to a Eureka-hosted web portal (optimized for viewing on either a desktop or smartphone) that takes them through study information, eligibility and eConsent procedures. They also enter a “Golden Ticket #” provided with the personal invitation that enables future identity linkage. Eligible and consenting participants are randomized to one of the two study arms, and are mailed a home blood pressure (BP) monitor (Smartphone-linked or standard depending on randomization arm, see Figure 3), which they use for ongoing medical care and BP management with their clinician. Participants in the Smartphone-linked arm then authorize connecting their home BP monitor to Eureka, allowing Eureka to obtain their BP measurements from the device company server. Participants in both arms fill out surveys that allow Eureka to gather patient-reported outcomes and other information. The study team can access reports and participant information through a study management portal hosted by Eureka. The BP Control Laboratory uses the Golden Ticket # to link patient-generated data from Eureka with electronic health record (EHR) data from PCORnet (see Figure 1), and provides the final linked study dataset to the study team for analysis.
Figure 3.
Figure 3.. Design Features of Three Projects Currently Supported by the Blood Pressure Control Laboratory.
The Blood Pressure (BP) Control Laboratory currently supports BP Track (a national surveillance project), BP MAP (a cluster randomized controlled trial [RCT]), and BP Home (an individual-level RCT). In the figure, we describe the target sample (target numbers and characteristics of the sample units), interventions (for the two RCTs), and the primary outcome measurement(s) for each project. BP Control Metrics, including overall BP Control and 9 other BP-related quality metrics, are described in Table 1. M.A.P. – Measure Accurately, Act Rapidly, Partner with Patients (a quality improvement program for BP control managed by the American Medical Association), ,

References

    1. Global Burden of Disease Risk Factors. Global, regional, and national comparative risk assessment of 79 behavioural, environmental and occupational, and metabolic risks or clusters of risks, 1990–2015: a systematic analysis for the Global Burden of Disease Study 2015. Lancet. 2016;388:1659–1724. - PMC - PubMed
    1. Danaei G, Ding EL, Mozaffarian D, Taylor B, Rehm J, Murray CJ and Ezzati M. The preventable causes of death in the United States: comparative risk assessment of dietary, lifestyle, and metabolic risk factors. PLoS Med. 2009;6:e1000058. - PMC - PubMed
    1. Institute for Health Metrics and Evaluation. GBD Compare. https://vizhub.healthdata.org/gbd-compare/. Accessed July 5, 2019.
    1. Nwankwo T, Yoon SS, Burt V and Gu Q. Hypertension among adults in the United States: National Health and Nutrition Examination Survey, 2011–2012. NCHS Data Brief. 2013:1–8. - PubMed
    1. Wald DS, Law M, Morris JK, Bestwick JP and Wald NJ. Combination therapy versus monotherapy in reducing blood pressure: meta-analysis on 11,000 participants from 42 trials. Am J Med. 2009;122:290–300. - PubMed

Publication types

Substances