. 2020 Mar 6:9:e53917.
doi: 10.7554/eLife.53917.

A highly responsive pyruvate sensor reveals pathway-regulatory role of the mitochondrial pyruvate carrier MPC

Affiliations

A highly responsive pyruvate sensor reveals pathway-regulatory role of the mitochondrial pyruvate carrier MPC

Robinson Arce-Molina et al. Elife. .

Abstract

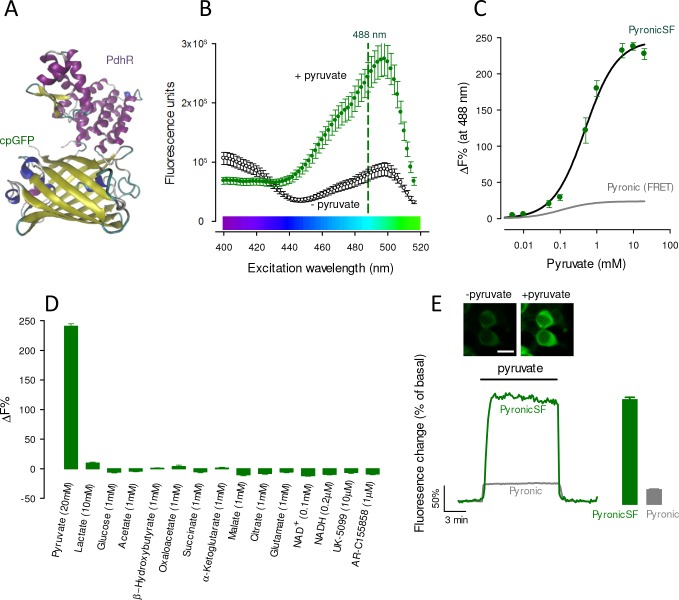
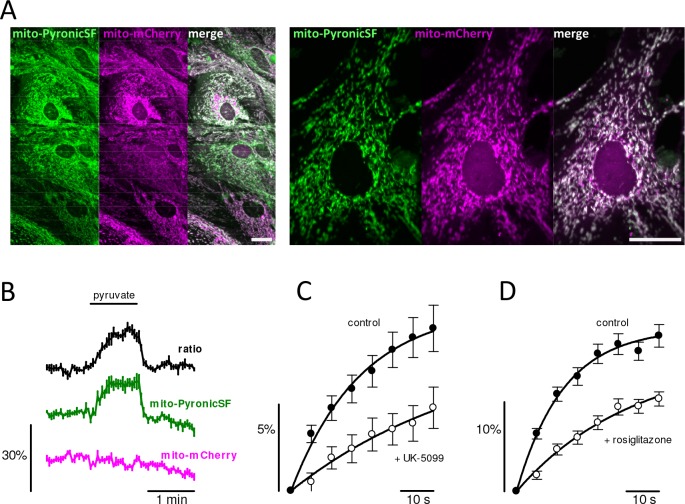
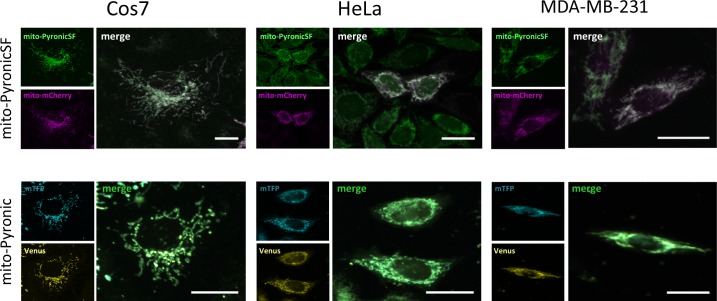
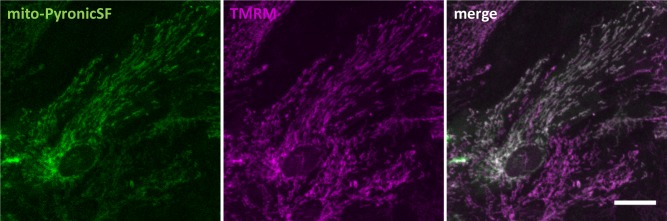
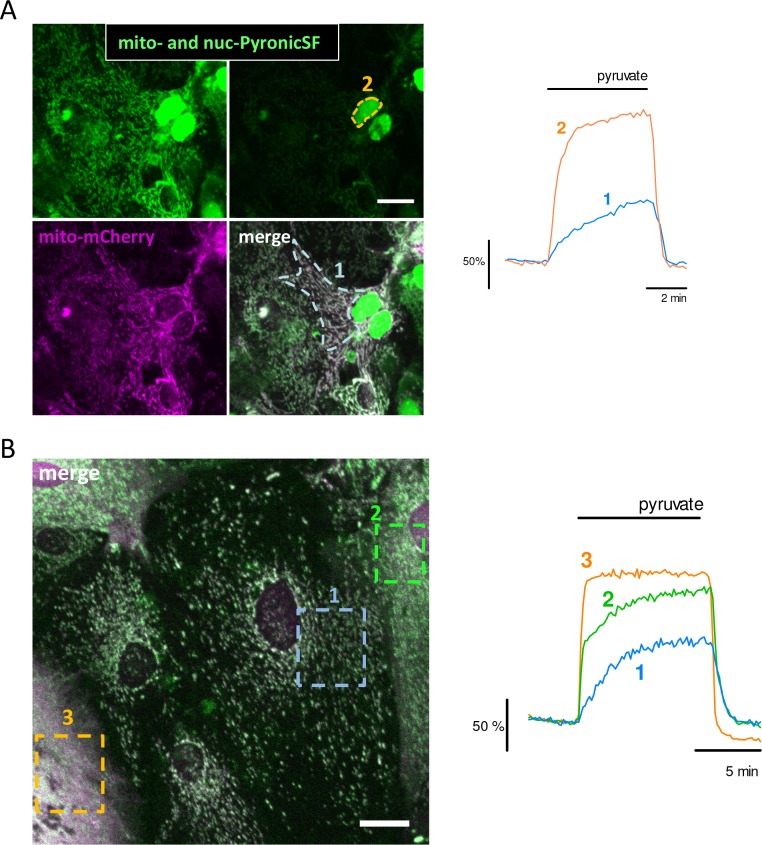
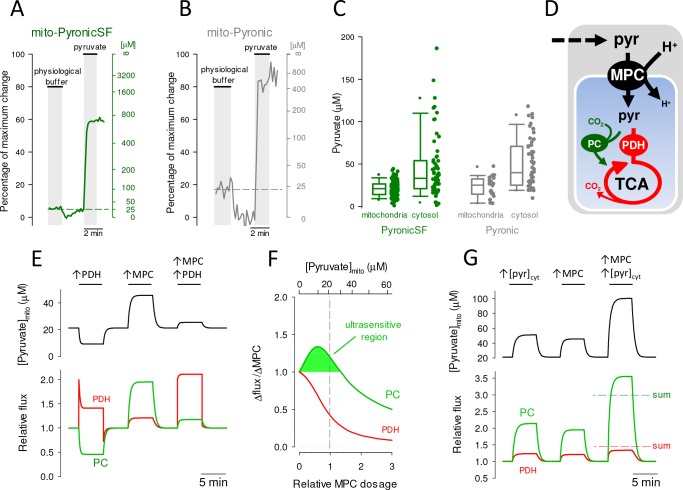
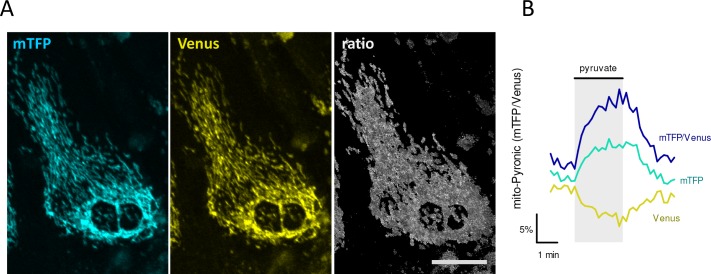
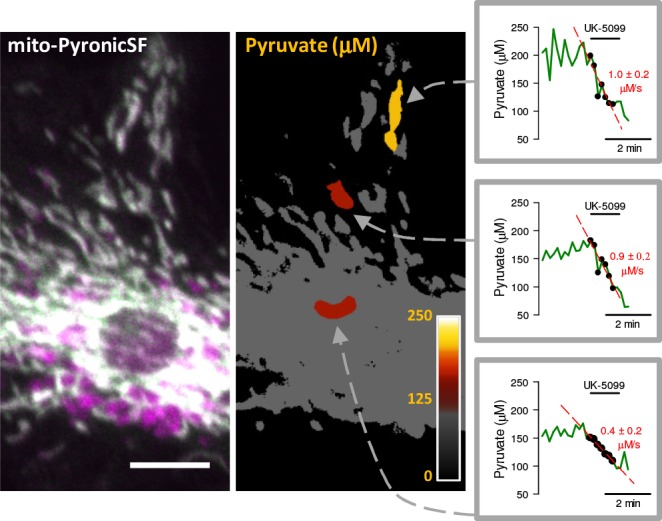
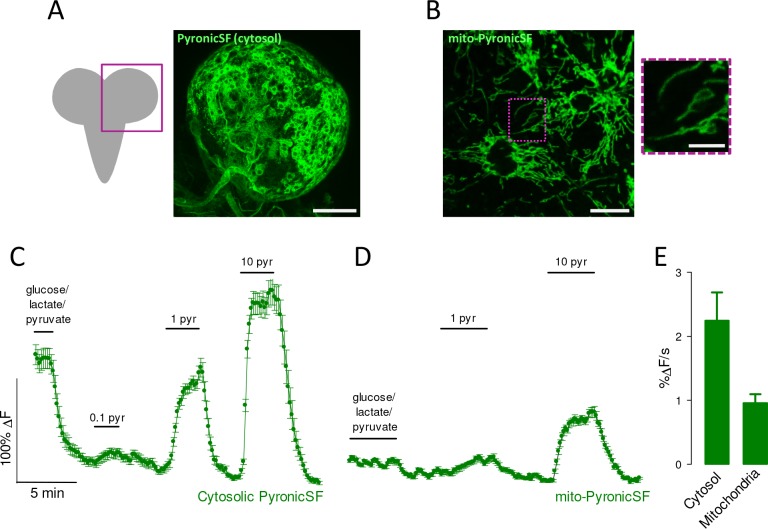
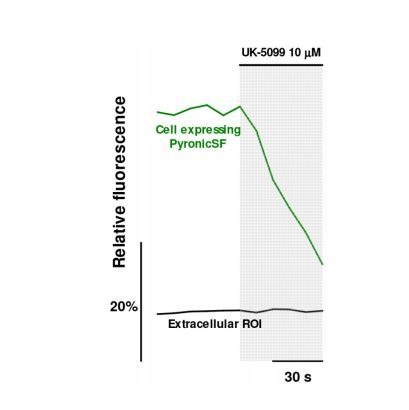
Mitochondria generate ATP and building blocks for cell growth and regeneration, using pyruvate as the main substrate. Here we introduce PyronicSF, a user-friendly GFP-based sensor of improved dynamic range that enables real-time subcellular quantitation of mitochondrial pyruvate transport, concentration and flux. We report that cultured mouse astrocytes maintain mitochondrial pyruvate in the low micromolar range, below cytosolic pyruvate, which means that the mitochondrial pyruvate carrier MPC is poised to exert ultrasensitive control on the balance between respiration and anaplerosis/gluconeogenesis. The functionality of the sensor in living tissue is demonstrated in the brain of Drosophila melanogaster larvae. Mitochondrial subpopulations are known to coexist within a given cell, which differ in their morphology, mobility, membrane potential, and vicinity to other organelles. The present tool can be used to investigate how mitochondrial diversity relates to metabolism, to study the role of MPC in disease, and to screen for small-molecule MPC modulators.

Keywords: D. melanogaster; cell biology; energy metabolism; genetically-encoded sensor; mitochondria; mouse; pyruvate; transport-stop protocol.


Conflict of interest statement

RA, FC, PS, AG, KA, SS, LB, AS No competing interests declared

Figures

Figure 1.
Figure 1.. Characterization of PyronicSF.
(A) PyronicSF. cpGFP flanked by linkers was inserted between amino acid residues 188 and 189 of PdhR. DNA sequence in Figure 1—figure supplement 1). (B) Excitation spectra of PyronicSF in the absence and presence of 10 mM pyruvate. Data are mean ± s.e.m. from 3 protein extracts. (C) PyronicSF emission (488 nm excitation) as a function of pyruvate concentration. Data are mean ± s.e.m. from 3 protein extracts. The best fit of a rectangular hyperbola to the data is shown, KD = 480 ± 65 μM, maximum fluorescence change was 247%. The in vitro saturation curve of the FRET sensor Pyronic is plotted in gray (San Martín et al., 2014a). (D) PyronicSF emission in the presence of metabolites and transport inhibitors. Data are mean ± s.e.m. from 3 protein extracts. (E) Pyruvate dynamics in mammalian cells. HEK293 cells expressing PyronicSF were exposed to 10 mM pyruvate. Images show cells before and during exposure to pyruvate. Bar represents 20 μm. Bar graphs summarize data (mean ± s.e.m.) from 54 cells in four experiments (PyronicSF), and 59 cells in five experiments (Pyronic).
Figure 1—figure supplement 1.
Figure 1—figure supplement 1.. Nucleotide sequence of PyronicSF.
Figure 1—figure supplement 2.
Figure 1—figure supplement 2.. Correction of the effect of pH on PyronicSF and a mutant of PyronicSF with reduced response to pyruvate but conserved response to pH.
Figure 2.
Figure 2.. MPC-mediated mitochondrial pyruvate transport in astrocytes.
(A) Astrocytes co-expressing mito-PyronicSF (green) and mito-mCherry (magenta). Bars represent 10 μm. (B) Cultures were exposed to 3 mM pyruvate. Data correspond to mean ± s.e.m. (4 cells in a representative experiment). (C) Cultures were exposed to 3 mM pyruvate in the absence (black symbols) and presence of 10 μM UK-5099 (white symbols). Data are mean ± s.e.m. of 31 cells from eight experiments. Initial rates (%/min), estimated by fitting a single exponential function to the data (continuous lines), were 32 ± 4 (control) and 10 ± 5 (UK-5099). (D) Cultures were exposed to 3 mM pyruvate in the absence (black symbols) and presence of 30 μM rosiglitazone (white symbols). Data are mean ± s.e.m. of 51 cells from nine experiments. Initial rates (%/min), estimated by fitting a single exponential function to the data (continuous lines), were 78 ± 6 (control) and 26 ± 3 (rosiglitazone).
Figure 2—figure supplement 1.
Figure 2—figure supplement 1.. Expression of mito-PyronicSF and mito-Pyronic in various cell types.
Figure 2—figure supplement 2.
Figure 2—figure supplement 2.. Mitochondrial localization of mito-PyronicSF in astrocytes.
Figure 2—figure supplement 3.
Figure 2—figure supplement 3.. Mitochondrial pyruvate uptake is slower than cytosolic pyruvate uptake.
Figure 3.
Figure 3.. Steady-state mitochondrial and cytosolic pyruvate.
Astrocytes expressing PyronicSF or Pyronic in mitochondria or cytosol were first incubated in a buffer containing physiological concentrations of glucose (2 mM), lactate (2 mM) and pyruvate (0.2 mM), followed by removal of pyruvate by accelerated-exchange with 10 mM lactate and exposure to 10 mM pyruvate. (A) Representative trace from a single astrocyte expressing mito-PyronicSF. Data are shown as percentage of the maximum change (left) and pyruvate concentration (right), with reference to the response of the sensor obtained in vitro (Figure 1C). (B) Representative trace from a single astrocyte expressing mito-Pyronic. Data are shown as percentage of the maximum change (left) and pyruvate concentration (right), with reference to the response of the sensor obtained in vitro (San Martín et al., 2014a). (C) Steady-state mitochondrial and cytosolic pyruvate concentrations measured with PyronicSF or Pyronic at physiological concentrations of glucose, lactate and pyruvate, as illustrated in panels A and B. Data are from 131 cells in ten experiments (mito-PyronicSF), 59 cells in four experiments (cytosolic PyronicSF), 20 cells in seven experiments (mito-Pyronic), and 50 cells in five experiments (cytosolic Pyronic). (D) Mitochondrial pyruvate dynamics. Pyruvate enters mitochondria (blue compartment) and is metabolized by PDH and the tricarboxylic acid cycle (TCA), or is carboxylated by PC. (E) Simulation of pyruvate dynamics in response to PDH and MPC modulation. The effects of activating PDH and MPC by 100% on mitochondrial pyruvate concentration (top panel) and on the fluxes of PDH and PC (bottom panel) are shown. Steady-state cytosolic and mitochondrial pyruvate were 33 μM and 21 μM. Cytosolic and mitochondrial pH were 7.2 and 7.8. Steady-state PDH and PC fluxes were 0.91 and 0.29 μM/s. (F) Ultrasensitive modulation of PC flux by the MPC. The curves show the degree of flux increase at PC and PDH relative to the degree of MPC activation. The shaded area under the PC curve indicates the range of pyruvate concentrations at which PC flux increases more than 1% when MPC is activated by 1%. MPC dosage was normalized at 3.24 μM. (G) Synergic effect of cytosolic pyruvate and MPC activity on PC flux. The effects of increasing cytosolic pyruvate and MPC activity by 100% on mitochondrial pyruvate concentration (top panel) and on the fluxes of PDH and PC (bottom panel) are shown. The sums of the independent effects are indicated by interrupted lines.
Figure 3—figure supplement 1.
Figure 3—figure supplement 1.. Functional expression of the FRET sensor Pyronic in mitochondria.
Figure 3—figure supplement 2.
Figure 3—figure supplement 2.. Intra- and inter-experimental contributions to cell-to-cell metabolic heterogeneity of astrocytes.
Figure 3—figure supplement 3.
Figure 3—figure supplement 3.. No apparent correlation between PyronicSF expression and mitochondrial pyruvate concentration and consumption.
Figure 3—figure supplement 4.
Figure 3—figure supplement 4.. Performance of PyronicSF in the low micromolar range.
Figure 3—figure supplement 5.
Figure 3—figure supplement 5.. Sensitivity of PyronicSF and Pyronic.
Figure 4.
Figure 4.. Measurement of mitochondrial pyruvate consumption rate in individual cells.
(A) Time course of mitochondrial pyruvate level after an astrocyte was exposed 5 mM pyruvate and then to 10 μM UK-5099. The new steady-state is represented on the right, as percentage of the level before addition of UK-5099. Median = 62%. Data are from 29 cells in ten experiments. (B) An astrocyte incubated in 5 mM pyruvate was exposed three times for 30 s to 0.5 μM UK-5099. Rates of pyruvate depletion are shown in red. The result of three similar experiments (9 cells) is shown below. (C) The rate of mitochondrial pyruvate depletion induced with 10 μM UK-5099 was monitored before and after exposure to the proton ionophore FCCP (1 μM). Data are mean ± s.e.m (29 cells in three experiments). (D) The rate of mitochondrial pyruvate depletion induced with 10 μM UK-5099 was monitored before, during and after exposure to the cytochrome oxidase inhibitor azide (5 mM; 16 cells in three experiments). (E) An astrocyte superfused with 3 mM pyruvate was exposed to 10 μM UK-5099, resulting in a rate of depletion of 1.2 μM/s. The right panel represents the summary of sixteen experiments (44 cells).
Figure 5.
Figure 5.. Pyruvate concentration and consumption in discrete mitochondria.
Mito-PyronicSF (gray) in an astrocyte expressing mito-PyronicSF and mito-mCherry (left). Bar represents 10 μm. The righthand image shows three regions of interest colored according to the look-up table in the inset (0 to 250 μM pyruvate, calibrated as described for Figure 3). The three graphs show pyruvate consumption rates in the regions of interest, determined with 10 μM UK-5099 in cells incubated with 3 mM pyruvate.
Figure 6.
Figure 6.. Pyruvate dynamics in glial cells of Drosophila melanogaster.
Brains were acutely dissected from Drosophila melanogaster larvae expressing PyronicSF in the cytosol or mitochondria of perineurial glial cells. (A) PyronicSF in the cytosol of perineurial cells. Bar represents 100 μm. (B) Mito-PyronicSF in perineurial cells. Bar represents 10 μm. An area containing clearly identifiable mitochondria is shown under higher magnification on the right. Bar represents 5 μm. (C) A brain expressing cytosolic PyronicSF in perineurial cells was superfused with HL3 buffer containing 5 mM glucose, 1 mM lactate and 0.5 mM pyruvate. After removal of the substrates, the tissue was sequentially exposed to 0.1, 1 and 10 mM pyruvate. Data are mean ± s.e.m. (20 cells). (D) A brain expressing mito-PyronicSF in perineurial cells was superfused with HL3 buffer containing 5 mM glucose, 1 mM lactate and 0.5 mM pyruvate. After removal of the substrates, the tissue was sequentially exposed to 1 and 10 mM pyruvate. Data are mean ± s.e.m. (20 cells). (E) Rates of PyronicSF fluorescence increase in response to 10 mM pyruvate. Data are mean ± s.e.m. (60 cells from three experiments similar to those shown in C-D).
Author response image 1.
Author response image 1.. Lack of measurable fluorescence of 10 µM UK-5099.
The response to 10 µM UK-5099 of an astrocyte expressing mito-PyronicSF was compared with that of a neighboring region of interest (ROI) devoid of cells (488 excitation, 525 ± 25 emission). While the astrocytic signal decreased steadily, there was no apparent change in the intensity of the extracellular ROI.

References

    1. Arce-Molina R, Cortés-Molina F, Sandoval PY, Galaz A, Alegría K, Schirmeier S, Barros LF, San Martín A. A highly responsive pyruvate sensor reveals pathway-regulatory role of the mitochondrial pyruvate carrier MPC. bioRxiv. 2019 doi: 10.1101/611806. - DOI - PMC - PubMed
    1. Azarias G, Perreten H, Lengacher S, Poburko D, Demaurex N, Magistretti PJ, Chatton J-Y. Glutamate Transport Decreases Mitochondrial pH and Modulates Oxidative Metabolism in Astrocytes. Journal of Neuroscience. 2011;31:3550–3559. doi: 10.1523/JNEUROSCI.4378-10.2011. - DOI - PMC - PubMed
    1. Baeza-Lehnert F, Saab AS, Gutiérrez R, Larenas V, Díaz E, Horn M, Vargas M, Hösli L, Stobart J, Hirrlinger J, Weber B, Barros LF. Non-Canonical control of neuronal energy status by the na+ Pump. Cell Metabolism. 2019;29:668–680. doi: 10.1016/j.cmet.2018.11.005. - DOI - PubMed
    1. Baird GS, Zacharias DA, Tsien RY. Circular permutation and receptor insertion within green fluorescent proteins. PNAS. 1999;96:11241–11246. doi: 10.1073/pnas.96.20.11241. - DOI - PMC - PubMed
    1. Barros LF. Current technical approaches to brain energy metabolism. Glia. 2018;66:1138–1159. doi: 10.1002/glia.23248. - DOI - PMC - PubMed

Publication types

MeSH terms

Substances