. 2020 Apr 8;27(4):556-570.e6.
doi: 10.1016/j.chom.2020.02.004. Epub 2020 Mar 5.

TMEM173 Drives Lethal Coagulation in Sepsis

Affiliations

TMEM173 Drives Lethal Coagulation in Sepsis

Hui Zhang et al. Cell Host Microbe. .

Abstract

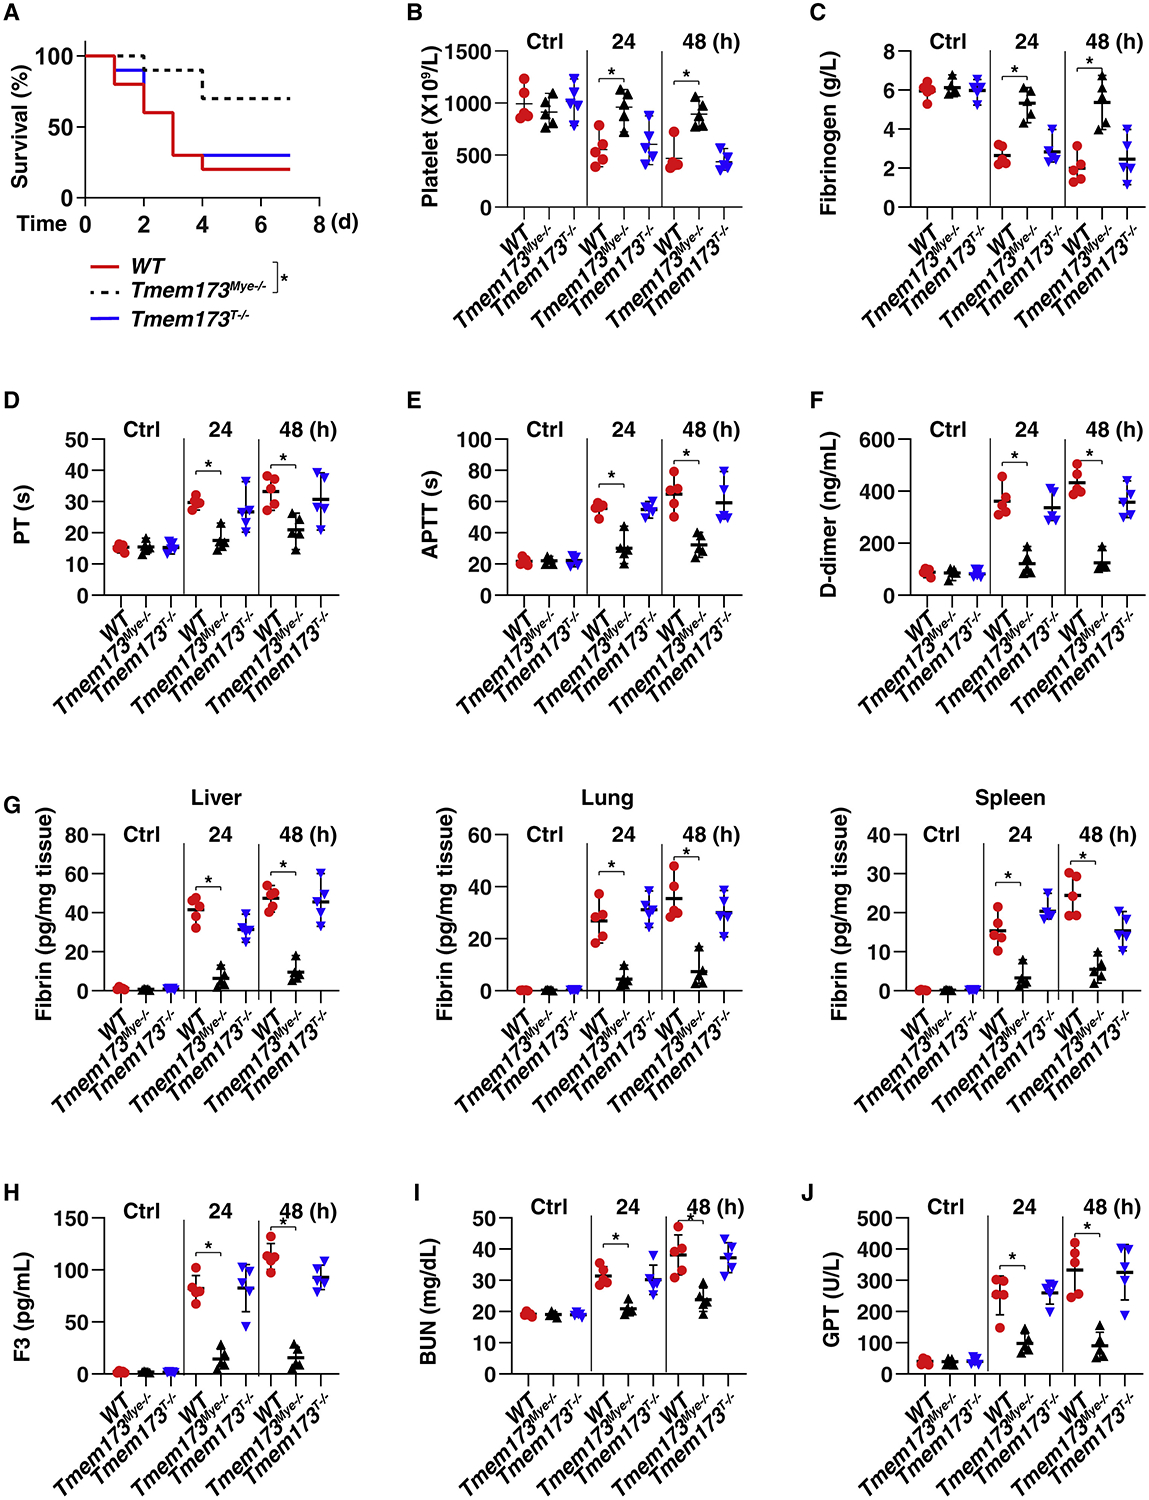
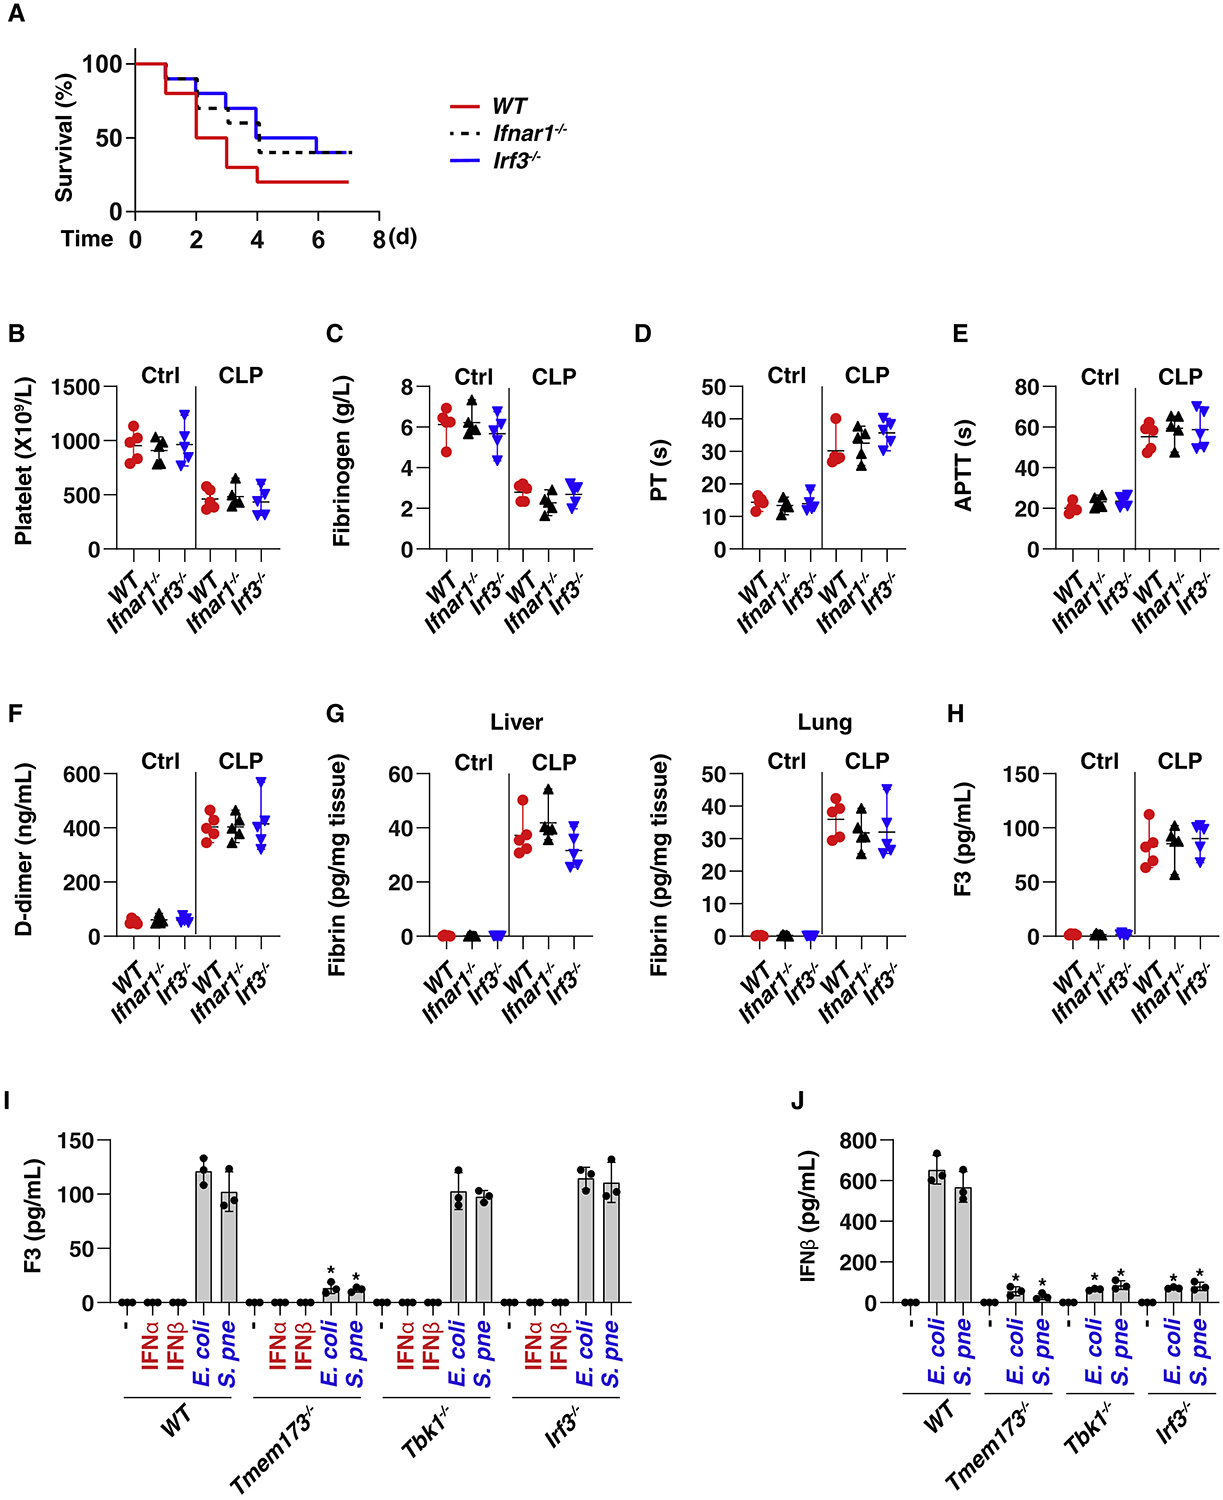
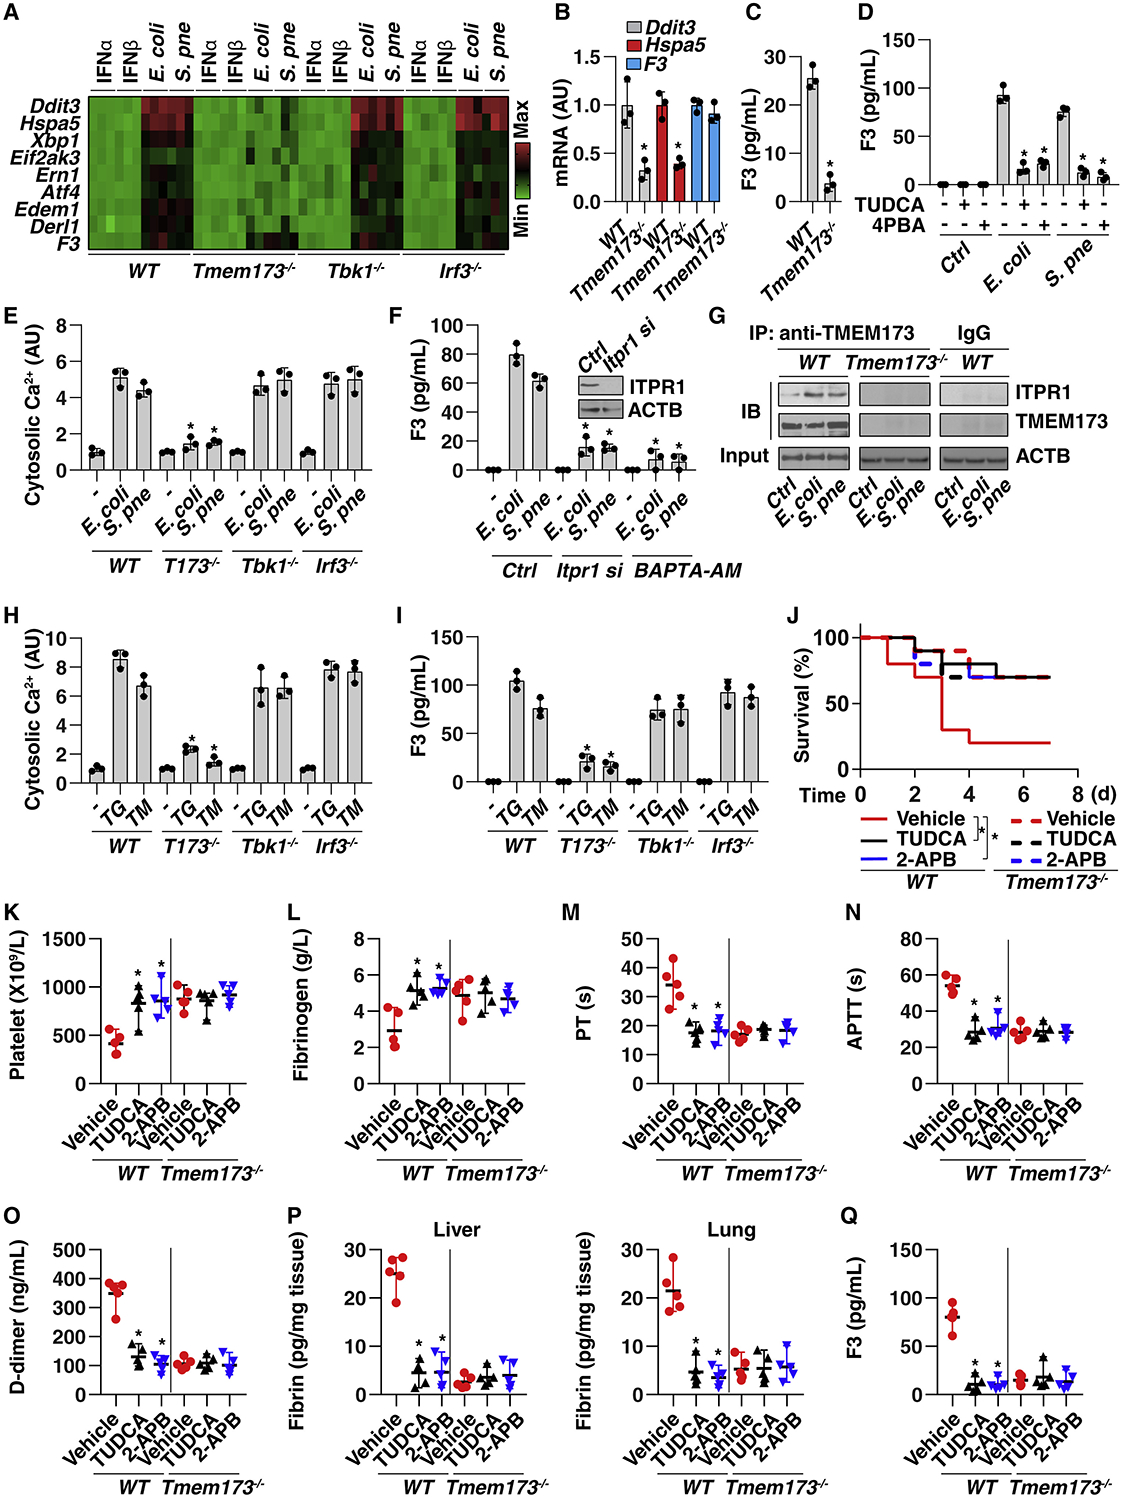
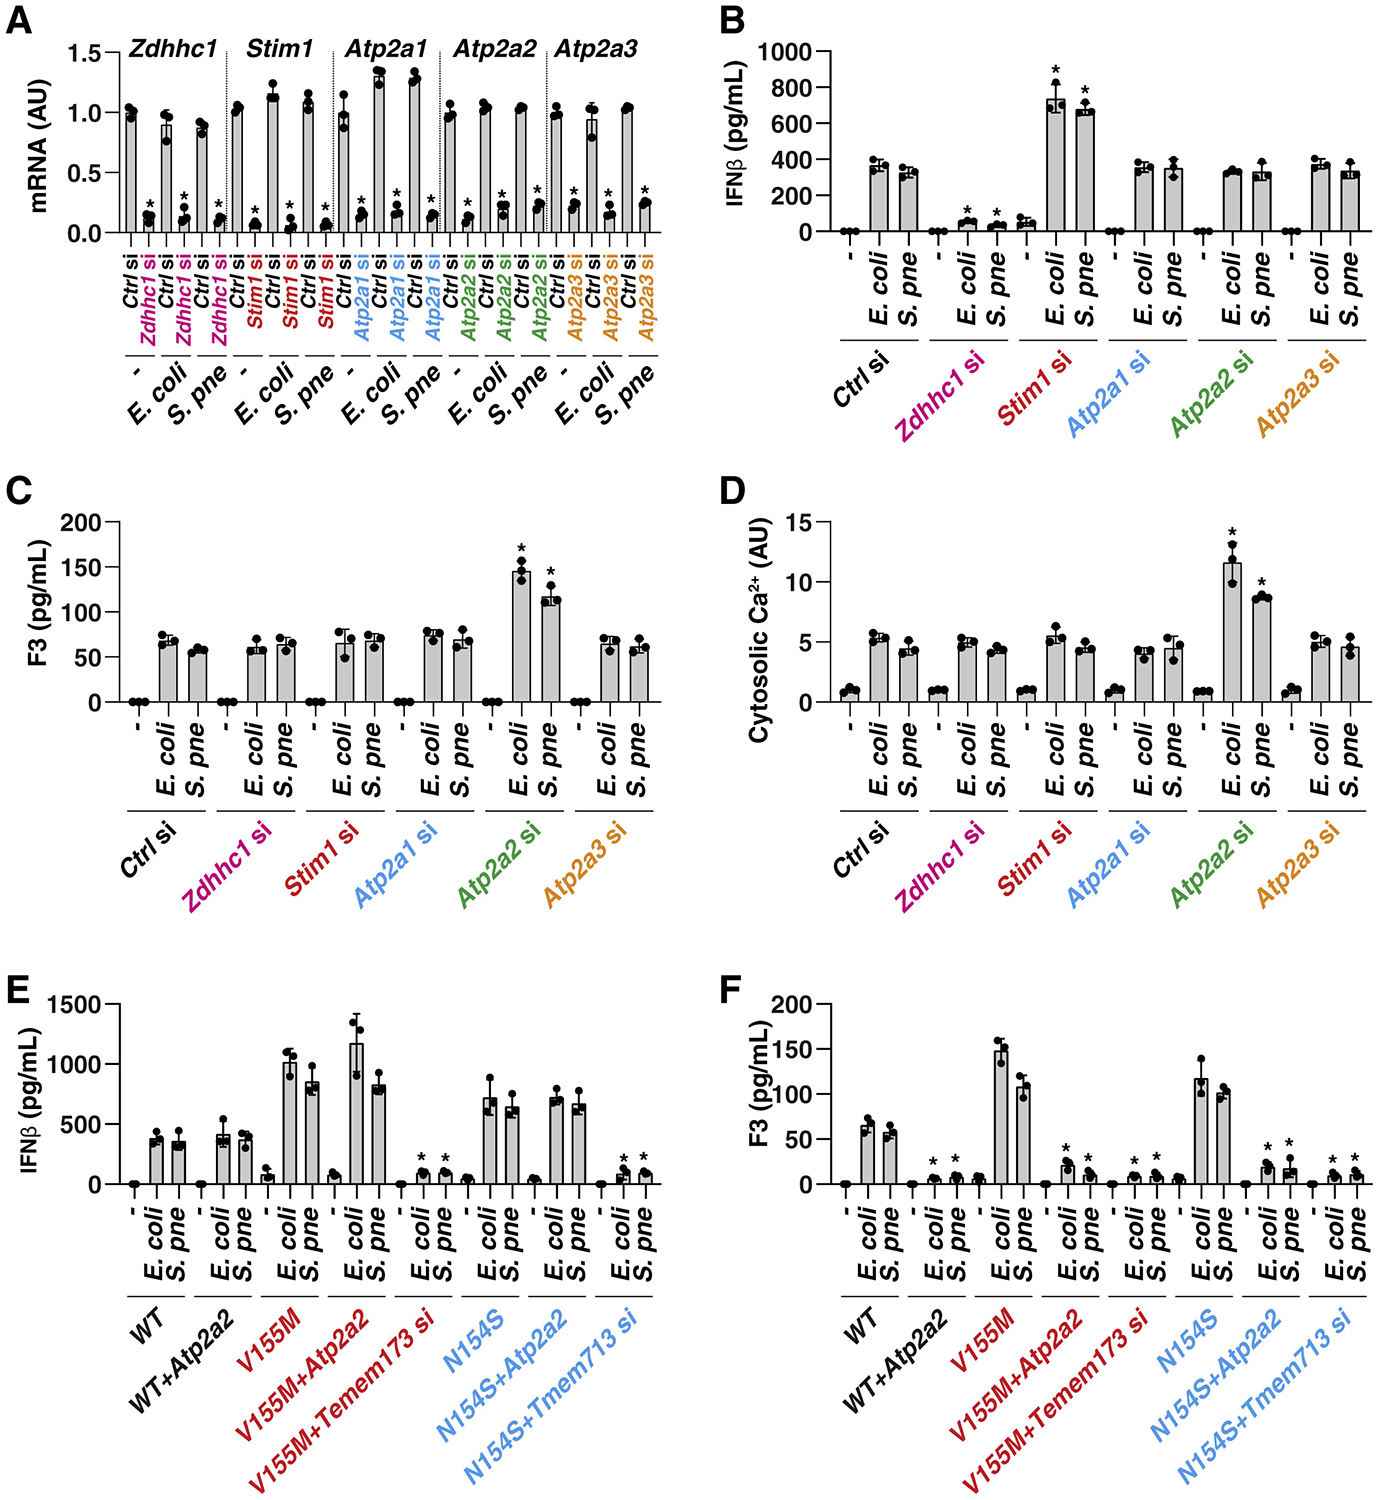
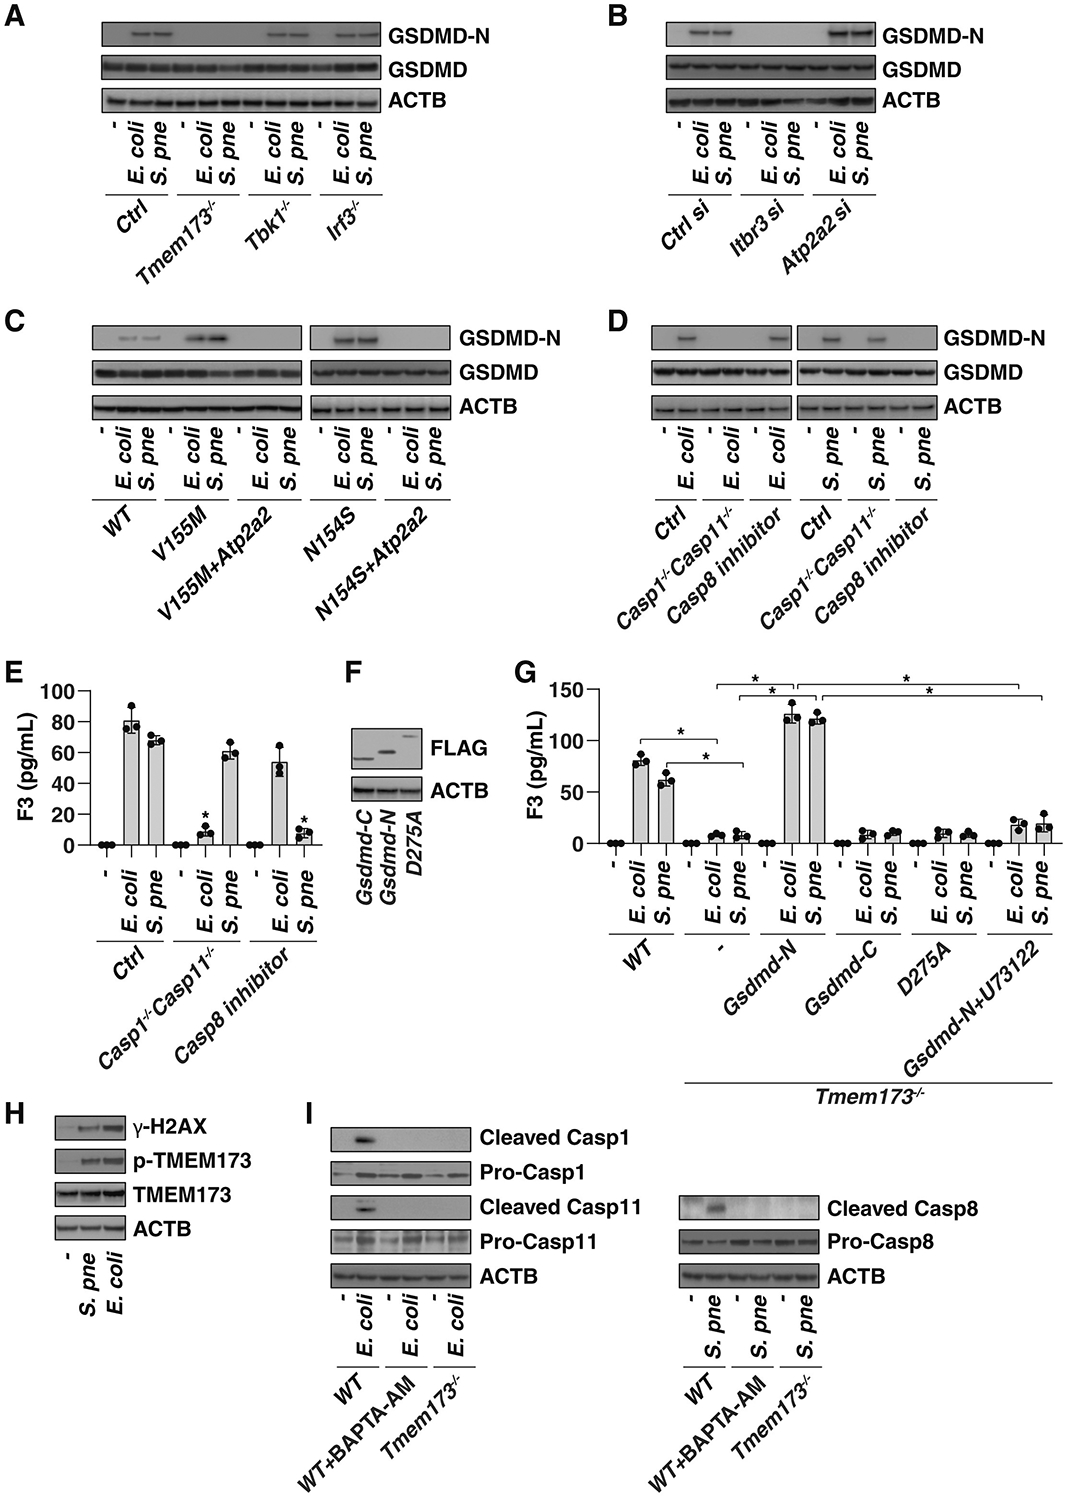
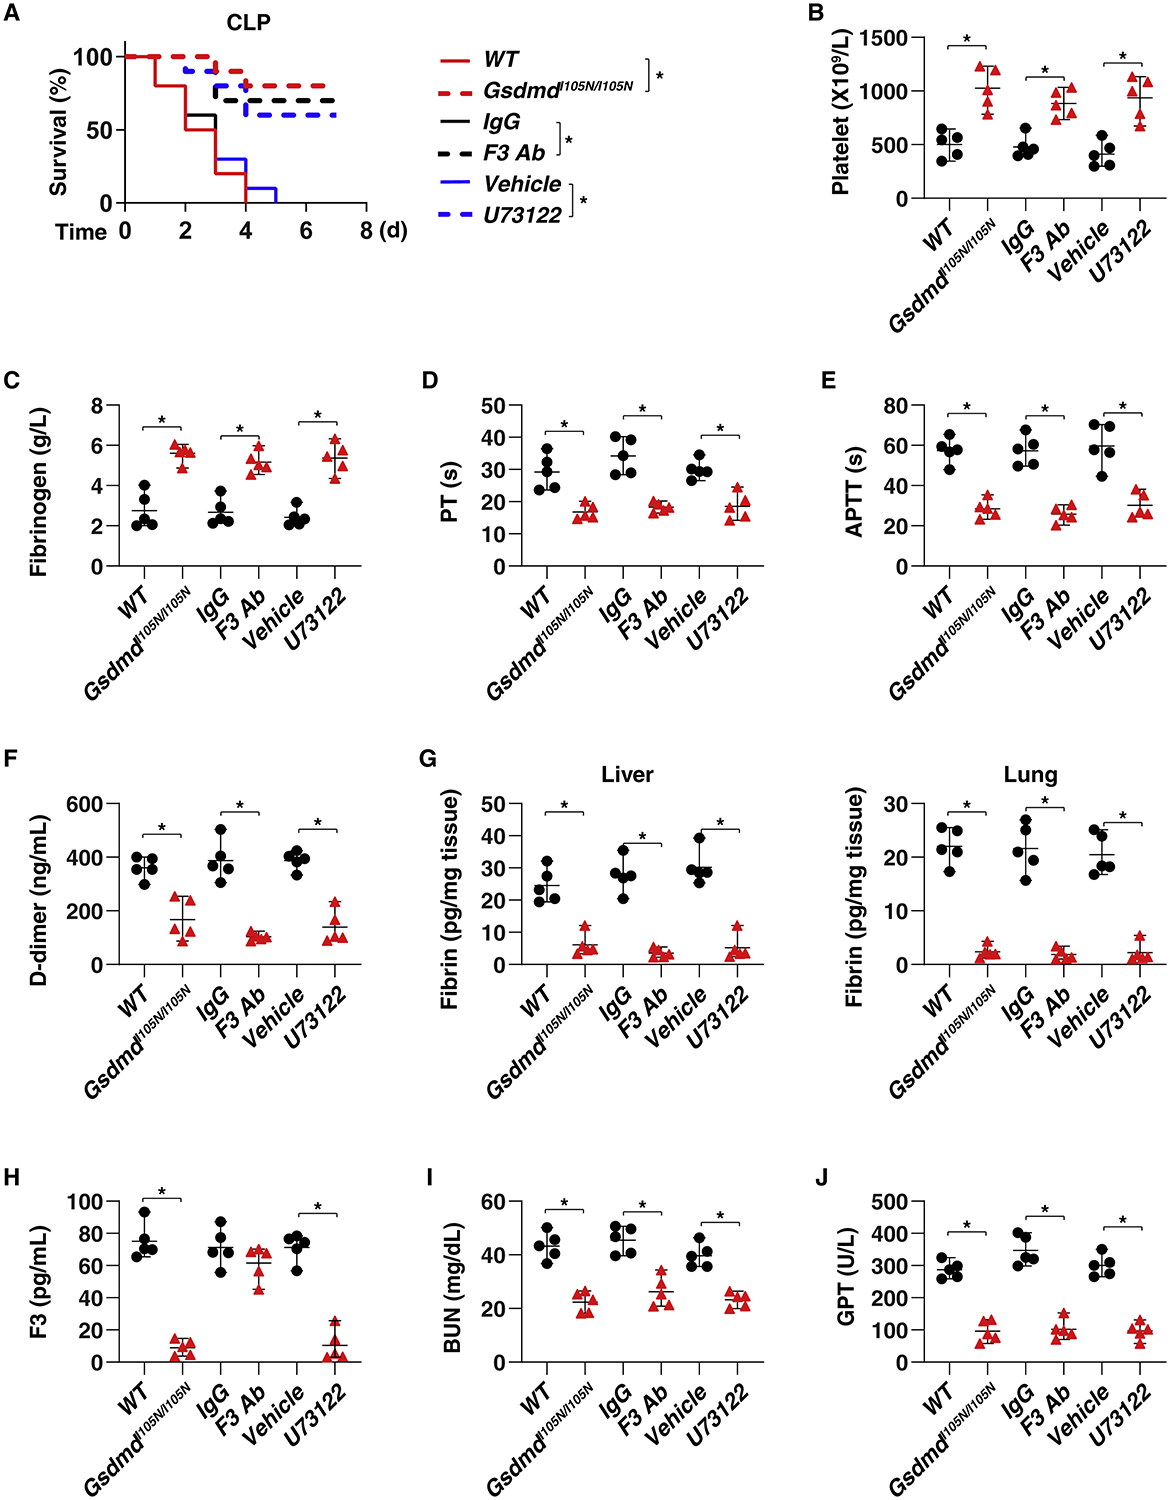
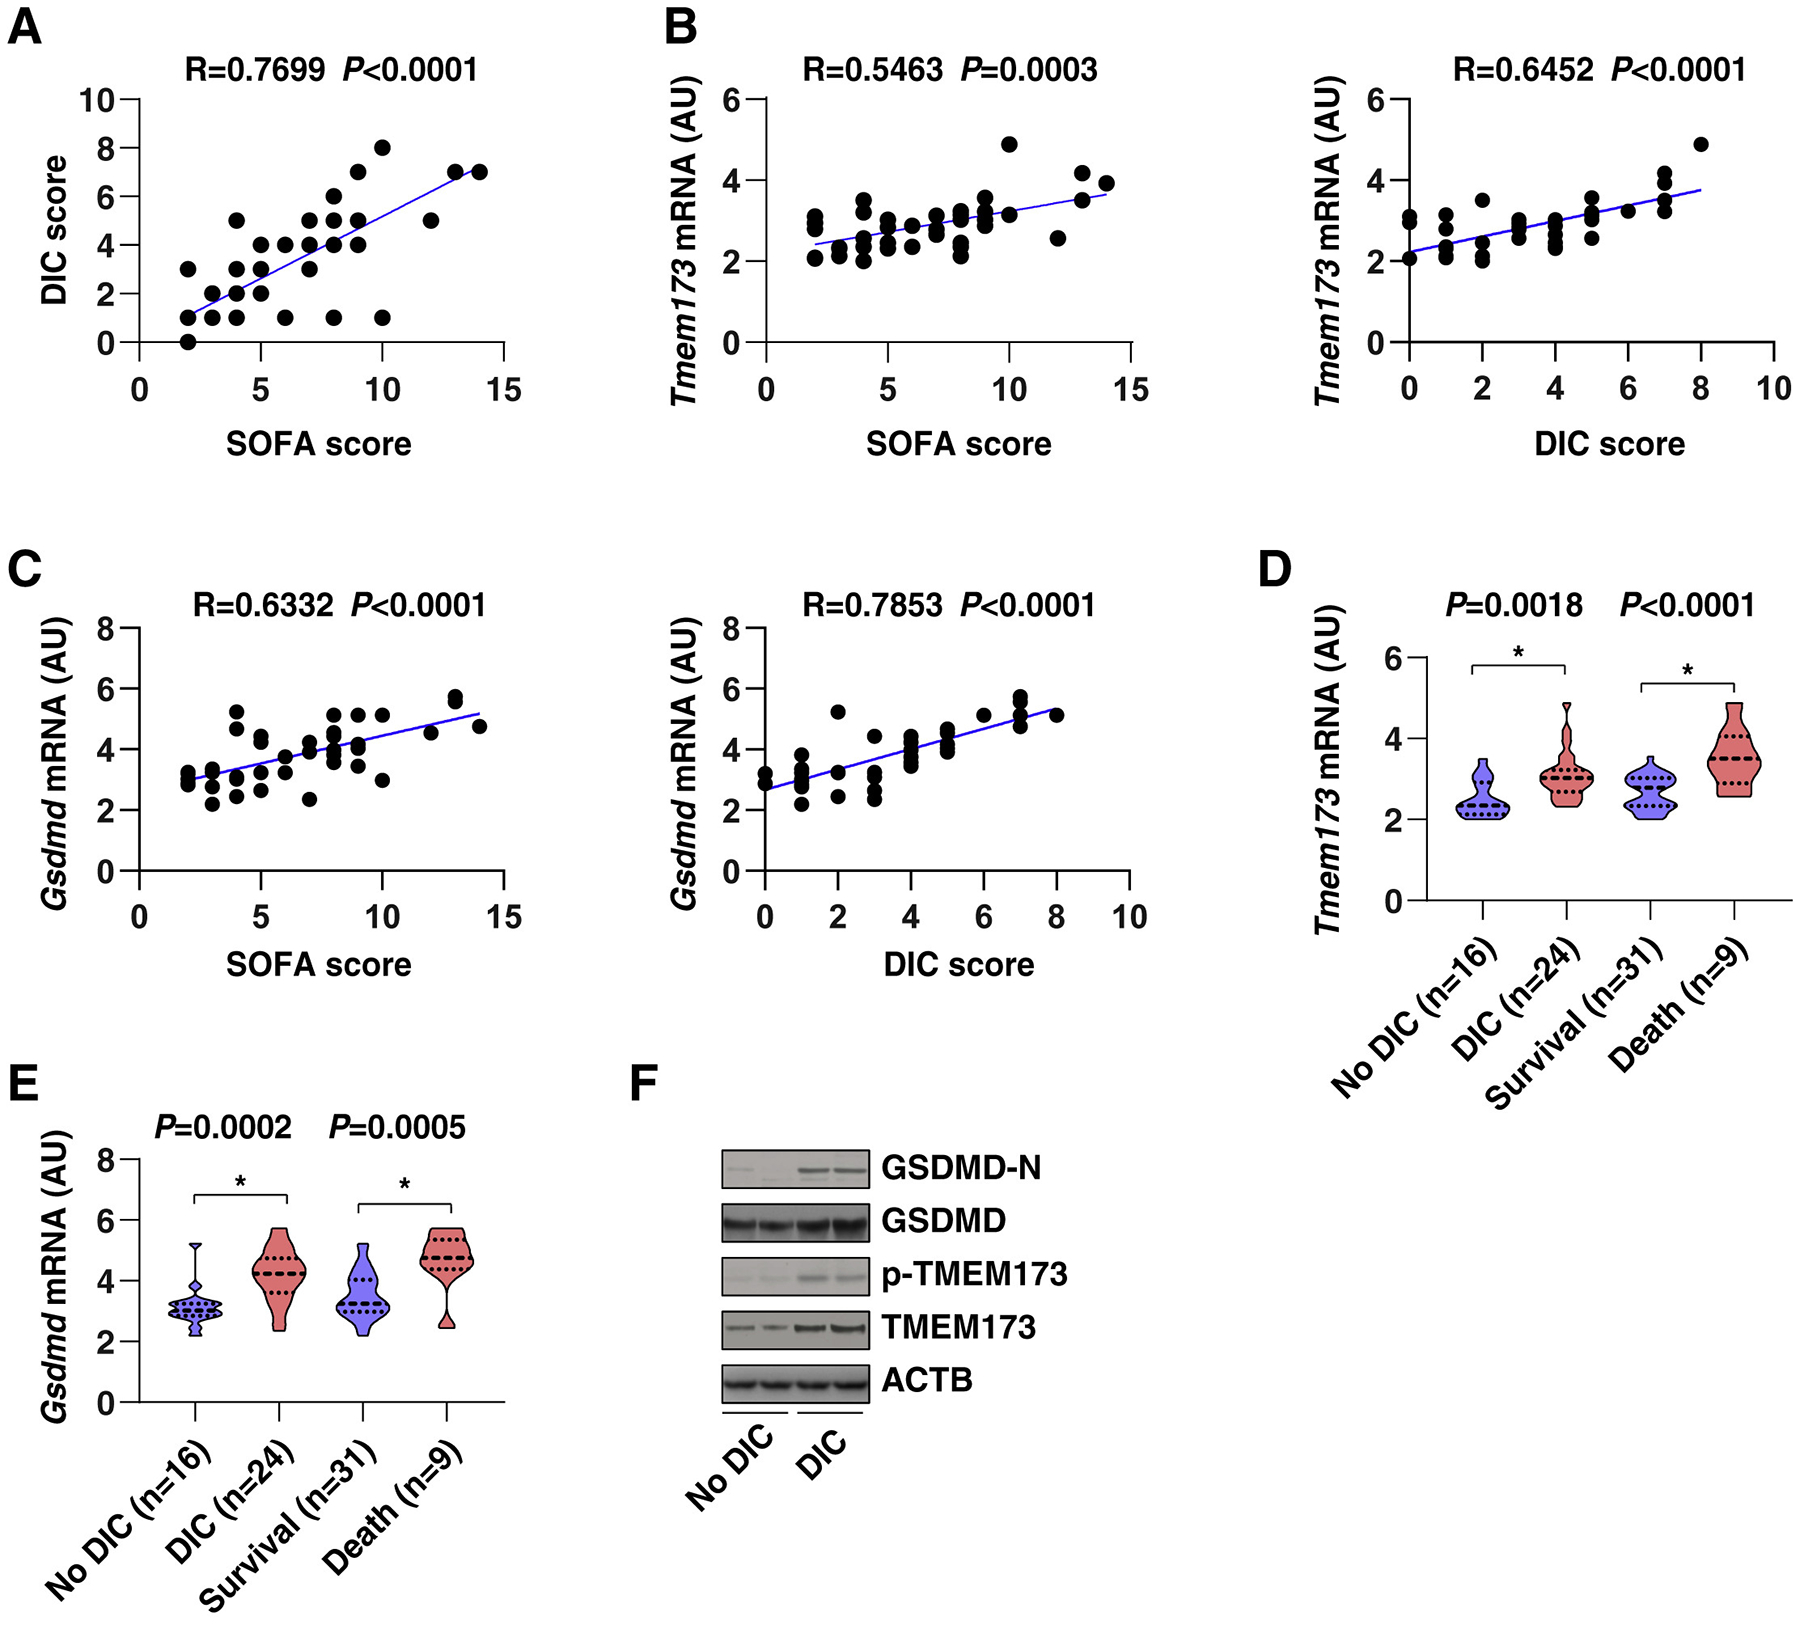
The discovery of TMEM173/STING-dependent innate immunity has recently provided guidance for the prevention and management of inflammatory disorders. Here, we show that myeloid TMEM173 occupies an essential role in regulating coagulation in bacterial infections through a mechanism independent of type I interferon response. Mechanistically, TMEM173 binding to ITPR1 controls calcium release from the endoplasmic reticulum in macrophages and monocytes. The TMEM173-dependent increase in cytosolic calcium drives Gasdermin D (GSDMD) cleavage and activation, which triggers the release of F3, the key initiator of blood coagulation. Genetic or pharmacological inhibition of the TMEM173-GSDMD-F3 pathway blocks systemic coagulation and improves animal survival in three models of sepsis (cecal ligation and puncture or bacteremia with Escherichia coli or Streptococcus pneumoniae infection). The upregulation of the TMEM173 pathway correlates with the severity of disseminated intravascular coagulation and mortality in patients with sepsis. Thus, TMEM173 is a key regulator of blood clotting during lethal bacterial infections.

Keywords: ER stress; GSDMD; STING; TMEM173; calcium; coagulation; inflammasome; pyroptosis; sepsis; tissue factor.


Conflict of interest statement

Declaration of interests The authors declare no conflicts of interest or financial interests.

Figures

Figure 1.
Figure 1.. Myeloid TMEM173 Is Required for CLP-Induced Systemic Coagulation and Septic Death.
(A) Survival of the indicated mice in CLP-induced sepsis (n = 10 mice per group; *p < 0.05, Kaplan-Meier survival analysis). (B–J) In parallel, the levels of blood markers of DIC ([B], platelet; [C], fibrinogen; [D], PT; [E], APTT; [F], D-dimer), tissue fibrin (G), plasma F3 (H), and markers of tissue injury ([I], BUN; [J], GPT) were assayed (n = 5 mice per group; *p < 0.05, t test). See also Figures S1 and S2.
Figure 2.
Figure 2.. TMEM173-Mediated Coagulation Activation Is Independent of Type I IFN Response.
(A) Survival of the indicated mice in CLP-induced sepsis (n = 10 mice per group). (B–H) The levels of blood markers of DIC ([B]–[F], as in Figures 1B–1F), tissue fibrin (G), and plasma F3 (H) were assayed at 48 h in indicated CLP-induced septic mice (n = 5 mice per group; *p < 0.05, t test). (I and J) Analysis of F3 (I) and IFNβ (J) release in THP1, BMDM (Figure S3), and HPBM (Figure S3) cells after treatment with IFNα (5 ng/mL), IFNβ (5 ng/mL), E. coli (25 MOI), or S. pneumoniae (25 MOI) infection for 24 h. Data are presented as mean ± SD. See also Figure S3.
Figure 3.
Figure 3.. TMEM173-Mediated Coagulation Activation Relies on ER Calcium Release.
(A) Heatmap of gene mRNA changes in THP1 cells after treatment with IFNα (5 ng/mL), IFNβ (5 ng/mL), E. coli (25 MOI), or S. pneumoniae (25 MOI) infection for 24 h. (B) Analysis of mRNA expression of the indicated gene in monocytes from CLP-induced (for 48 h) WT or Tmem173−/− mice (n = 3; *p < 0.05 versus WT group, t test). (C) Analysis of F3 levels in the supernatants of monocytes from CLP-induced (for 48 h) WT or Tmem173−/− mice (n = 3 mice per group; *p < 0.05 versus WT group, t test). (D) Analysis of F3 release in THP1 cells after E. coli (25 MOI) or S. pneumoniae (25 MOI) infection in the absence or presence of TUDCA (50 μM) or 4PBA (1 mM) for 24 h (n = 3 wells per group; *p < 0.05 versus E. coli or S. pneumoniae group, t test). (E) Analysis of intracellular Ca2+ in indicated THP1 cells after E. coli (25 MOI) or S. pneumoniae (25 MOI) infection for 24 h (n = 3 wells per group; *p < 0.05 versus WT group, t test). (F) Analysis of F3 release in indicated WT or Itpr1-knockdown THP1 cells after E. coli (25 MOI) or S. pneumoniae (25 MOI) infection in the absence or presence of BAPTA-AM (10 μM) for 24 h (n = 3 wells per group; *p < 0.05 versus control group, t test). (G) Analysis of TMEM173-ITPR1 interaction by IP in indicated THP1 cells after E. coli (25 MOI) or S. pneumoniae (25 MOI) infection for 24 h. (H and I) Analysis of intracellular Ca2+ (H) and F3 (I) release in indicated THP1 cells after thapsigargin (“TG,” 1 μM) and tunicamycin (“TM,” 1.0 μg/mL) treatment for 24 h (n = 3 wells per group; *p < 0.05 versus WT group, t test). (J) Administration of TUDCA (200 mg/kg) or 2-APB (20 mg/kg) prevented CLP-induced animal death in WT mice, but there was no further protective effect for TUDCA and 2-APG in Tmem173−/− mice (n = 10 mice per group; *p < 0.05, Kaplan-Meier survival analysis). (K–Q) In parallel, the levels of blood markers of DIC ([K]–[O], as in Figures 1B–1F and 2B–2F), tissue fibrin (P), and plasma F3 (Q) were assayed (n = 5 mice per group; *p < 0.05 versus vehicle group, t test). Data are presented as mean ± SD ([B], [C], [D], [E], [F], [H], and [I]). See also Figure S4.
Figure 4.
Figure 4.. ATP2A2-Dependent ER Calcium Uptake Limits TMEM173-Mediated F3 Release.
(A) Analysis of gene mRNA expression in indicated gene knockdown THP1 cells after E. coli (25 MOI) or S. pneumoniae (25 MOI) infection for 24 h (n = 3 wells per group; *p < 0.05 versus control siRNA group, t test). (B–D) Analysis of IFNβ release (B), F3 release (C), and cytosolic calcium (D) in indicated THP1 cells after E. coli (25 MOI) or S. pneumoniae (25 MOI) infection for 24 h (n = 3 wells per group; *p < 0.05 versus control siRNA group, t test). (E and F) Analysis of IFNβ (E) and F3 (F) release in indicated WT and TMEM173 mutation (V155M and N154S) THP1 cells after E. coli (25 MOI) or S. pneumoniae (25 MOI) infection for 24 h in the absence or presence of Atp2a2 overexpression or Tmem173 knockdown (n = 3 wells per group; *p < 0.05 versus control group, t test). Data are presented as mean ± SD. See also Figure S5.
Figure 5.
Figure 5.. TMEM173-Mediated GSDMD Cleavage Promotes F3 Release.
(A–C) Western blot analysis of GSDMD-N production in indicated knockout (A), knockdown (B), or mutated (C) THP1 cells after E. coli (25 MOI) or S. pneumoniae (25 MOI) infection for 24 h. (D and E) Analysis of GSDMD-N production (D) and F3 release (E) in indicated BMDM cells after E. coli (25 MOI) or S. pneumoniae (25 MOI) infection for 24 h in the absence or presence of the CASP8 inhibitor Z-IETD-FMK (20 μM) (n = 3 wells per group; *p < 0.05 versus control group, t test). (F) Cell lysates were analyzed by anti-FLAG antibody in Tmem173−/− THP1 cells after transfection indicated GSDMD mutants. (G) Analysis of F3 release in indicated THP1 cells after E. coli (25 MOI) or S. pneumoniae (25 MOI) infection for 24 h in the absence or presence of the PLC inhibitor U73122 (10 μM) (n = 3 wells per group; *p < 0.05, t test). (H) Western blot analysis of protein expression in THP1 cells after E. coli (25 MOI) or S. pneumoniae (25 MOI) infection for 24 h. (I) Western blot analysis of protein expression in indicated THP1 cells after E. coli (25 MOI) or S. pneumoniae (25 MOI) infection in the absence or presence of BAPTA-AM (10 μM) for 24 h. Data are presented as mean ± SD ([E] and [G]).
Figure 6.
Figure 6.. Inhibition of GSDMD and F3 Protects Mice against CLP-Induced Polymicrobial Sepsis.
(A) Survival of the indicated mice in CLP-induced sepsis with or without treatment of IgG, anti-F3 antibody (10 mg/kg), or U73122 (30 mg/kg) (n = 10 mice per group; *p < 0.05, Kaplan-Meier survival analysis). (B–J) In parallel, the levels of blood markers of DIC ([B]–[F], as in as in Figures 1B–1F, 2B–2F, and 3K–3O), tissue fibrin (G), plasma F3 (H), and markers of tissue injury ([I], BUN; [J], GPT) were assayed at 48 h (n = 5 mice per group; *p < 0.05, t test). See also Figure S6.
Figure 7.
Figure 7.. Association of the TMEM173-GSDMD Axis with the Severity of DIC in Patients with Sepsis.
(A–C) The correlation assay between indicated DIC score (A), SOFA score (A), and TMEM173 (B) and GSDMD (C) expression in PBMC from sepsis patients (Pearson rank correlation test). (D and E) The mRNA level of Tmem173 (D) and Gsdmd (E) in PBMC of indicated sepsis patients (data are presented in a violin plot, t test). (F) The protein levels of p-TMEM173, TMEM173, GSDMD-N, and GSDMD were upregulated in the DIC group in comparison with non-DIC groups. See also Table S1 and Figure S7.

Comment in

  • Taking the STING Out of Sepsis?
    Vandewalle J, Vanderhaeghen T, Beyaert R, Libert C. Vandewalle J, et al. Cell Host Microbe. 2020 Apr 8;27(4):491-493. doi: 10.1016/j.chom.2020.03.016. Cell Host Microbe. 2020. PMID: 32272071

References

    1. Ablasser A, and Chen ZJ (2019). cGAS in action: Expanding roles in immunity and inflammation. Science 363, 363. - PubMed
    1. Aglietti RA, Estevez A, Gupta A, Ramirez MG, Liu PS, Kayagaki N, Ciferri C, Dixit VM, and Dueber EC (2016). GsdmD p30 elicited by caspase-11 during pyroptosis forms pores in membranes. Proc. Natl. Acad. Sci. USA 113, 7858–7863. - PMC - PubMed
    1. Akira S, Uematsu S, and Takeuchi O (2006). Pathogen recognition and innate immunity. Cell 124, 783–801. - PubMed
    1. Banerjee I, Behl B, Mendonca M, Shrivastava G, Russo AJ, Menoret A, Ghosh A, Vella AT, Vanaja SK, Sarkar SN, et al. (2018). Gasdermin D Restrains Type I Interferon Response to Cytosolic DNA by Disrupting Ionic Homeostasis. Immunity 49, 413–426.e5, e415. - PMC - PubMed
    1. Barber GN (2015). STING: infection, inflammation and cancer. Nat. Rev. Immunol 15, 760–770. - PMC - PubMed

Publication types