. 2020 Apr 16;181(2):293-305.e11.
doi: 10.1016/j.cell.2020.02.026. Epub 2020 Mar 5.

Mycobacterium tuberculosis Sulfolipid-1 Activates Nociceptive Neurons and Induces Cough

Affiliations

Mycobacterium tuberculosis Sulfolipid-1 Activates Nociceptive Neurons and Induces Cough

Cody R Ruhl et al. Cell. .

Abstract

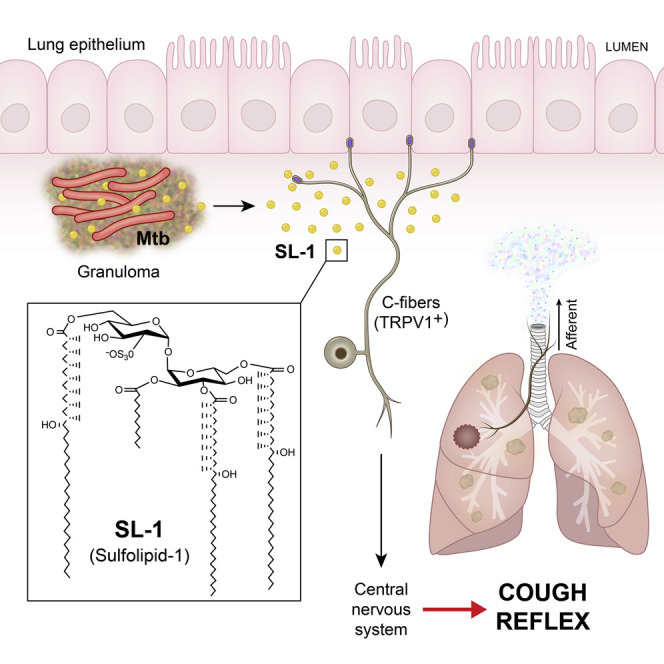
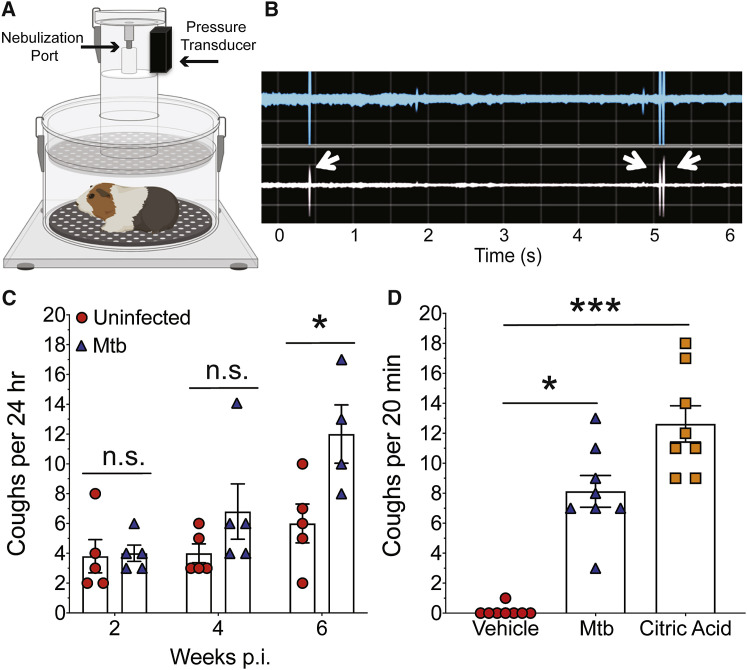
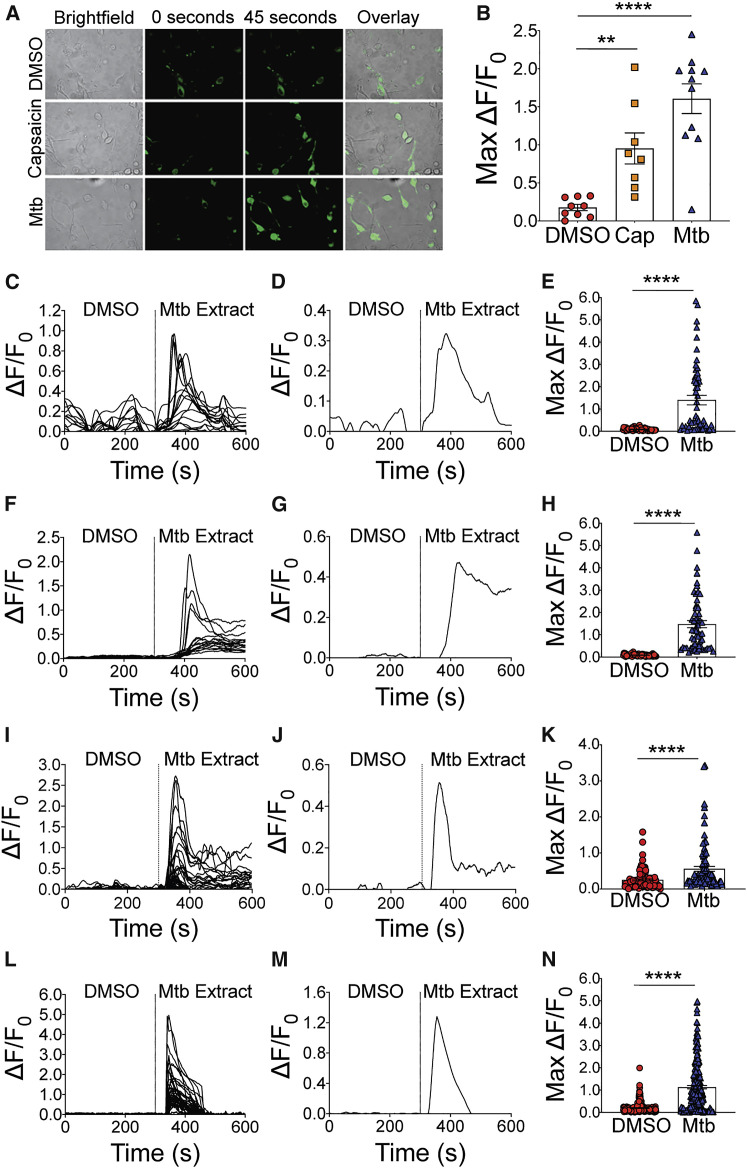
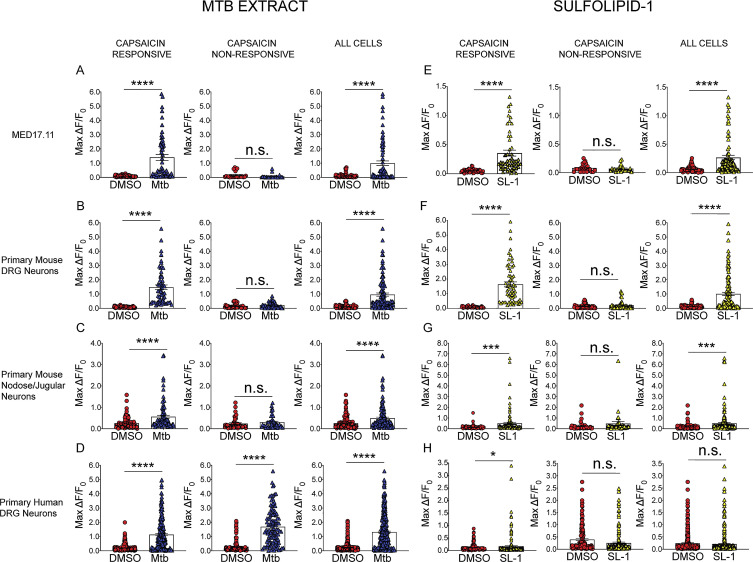
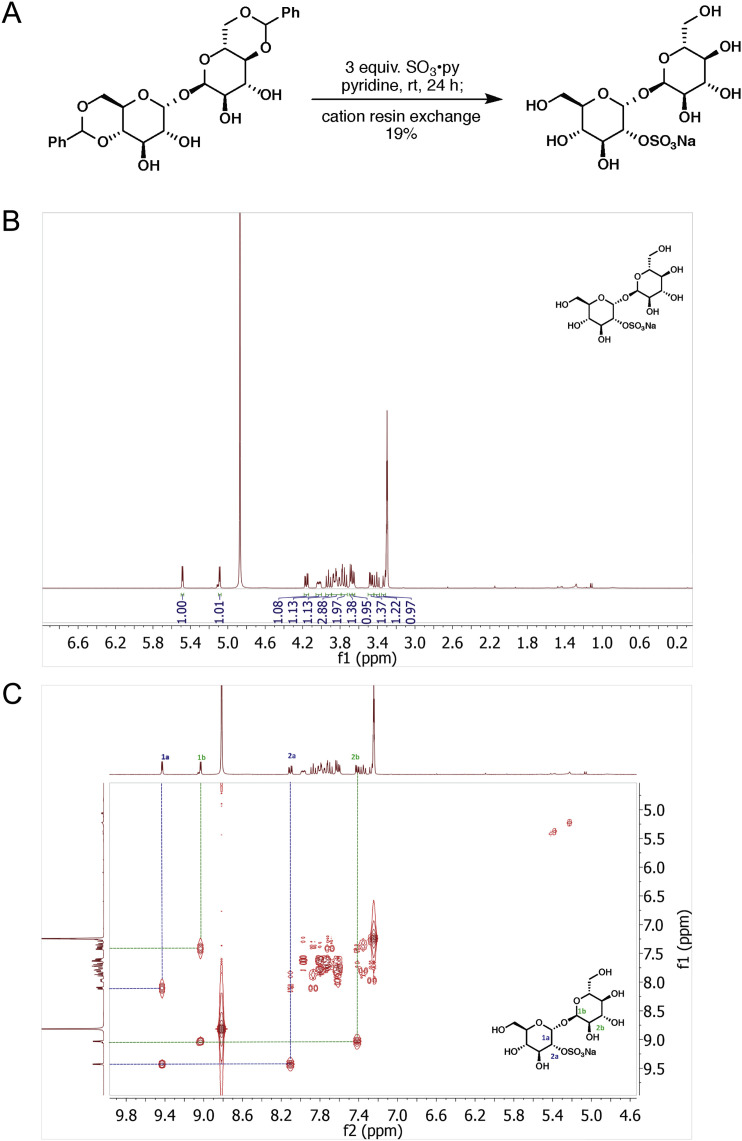
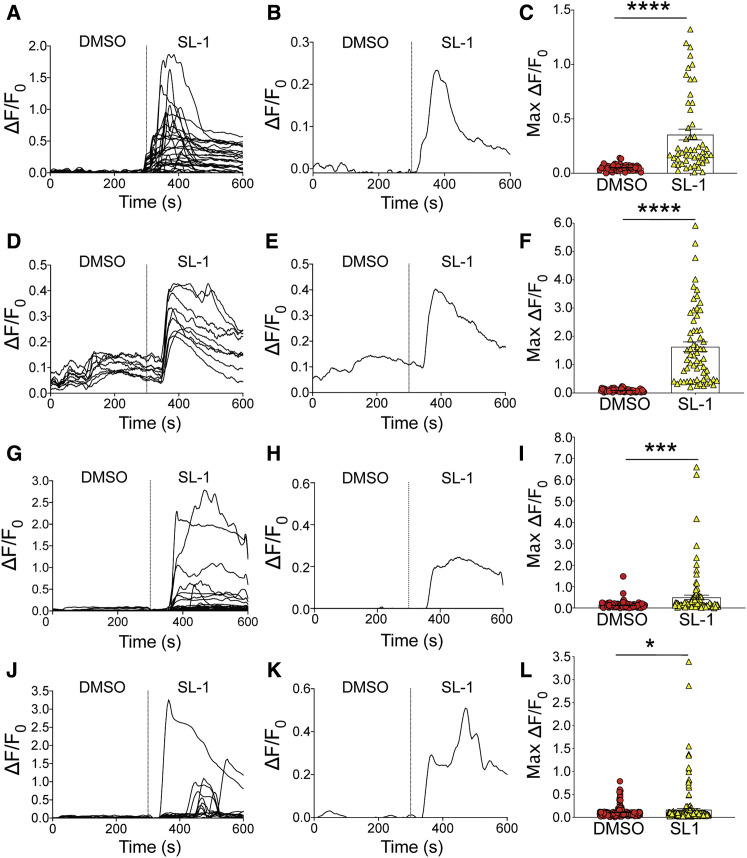
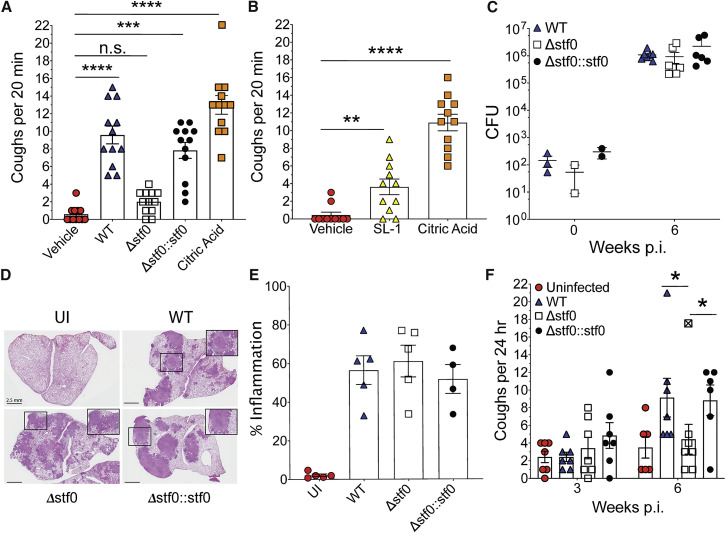
Pulmonary tuberculosis, a disease caused by Mycobacterium tuberculosis (Mtb), manifests with a persistent cough as both a primary symptom and mechanism of transmission. The cough reflex can be triggered by nociceptive neurons innervating the lungs, and some bacteria produce neuron-targeting molecules. However, how pulmonary Mtb infection causes cough remains undefined, and whether Mtb produces a neuron-activating, cough-inducing molecule is unknown. Here, we show that an Mtb organic extract activates nociceptive neurons in vitro and identify the Mtb glycolipid sulfolipid-1 (SL-1) as the nociceptive molecule. Mtb organic extracts from mutants lacking SL-1 synthesis cannot activate neurons in vitro or induce cough in a guinea pig model. Finally, Mtb-infected guinea pigs cough in a manner dependent on SL-1 synthesis. Thus, we demonstrate a heretofore unknown molecular mechanism for cough induction by a virulent human pathogen via its production of a complex lipid.

Keywords: cough; glycolipid; host-pathogen; mucosal immunology; mycobacteria; neuro-immune; nociceptor; sulfolipid; tuberculosis.


Conflict of interest statement

Declaration of Interests The authors declare no competing interests.

Figures

None
Graphical abstract
Figure 1
Figure 1
Mtb Infection and Mtb Extract Provoke Guinea Pig Coughs (A) Schematic of WBP chamber. (B) Representation of output reading from WBP including bias flow (blue) and bias flow slope (white). Arrows indicate coughs. (C) Cough quantification over a 24 h period every 2 weeks in uninfected and Mtb-infected guinea pigs. Error bars are SEM. p < 0.05 by Mann-Whitney U test. (D) Triggered coughs over a 20-min period in naive, unrestrained guinea pigs after treatment with vehicle (10% MeOh in PBS), WT Erdman Mtb extract (20 mg/mL), or citric acid (0.4 M). Each point represents an individual animal exposed to vehicle, Mtb extract, and citric acid on alternating days. Error bars are SEM. p < 0.05, ∗∗∗p < 0.001 by Friedman’s test.
Figure 2
Figure 2
Mtb Extract Increases Intracellular [Ca2+] in Nociceptive Neurons (A) Bright-field images and images of cells at 488 nm taken at 0 and 45 s after treatment of Fluo-4 loaded MED17.11 cells with DMSO (vehicle), Mtb extract (0.4 mg/mL final), or capsaicin (200 nM). (B) Quantification of the average max ΔF/F0 of capsaicin-positive nociceptive neurons after the treatment in A. Error bars are SEM. ∗∗p < 0.01, ∗∗∗∗p < 0.0001 by Kruskal-Wallace test. (C–N) Fura-2 (mouse) or Fluo-8AM (human) intracellular calcium assays (Ex 340/380, Em 510 nm) using MED17.11 cells (C–E), primary mouse DRG neurons (F–H), primary mouse nodose/jugular ganglia neurons (I–K), and primary human DRG neurons (L–N). Dashed lines indicate the time when the Mtb extract was added. For each cell type, the ΔF/F0 trace of representative neurons from a single dish (C, F, I, and L), the average ΔF/F0 trace for all neurons in a single dish (D, G, J, and M), and the maximum change in ΔF/F0 fluorescence ratio combining the data from individual neurons in 2 or more experiments (minimum 50 cells) (E, H, K, and N) are shown. For experiments with mouse (MED17.11, DRG, and nodose/jugular) neurons, representative experiments of at least 3 are shown. For human DRG neurons, shown is the combined data from two donors. Error bars in (E), (H), (K), and (N) are SEM. ∗∗∗∗p < 0.0001 by paired Student’s t test.
Figure S1
Figure S1
Mtb Extract and SL-1 Increases Intracellular [Ca2+] in Nociceptive Neuron, Related to Figures 2 and 4 (A-D). Fura-2 intracellular calcium assays (Ex 340/380, Em 510 nm) using MED17.11 cells (A), primary mouse DRG neurons (B), primary mouse nodose/jugular ganglia neurons (C) and primary human DRG neurons (D) exposed to Mtb extract. The maximum change in Fura-2 fluorescence ratio for capsaicin responsive (TRPV1+) neurons, capsaicin unresponsive (TRPV1-) and all cells in an experiment (minimum 50 cells) (A-C) are shown. (E-H) Fura-2 intracellular calcium assays using MED17.11 cells (E), primary mouse DRG neurons (F), primary mouse nodose/jugular ganglia neurons (G) and primary human DRG neurons (H) exposed to SL-1. For experiments with mouse (MED17.11, DRG and nodose/jugular) neurons, representative experiments of at least 3 are shown. For human DRG neurons, shown is the combined data from two donors. Error bars represent SEM. p < 0.05, ∗∗∗ p < 0.001, ∗∗∗∗p < 0.0001 by paired Student’s t test.
Figure S2
Figure S2
Effect of Extracellular Ca2+ on Intracellular [Ca2+] Responses of MED17.11 Neurons to Mtb Extract, Related to Figure 2 (A) Quantification of the average max ΔF/F0 MED17.11 cells loaded with Fura-2 and treated with vehicle (DMSO) or WT Mtb extract (0.4 mg/mL final). Cells were placed in HHBSS with (DMSO and Mtb extract) or without Ca2+ (DMSO NO Ca2+ and Mtb NO Ca2+). ∗∗∗p < 0.0005, ∗∗∗∗p < 0.0001 by Kruskal-Wallace test.
Figure S3
Figure S3
Intracellular Ca2+ Changes of MED17.11 Neurons in Response to Various Bacterial Organic Extracts, Related to Table 2 (A) Quantification of the average max ΔF/F0 MED17.11 cells loaded with Fluo-4 and treated with vehicle (DMSO) or organic extracts from a variety of bacterial species (0.4 mg/mL final). ∗∗∗p < 0.001, ∗∗∗∗p < 0.0001 by Kruskal-Wallace test.
Figure 3
Figure 3
Identification and Characterization of SL-1 as the Nociceptive-Neuron Activating Molecule (A) Max ΔF of Fluo-4 loaded MED17.11 cells after treatment with DMSO, Mtb Erdman organic extract (Mtb), sulfolipid-1 (SL-1), trehalose (Tre), trehalose monomycolate (TMM), and trehalose dimycolate (TDM). (B) Structures of SL-1, TMM, TDM, sulfatide, and galactocerebroside. (C) Dose response of SL-1 using Fura-2 loaded MED17.11 cells. EC50 calculated by nonlinear regression analysis. (D) Max ΔF/F0 of Fluo-4 loaded MED17.11 cells after treatment with DMSO, Mtb organic extract, SL-1, sulfatide (Sulf) or galactocerebroside (Gal). (E) Biosynthetic pathway of SL-1. Stf0 (trehalose 2-sulfotransferase; Rv0295c), PapA2 (polyketide synthase-associated protein A2; acyltransferase; Rv3820c), PapA1 (polyketide synthase-associated protein A1; acyltransferase; Rv3824c), Sap (sulfolipid-1-addressing protein; sulfolipid exporter; Rv3821), Chp1 (cutinase-like hydrolase protein; SL1278 acyltransferase; Rv3822), and MmpL8 (sulfolipid-1 exporter, Rv3823c). (F) Max ΔF/F0 of Fluo-4 loaded MED17.11 cells after treatment with wild-type Mtb, MtbΔstf0 (Δstf0), and MtbΔstf0::stf0 complemented (stf0::stf0) extracts. (G) Max ΔF/F0 of Fluo-4 loaded MED17.11 cells after treatment with Mtb extract, pure SL-1, MtbΔstf0 (Δstf0), or reactivation of MtbΔstf0 extract treated cells by the addition of SL-1. p < 0.05 by paired Student’s t test for the MtbΔstf0 versus restimulation experiment. (H) Max ΔF/F0 of Fluo-4 loaded MED17.11 cells after treatment with extracts from Mtb mutants in the SL-1 synthesis pathway. (I) Max ΔF/F0 of Fura-2 loaded MED17.11 cells after treatment with trehalose or synthetic T2S. Experiments are representative of at least 3 replicates. Error bars are SEM. ∗∗p < 0.01, ∗∗∗p < 0.005, ∗∗∗∗p < 0.0001 by Kruskal-Wallace (A, D, F, G, H) or Friedman’s test (I).
Figure S4
Figure S4
Mass Spectrometry of Mycobacterial Extracts, Related to Table 2 (A) Mass spectra from 2000 – 3000 m/z of pure SL-1 and mycobacterial extracts.
Figure S5
Figure S5
Mass Spectrometry of SL-1 Pathway Mutants, Related to Figure 3 (A) Mass spectra from 2000 – 3000 m/z of Mtb WT, MtbΔstf0 and Mtb Δstf0::stf0. (B) Mass spectra of Mtb mutants in the SL-1 synthesis pathway in the regions of 659-661 m/z (for SL659), 1277-1279 m/z (for SL1278) and 2000-3000 m/z (for SL-1). Stf0 (Trehalose 2-sulfotransferase; Rv0295c), PapA2 (Polyketide synthase-associated protein A2; acyltransferase; Rv3820c), PapA1 (Polyketide synthase-associated protein A1; acyltransferase; Rv3824c), Sap (Sulfolipid-1-addressing protein; sulfolipid exporter; Rv3821), Chp1 (Cutinase-like hydrolase protein; SL1278 acyltransferase; Rv3822), MmpL8 (Sulfolipid-1 exporter, Rv3823c). Arrows identify SL659 and SL1278.
Figure S6
Figure S6
Synthesis of Trehalose-2-Sulfate and Corresponding NMR Spectra, Related to Figure 3 (A) Synthesis of trehalose-2-sulfate from trehalose. (B) 1H NMR spectrum. (C) COSY NMR spectrum.
Figure 4
Figure 4
SL-1 Activates Both Mouse and Human DRGs In Vitro (A–C) Intracellular [Ca2+] measurement using MED17.11 cells loaded with Fura-2. (D–F) Intracellular [Ca2+] measurement using primary mouse DRG neurons loaded with Fura-2. (G–I) Intracellular [Ca2+] measurement using primary mouse nodose/jugular ganglia neurons loaded with Fura-2. (J–L) Intracellular [Ca2+] measurement using primary human DRG neurons loaded with Fura-8AM. Dashed lines represent the addition of SL-1. For each, the ΔF/F0 trace of representative neurons from a single dish (A, D, G, and J), the average ΔF/F0 trace for all neurons in a single dish (B, E, H, and K), and the maximum change in ΔF/F0 fluorescence ratio combining the data from individual neurons in 2 or more experiments (minimum 50 cells) (C, F, I, and L) are shown. For experiments with mouse neurons (MED17.11, DRG and nodose/jugular) representative experiments of at least 3 are shown. For human DRG neurons, shown is the combined data from two donors. Error bars in (C), (F), (I), and (L) are SEM. p < 0.05, ∗∗∗p < 0.001, ∗∗∗∗p < 0.0001 by Student’s t test.
Figure 5
Figure 5
Nebulized SL-1 and SL-1-Producing Mtb Strains Induce Cough (A) Cough quantification in naive, unrestrained guinea pigs following nebulization of vehicle control (PBS + 10% methanol), wild-type Mtb extract, MtbΔstf0 extract (Δstf0), MtbΔstf0::stf0stf0::stf0) extract, or citric acid (0.4 M). All extract concentrations were 20 mg/mL. (B) Cough quantification in naive, unrestrained guinea pigs following nebulization of vehicle control, citric acid (0.4 M), or purified SL-1 (250 μg/mL; estimated max headspace concentration of 12.5 μM). For experiments with Mtb extracts or pure SL-1, data are combined from 2 independent experiments. Error bars are SEM. ∗∗p < 0.01, ∗∗∗p < 0.005, ∗∗∗∗p < 0.0001 by Friedman’s test. (C) Inoculum and week 6 CFU from the right lung of guinea pigs infected with WT Mtb (WT), MtbΔstf0 (Δstf0), and MtbΔstf0::stf0stf0::stf0). (D) Histology of left lung from a representative guinea pig from each treatment group at 6 weeks plus an uninfected control (UI). Scale bar, 2.5 mm. Box magnification shows granulomas. (E) Quantification of (D) showing the percent inflammation from each treatment group (n = 4–5 animals per group). Error bars are SEM. (F) 24-h guinea pig cough quantification of the number of coughs per guinea pig at 3- and 6-weeks post infection from the wild-type Mtb (WT), MtbΔstf0 (Δstf0), and MtbΔstf0::stf0stf0::stf0) infected groups and 1 uninfected control group (UI). Each point represents an individual animal. Error bars are SEM. p < 0.05 by Kruskal-Wallis test. Data point identified by outlier analysis indicated with a.

Comment in

  • SLeuthing Tuberculous Cough.
    Behr MA, Edelstein PH, Ramakrishnan L. Behr MA, et al. Cell. 2020 Apr 16;181(2):230-232. doi: 10.1016/j.cell.2020.03.057. Cell. 2020. PMID: 32302566

References

    1. Abdullah H., Heaney L.G., Cosby S.L., McGarvey L.P. Rhinovirus upregulates transient receptor potential channels in a human neuronal cell line: implications for respiratory virus-induced cough reflex sensitivity. Thorax. 2014;69:46–54. - PubMed
    1. Abdulqawi R., Dockry R., Holt K., Layton G., McCarthy B.G., Ford A.P., Smith J.A. P2X3 receptor antagonist (AF-219) in refractory chronic cough: a randomised, double-blind, placebo-controlled phase 2 study. Lancet. 2015;385:1198–1205. - PubMed
    1. Baral P., Umans B.D., Li L., Wallrapp A., Bist M., Kirschbaum T., Wei Y., Zhou Y., Kuchroo V.K., Burkett P.R. Nociceptor sensory neurons suppress neutrophil and γδ T cell responses in bacterial lung infections and lethal pneumonia. Nat. Med. 2018;24:417–426. - PMC - PubMed
    1. Basaraba R.J., Dailey D.D., McFarland C.T., Shanley C.A., Smith E.E., McMurray D.N., Orme I.M. Lymphadenitis as a major element of disease in the guinea pig model of tuberculosis. Tuberculosis (Edinb.) 2006;86:386–394. - PubMed
    1. Bonvini S.J., Belvisi M.G. Cough and airway disease: The role of ion channels. Pulm. Pharmacol. Ther. 2017;47:21–28. - PubMed

Publication types

MeSH terms

LinkOut - more resources