. 2020 Mar 5;180(5):862-877.e22.
doi: 10.1016/j.cell.2020.02.016.

A Cardiovascular Disease-Linked Gut Microbial Metabolite Acts via Adrenergic Receptors

Affiliations

A Cardiovascular Disease-Linked Gut Microbial Metabolite Acts via Adrenergic Receptors

Ina Nemet et al. Cell. .

Abstract

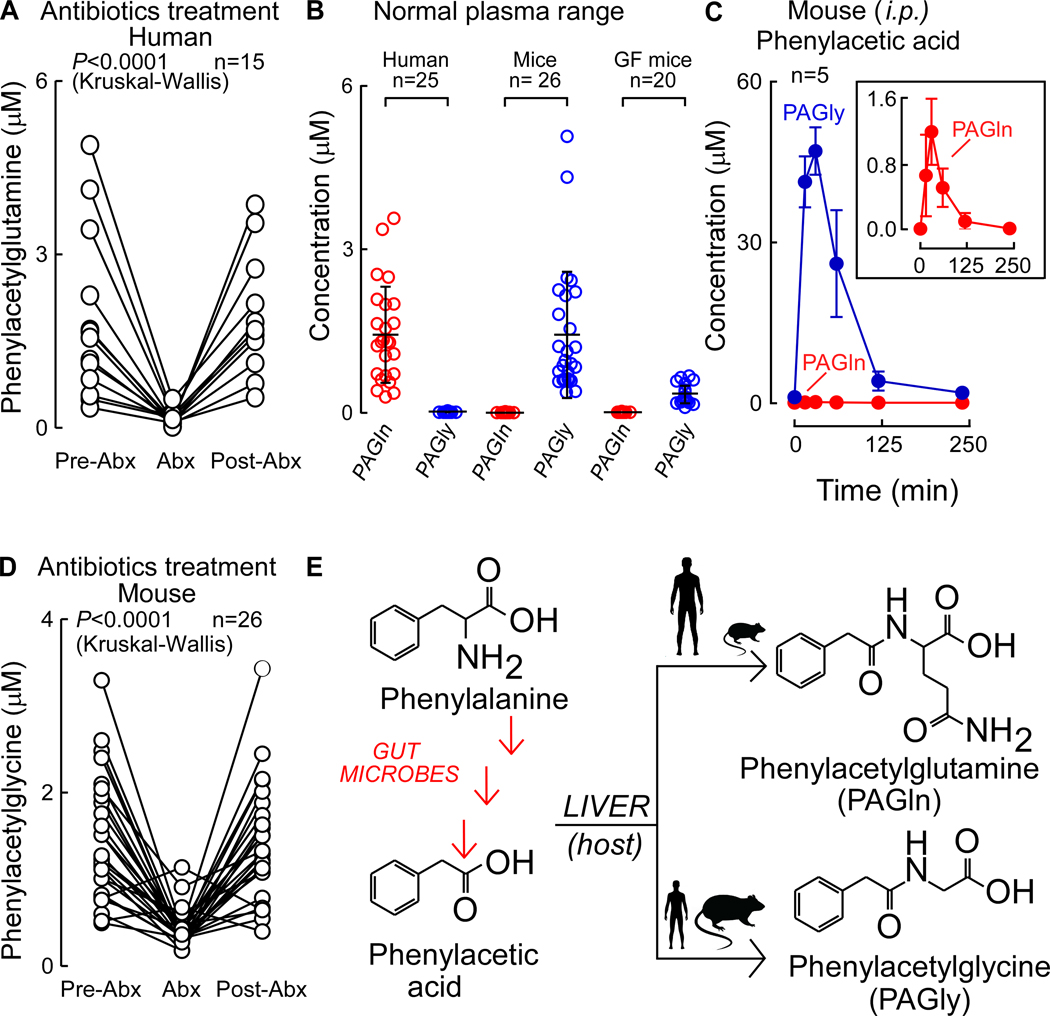
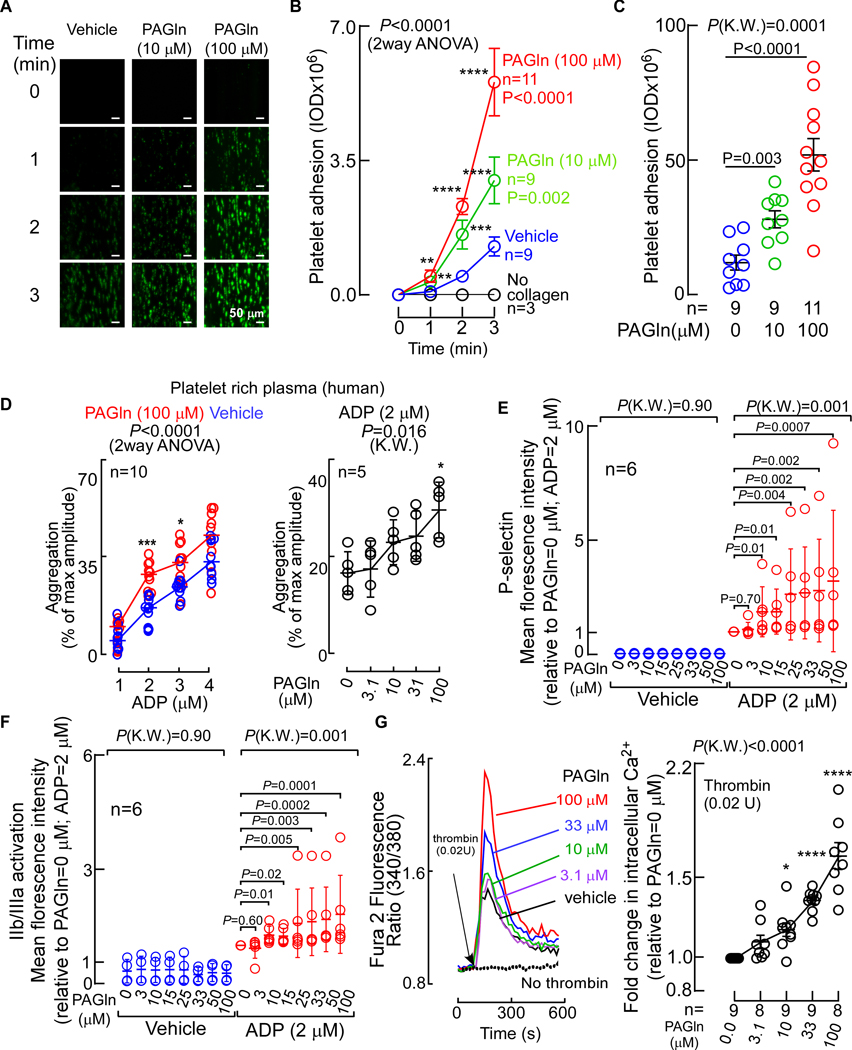
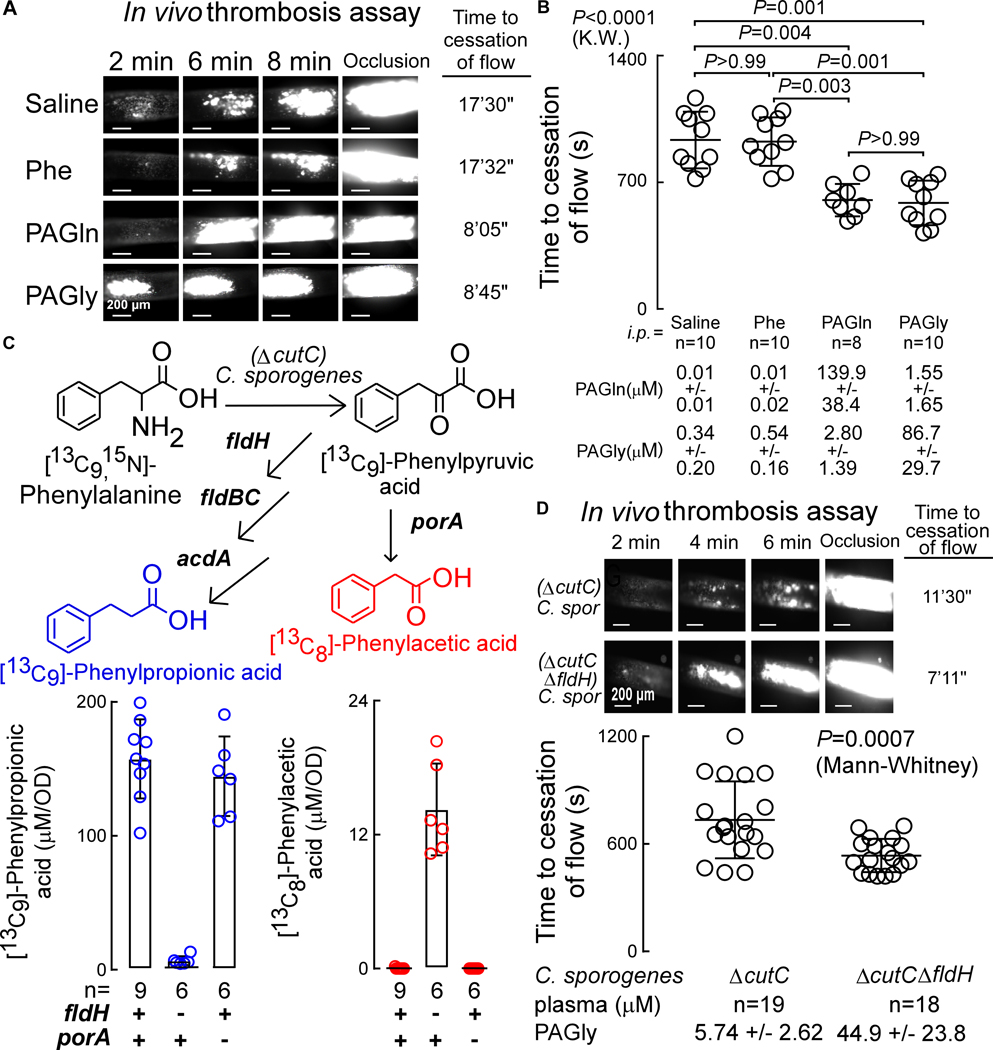
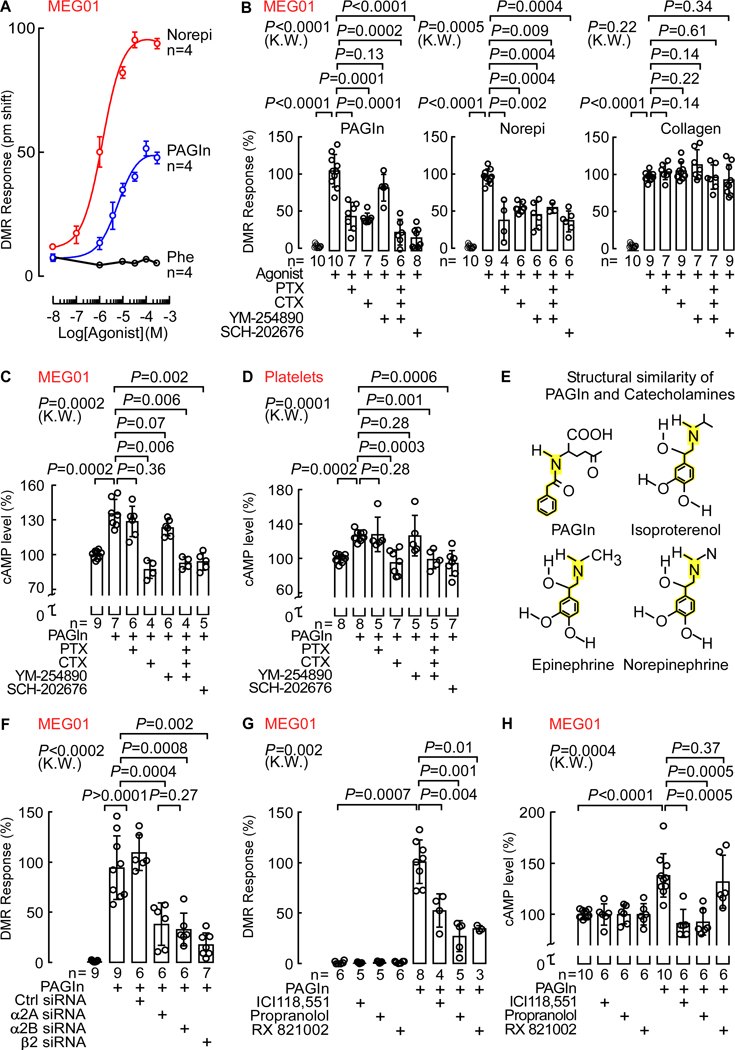
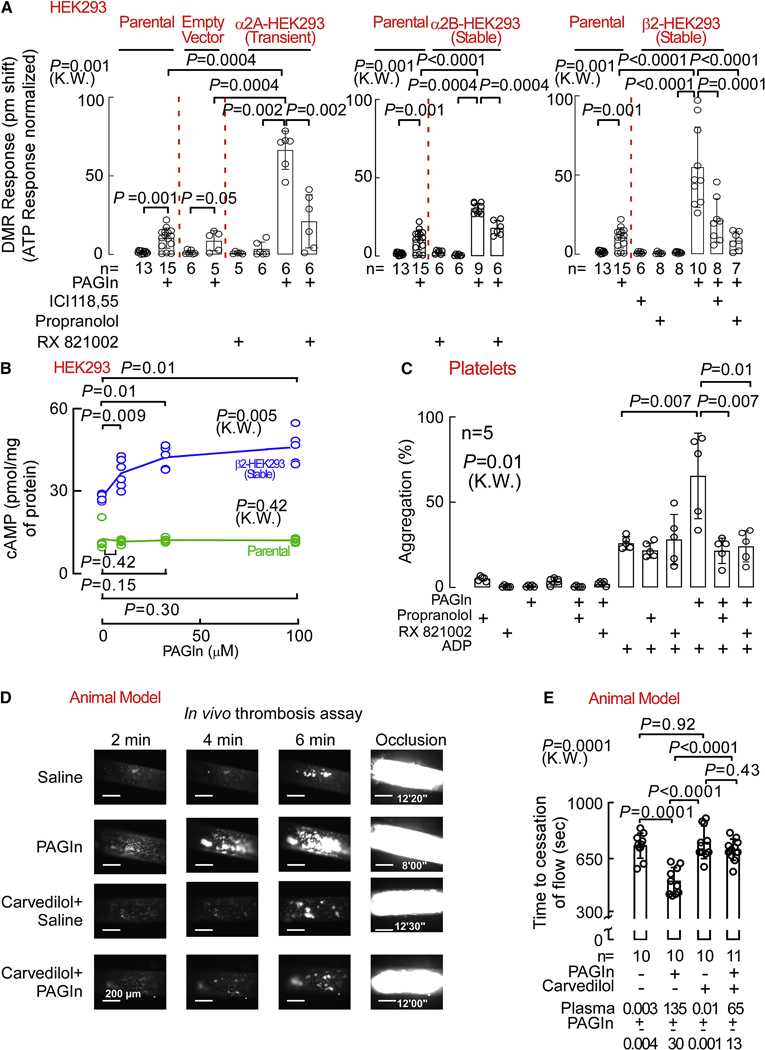
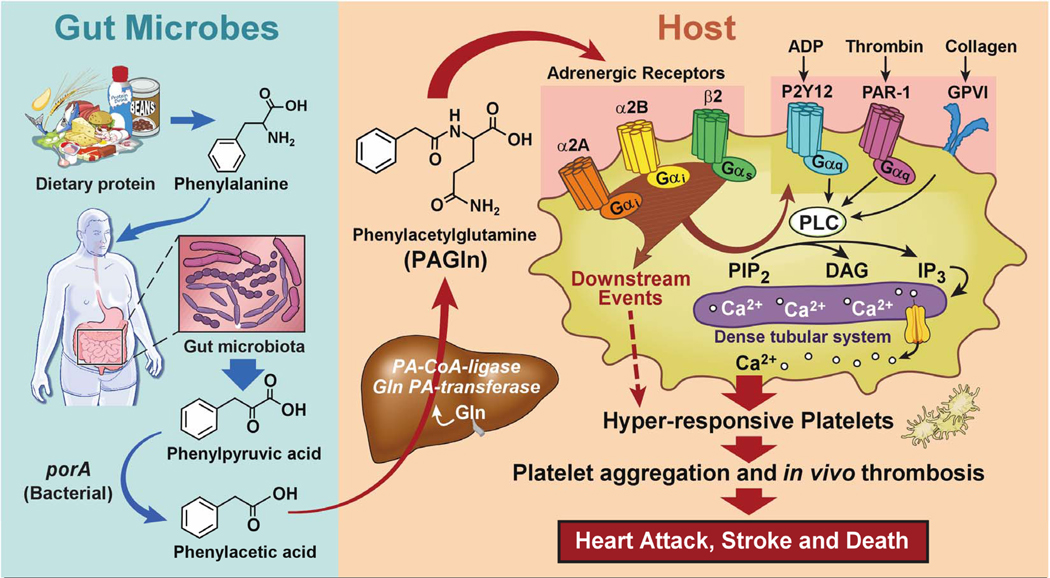
Using untargeted metabolomics (n = 1,162 subjects), the plasma metabolite (m/z = 265.1188) phenylacetylglutamine (PAGln) was discovered and then shown in an independent cohort (n = 4,000 subjects) to be associated with cardiovascular disease (CVD) and incident major adverse cardiovascular events (myocardial infarction, stroke, or death). A gut microbiota-derived metabolite, PAGln, was shown to enhance platelet activation-related phenotypes and thrombosis potential in whole blood, isolated platelets, and animal models of arterial injury. Functional and genetic engineering studies with human commensals, coupled with microbial colonization of germ-free mice, showed the microbial porA gene facilitates dietary phenylalanine conversion into phenylacetic acid, with subsequent host generation of PAGln and phenylacetylglycine (PAGly) fostering platelet responsiveness and thrombosis potential. Both gain- and loss-of-function studies employing genetic and pharmacological tools reveal PAGln mediates cellular events through G-protein coupled receptors, including α2A, α2B, and β2-adrenergic receptors. PAGln thus represents a new CVD-promoting gut microbiota-dependent metabolite that signals via adrenergic receptors.

Keywords: GPCR; adrenergic receptors; cardiovascular disease; gut microbe; metabolomics; thrombosis.


Conflict of interest statement

Declaration of Interests S.L.H. reports being named as co-inventor on pending and issued patents held by the Cleveland Clinic relating to cardiovascular diagnostics and therapeutics, being a paid consultant for P&G, having received research funds from P&G and Roche Diagnostics, and being eligible to receive royalty payments for inventions or discoveries related to cardiovascular diagnostics or therapeutics from Cleveland HeartLab, Quest Diagnostics, and P&G. The other authors have reported that they have no relationships relevant to the contents of this paper to disclose.

Figures

Fig. 1.
Fig. 1.. Untargeted Metabolomics Studies Discover a Metabolite with m/z of 265.1188 is Associated with Cardiovascular Disease Risk, Subsequently Identified as Phenylacetylglutamine (PAGln).
(A) Relative plasma levels of compound with m/z 265.1188 in sequential stable subjects undergoing elective diagnostic cardiac evaluation. Subjects (n=1,162) were divided into groups based on whether they were diabetic or experienced an incident major adverse cardiac event (MACE: MI, stroke or death) over the 3-year follow-up. In the box-whisker plot, the upper and lower boundaries of the box represent the 25th and 75th %iles, the median is marked by a horizontal line inside the box, whiskers represent 10 and 90% of relative measured values. (B) Kaplan-Meier estimates and the risk of MACE ranked by quartile of candidate analyte m/z 265.1188. (C) Comparison of high resolution CID mass spectra of the metabolite m/z 265.1188 in plasma (red) and synthetic PAGln standard (blue). (D) In the Validation Cohort (n=4,000) and indicated sub-cohorts Kaplan-Meier estimates and the risk of MACE according to PAGln quartile levels as measure by stable isotope dilution LC-MS/MS. (E) Risk of MACE by 3 years among all test subjects (n=4,000; left panel), diabetics (n=1,261; mid panel) and non-diabetics (n=2,739, right panel) according to PAGln quartile levels using a multivariable Cox proportional hazard model. Unadjusted hazard ratio (black) and adjusted model (age, gender, smoking, HDL, LDL, triglyceride level, systolic blood pressure and C-reactive protein level; red). The 5–95% confidence intervals (CI) are indicated by the line length. See also Figure S1. and Tables S1–S5.
Figure 2.
Figure 2.. PAGln Production In Vivo is a Microbiota-Dependent Process in Humans and Mice.
Fasting plasma levels of PAGln in subjects (n=15) (i) before oral treatment with a cocktail of poorly absorbable, broad spectrum antibiotics (Pre-Abx), (ii) after seven days of antibiotics regiment (Abx), and (iii) three weeks after discontinuation of antibiotics (Post-Abx). Kruskal-Wallis was used for the statistical analysis. (B) Fasting plasma levels of PAGln and PAGly (mean ± SD) in indicated numbers of healthy human subjects (n=25; left), conventionally raised mice (n=26; mid) and germ free (GF) mice (n=20; right). (C) Serial plasma levels of PAGln and PAGly after i.p. injection of phenylacetic acid (50 mg/kg; n=5) in mice. (D) Levels of PAGln in (n=11) male and (n=15) female mouse plasmas (i) before use of oral broad spectrum antibiotic cocktail (Pre-Abx), (ii) after five days of antibiotics treatment (Abx), and (iii) one week post antibiotics discontinuation (Post-Abx). Kruskal-Wallis test was used for the statistical analysis. (E) Schematic outlining metaorganismal production of PAGln and PAGly in humans and mice.
Figure 3.
Figure 3.. PAGln Enhances Platelet Responsiveness.
(A) Human platelet adhesion in whole blood to a microfluidic chip surface (± collagen coating) under physiological shear conditions ± PAGln. Representative images of platelet (green) adhesion at the indicated times; (scale bar, 50 μm). (B) Adherent platelet integrated optical density (IOD, area x intensity) from whole blood recorded from the indicated number of subjects. (C) Adherent platelet IOD at end point (i.e. after 3 min), in 5 high power fields (per treatment/per subject) along the length of the channel (n=9–11 as indicated). (D) ADP-stimulated platelet aggregometry responses (n=10) with fixed concentration of PAGln (100 μM, red) vs. normal saline (vehicle, blue) (left) or varying concentrations of PAGln (n=5) [fixed sub-maximal level of ADP (2 μM), right]. (E) ADP (vs. vehicle) induced changes in P-selectin surface expression in washed human platelets pre-incubated with the indicated concentrations of PAGln (n=6). (F) ADP (vs. vehicle) induced activation of platelet GP IIb/IIIa as assessed by PAC-1 antibody staining on washed human platelets pre-incubated with PAGln (n=6). (G) (Left) Representative fluorescent signal showing thrombin induced changes in intracellular calcium concentration [Ca2+] in Fura 2 filled washed human platelets incubated with PAGln. (Right) Fold-change (relative to PAGln=0 μM) in peak Fura 2 fluorescence following sub-maximal (0.02 U) thrombin stimulation at the indicated concentrations of PAGln in washed human platelets (n=8–9 as indicated). Data points represent the mean ± SEM (n=biological replicates). Significance was measured with non-parametric one- or two-way ANOVA with multiple comparisons (*P<0.05; **P<0.01; ***P<0.001; ****P<0.0001). See also Figure S2.
Figure 4.
Figure 4.. PAGln and PAGly Enhance In Vivo Thrombosis Potential.
(A) Representative pictographs of carotid artery thrombus formation at the indicated time points following FeCl3-induced carotid artery injury (scale bar, 200 μm). (B) Time to cessation of blood flow in mice from indicated groups (mean ± SEM; nonparametric Mann Whitney test for non-pairwise and Kruskal-Wallis test (K.W.) for multiple comparisons). (C) Synthesis of phenylacetic acid (PAA) and phenylpropionic acid (PPA) by C. sporogenes ΔcutC mutant with a disrupted gene for reductive metabolism of Phe (ΔfldH) were compared to (ΔcutC)C. sporogenes mutant with a disrupted gene for oxidative metabolism of Phe (ΔporA). C. sporogenes mutants were incubated with synthetic [13C9,15N]-Phe and production of [13C8]-PAA (red) and [13C9]-PPA (blue) were measured in the indicated number of replicates (n=6–9 as indicated) and results of each normalized by optical density (OD). (D) Time to cessation of blood flow in GF mice mono-colonized with (ΔcutC)C. sporogenes (n=19) or (ΔcutC,ΔfldH)C. sporogenes (n=18) mutants. Shown are (top) representative pictographs of carotid artery thrombus formation at the indicated time points following arterial injury (scale bar, 200 μm), and (bottom) time to cessation of blood flow in mice from the indicated groups. Bar and whiskers represent mean ± SEM time to cessation of blood flow within the indicated group. See also Figure S3.
Fig. 5.
Fig. 5.. PAGln Mediates Cellular Response Through G-Protein Coupled Receptor(s) and via ADRs.
(A) DMR dose response of PAGln, Norepi and Phe in MEG01 cells (n=4; max DMR responses after ligand addition). (B) DMR response of PAGln (100 μM; left), Norepi (10 μM; middle) and collagen (10 μg/mL; right) in MEG01 cells pre-treated with the G-protein modulators pertussis toxin (PTX; 100 ng/mL), cholera toxin (CTX; 1 μg/mL), YM-254890 (0.5 μM) or SCH-202676 (1 μM) (n=5–10 as indicated). (C-D) cAMP levels in (C) MEG01 cells and (D) washed human platelets pretreated with PAGln (100 μM; 5 min), in presence of PTX (100 ng/mL), CTX (1 μg/mL), YM-254890 (1 μM) or SCH-202676 (1 μM). cAMP levels were normalized to 100% immediately before addition of PAGln (n=4–9 as indicated). (E) Structure similarity between PAGln and catecholamines (ISO, Epinephrine and Norepi). (F) DMR response in MEG01 cells transfected with control scrambled siRNAs, and siRNAs against the α2A, α2B and β2 ADRs and analyzed under indicated conditions (n=6–9 as indicated). Maximum DMR response to PAGln was normalized to 100%. (G) PAGln (100 μM) DMR response quantified in MEG01 cells treated with 10 μM selective β2 antagonist ICI118,551, nonselective β-blocker propranolol or nonselective α2 antagonist RX821002 for 30 min (n=3–8 as indicated). The maximum DMR response to PAGln was normalized to 100%. (H) cAMP levels in MEG01 cells after PAGln (100 μM; 5 min) treatment in the presence of 10 μM ICI118,551, propranolol or RX821002 (n=6–10 as indicated). cAMP levels were normalized to 100% in all treatments immediately prior to addition of PAGln. Nonparametric-Mann Whitney test was used for non-pairwise comparisons and Kruskal-Wallis (K.W.) test for multiple comparisons. Data points represent the mean ± SEM (n=biological replicates). See also Figure S4–6.
Fig. 6.
Fig. 6.. PAGln Modulates Platelet Function and In Vivo Thrombosis Potential via ADRs.
(A) PAGln (100 μM) DMR response in parental HEK293, empty vector transfected HEK293, ADRA2A transfected HEK293 (left panel), α2B-HEK293 stably expressing (middle panel) and in β2-HEK293 stably expressing cells (right panel) after treating the cells with 10 μM ICI118,551, propranolol or RX821002 for 30 min (n=5–15 as indicated). (B) cAMP levels in parental HEK293 and in β2-HEK293 stably expressing cells after PAGln treatment for 10 min (n=4–6 as indicated). (C) ADP-stimulated platelet aggregometry responses in human PRPs (n=5) pre-incubated with the 10 μM propranolol, or RX821002 for 15 min prior to PAGln (100 μM) treatment for 30 min. (D) Representative pictographs of carotid artery thrombus formation at the indicated time points following FeCl3–induced carotid artery injury in mice i.p. injected with PAGln (or saline) and fed diet ± β-blocker carvedilol (1.5 g/kg; scale bar, 200 μm). (E) Quantification of occlusive thrombosis for the indicated numbers of mice in each group. Plasma PAGln levels are noted at the bottom. Nonparametric-Mann Whitney (M.W.) test was used for non-pairwise comparisons and Kruskal-Wallis (K.W.) test for multiple comparison. Data points represent the mean ± SEM (n=10–11 as indicated). See also Figure S7–8.
Figure 7.
Figure 7.. Gut-Microbial Metabolite PAGln Involvement in Enhancement of Platelet Thrombotic Potential via ADRs.

Comment in

References

    1. Action to Control Cardiovascular Risk in Diabetes Study, G., Gerstein HC, Miller ME, Byington RP, Goff DC Jr., Bigger JT, Buse JB, Cushman WC, Genuth S, Ismail-Beigi F, et al. (2008). Effects of intensive glucose lowering in type 2 diabetes. N Engl J Med 358, 2545–2559. - PMC - PubMed
    1. Amrani Y, and Bradding P (2017). beta2-Adrenoceptor Function in Asthma. Adv Immunol 136, 1–28. - PubMed
    1. Anfossi G, and Trovati M (1996). Role of catecholamines in platelet function: pathophysiological and clinical significance. Eur J Clin Invest 26, 353–370. - PubMed
    1. Aron-Wisnewsky J, and Clement K (2016). The gut microbiome, diet, and links to cardiometabolic and chronic disorders. Nat Rev Nephrol 12, 169–181. - PubMed
    1. Atwood BK, Lopez J, Wager-Miller J, Mackie K, and Straiker A (2011). Expression of G protein-coupled receptors and related proteins in HEK293, AtT20, BV2, and N18 cell lines as revealed by microarray analysis. BMC Genomics 12, 14. - PMC - PubMed

Publication types

MeSH terms