. 2020 May 7;26(5):766-781.e9.
doi: 10.1016/j.stem.2020.02.002. Epub 2020 Mar 5.

Sliced Human Cortical Organoids for Modeling Distinct Cortical Layer Formation

Affiliations

Sliced Human Cortical Organoids for Modeling Distinct Cortical Layer Formation

Xuyu Qian et al. Cell Stem Cell. .

Abstract

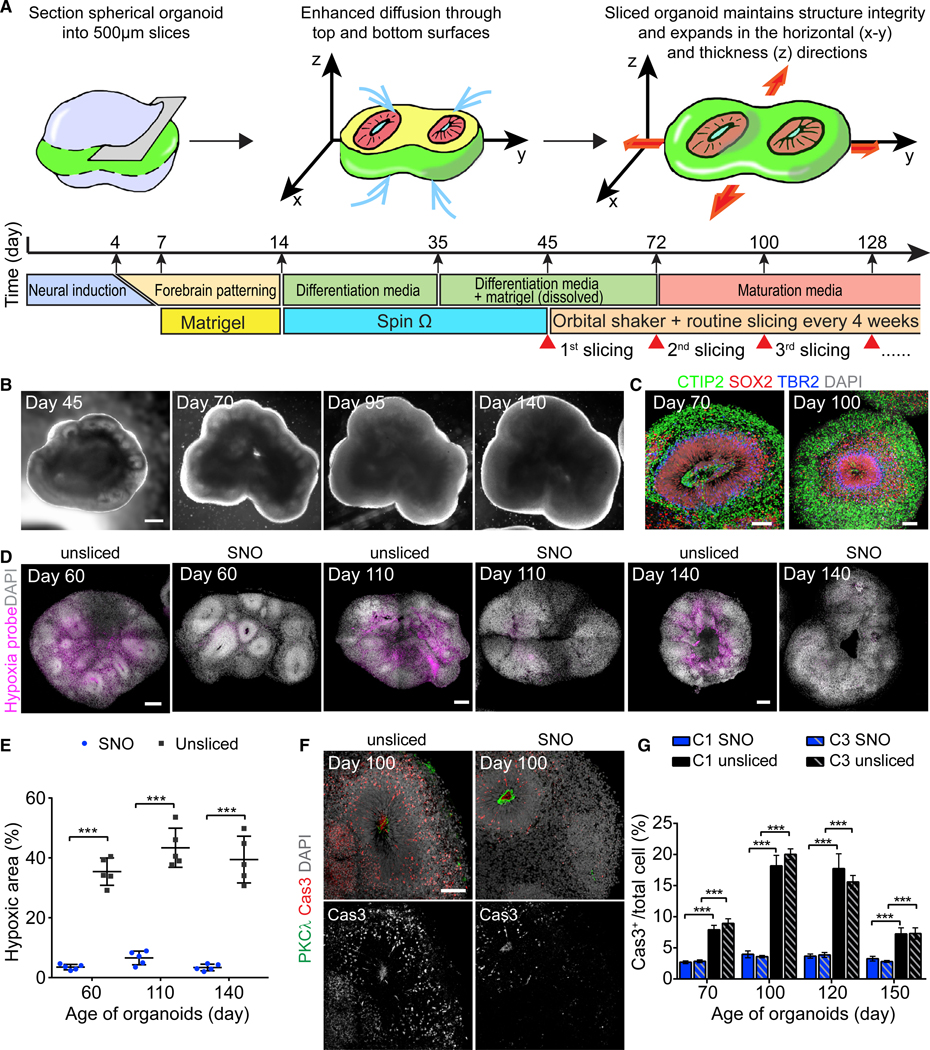
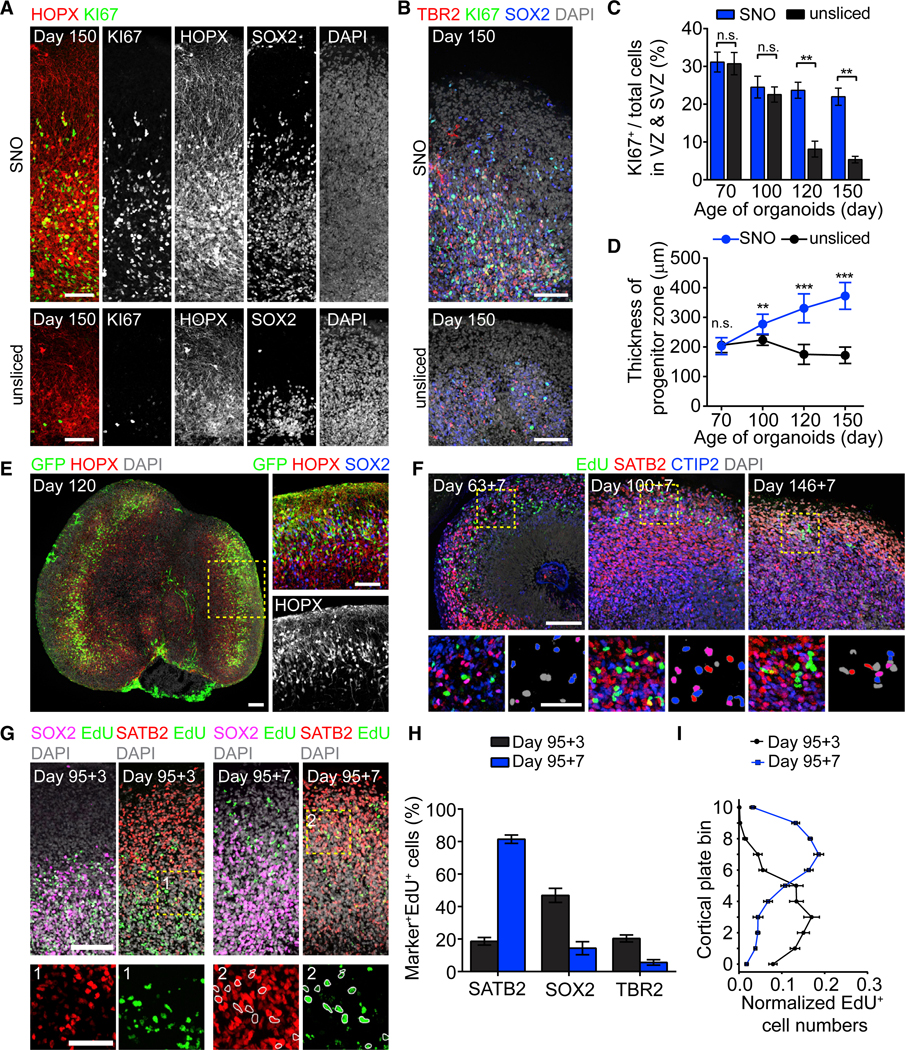
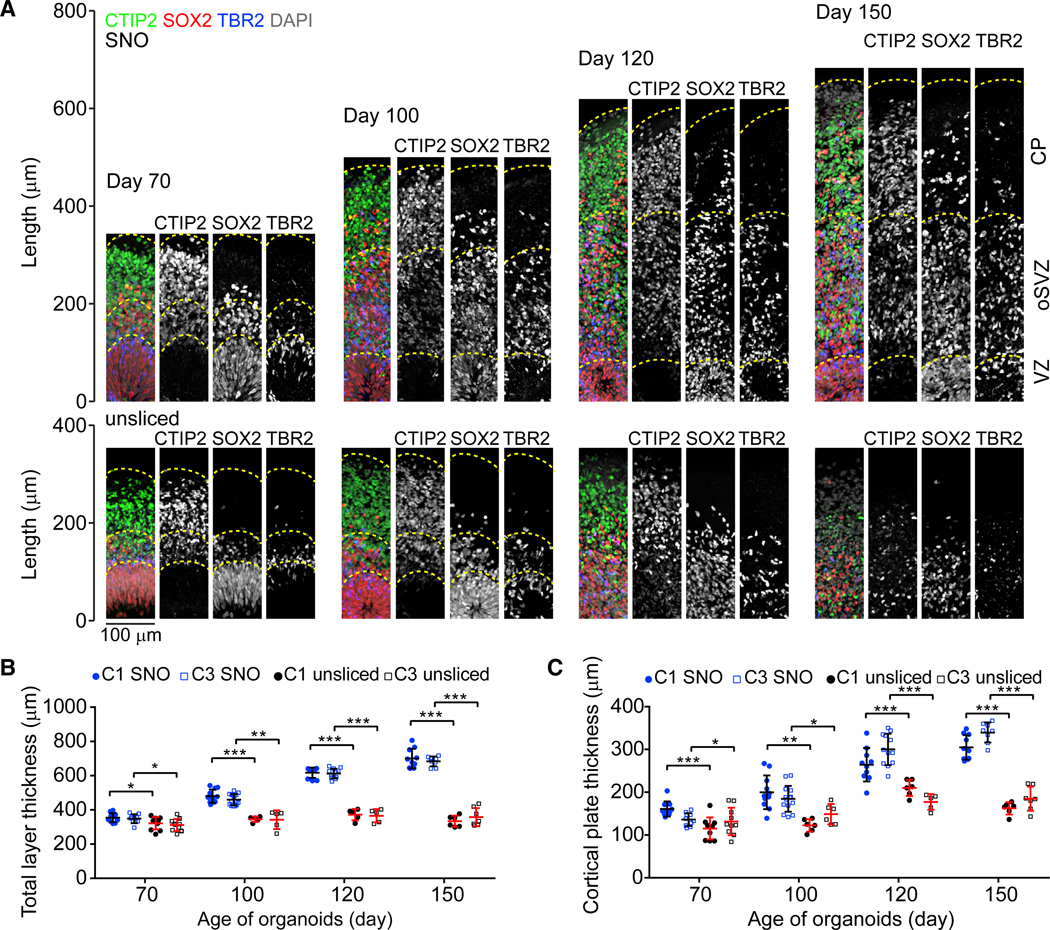
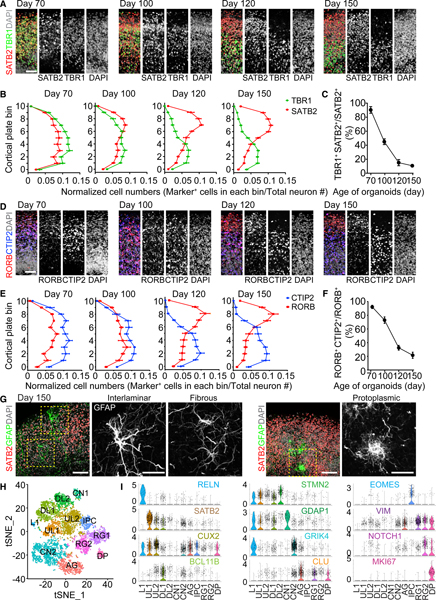
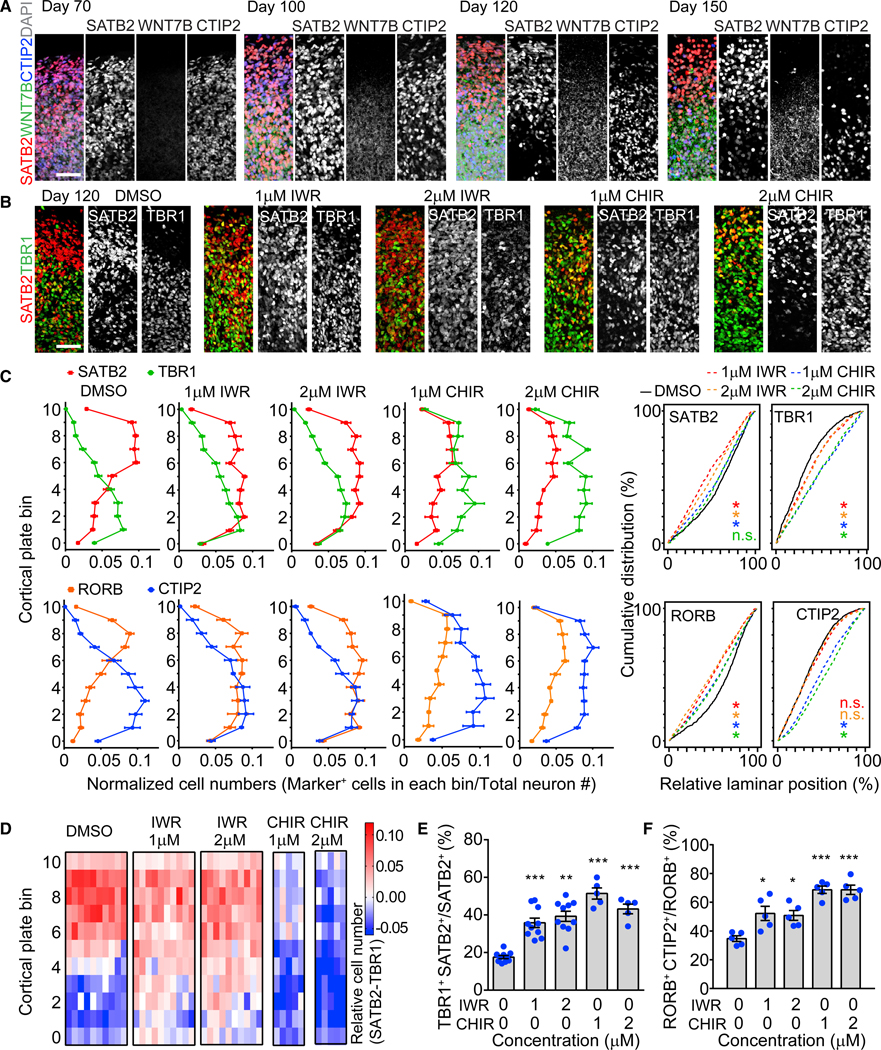
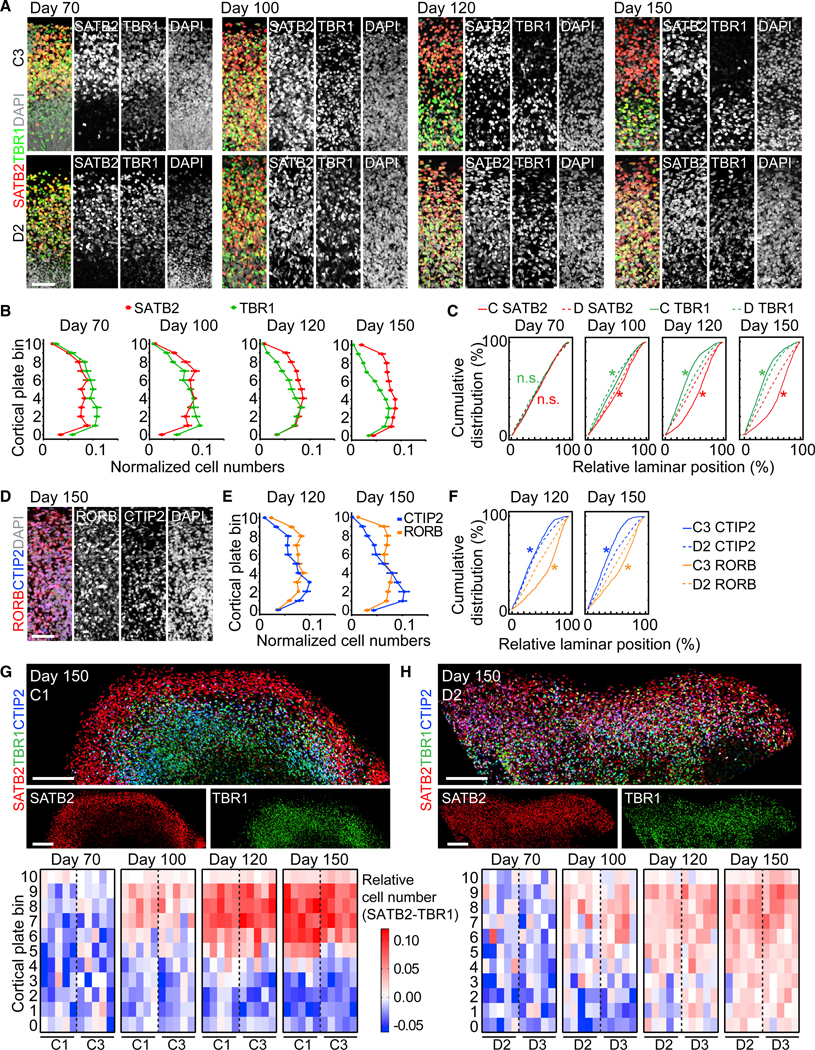
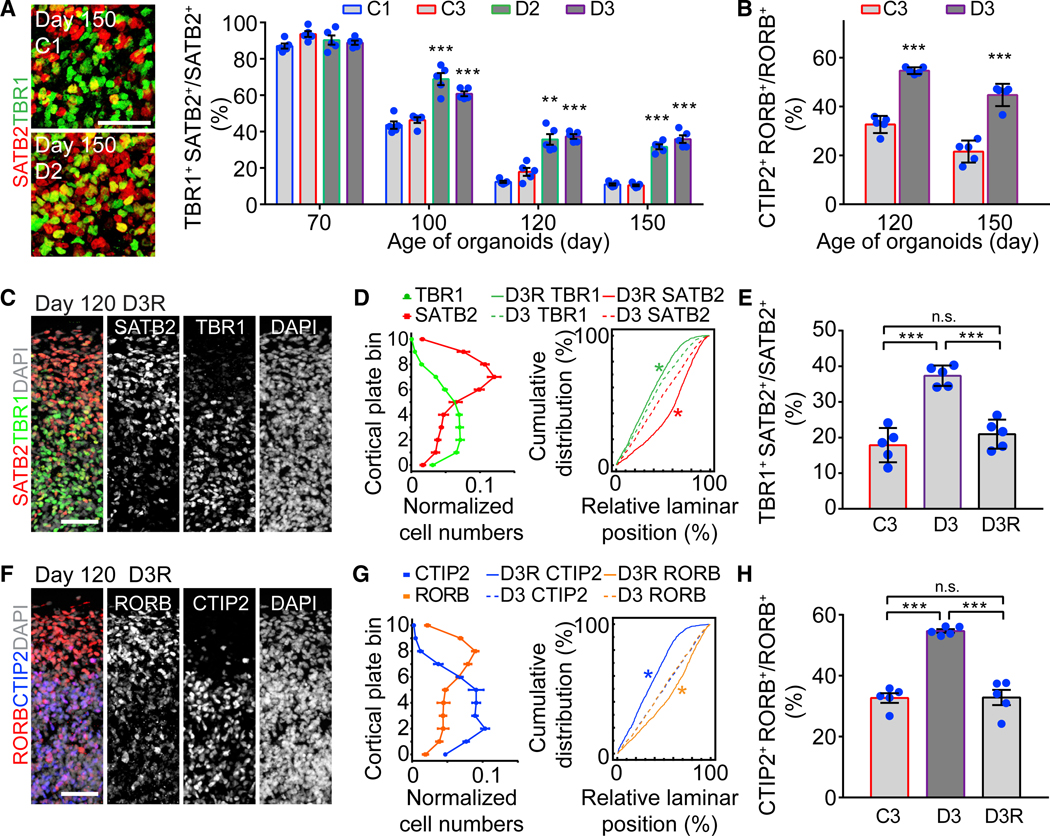
Human brain organoids provide unique platforms for modeling development and diseases by recapitulating the architecture of the embryonic brain. However, current organoid methods are limited by interior hypoxia and cell death due to insufficient surface diffusion, preventing generation of architecture resembling late developmental stages. Here, we report the sliced neocortical organoid (SNO) system, which bypasses the diffusion limit to prevent cell death over long-term cultures. This method leads to sustained neurogenesis and formation of an expanded cortical plate that establishes distinct upper and deep cortical layers for neurons and astrocytes, resembling the third trimester embryonic human neocortex. Using the SNO system, we further identify a critical role of WNT/β-catenin signaling in regulating human cortical neuron subtype fate specification, which is disrupted by a psychiatric-disorder-associated genetic mutation in patient induced pluripotent stem cell (iPSC)-derived SNOs. These results demonstrate the utility of SNOs for investigating previously inaccessible human-specific, late-stage cortical development and disease-relevant mechanisms.

Keywords: Brain organoid; DISC1; WNT; cerebral cortex; forebrain organoid; human iPSC; lamination; neurodevelopment; neuron fate specification; schizophrenia.


Conflict of interest statement

Declaration of Interests The authors declare no competing interests.

Figures

Figure 1.
Figure 1.. Sliced Neocortical Organoid (SNO) Method Resolves Interior Hypoxia and Reduces Cell Death
(A) Schematic illustration for the SNO protocol and culture timeline. (B) Sample bright-field images of the same SNO captured at days 45, 70, 95, and 140. Day 0 refers to when iPSC colonies were detached to form embryoid bodies. Scale bar, 500 μm. (C) Sample immunostaining confocal images of SNOs showing maintenance of cortical structures after slicing. Scale bars, 100 μm. (D and E) Hypoxia assay comparing unsliced organoids and SNOs using a pimonidazole-based hypoxia probe. Shown are sample tiling confocal images with hypoxic cells in purple and DAPI in white (D). Scale bars, 200 μm. Images at the same date are shown at the same scale. Shown in (E) is the quantification of the percentage of the hypoxic area over the total organoid area. Bar values represent mean ± SD (n = 5 organoids; ***p < 0.0005; Student’s t test). (F and G) Analyses of apoptotic cell death in SNOs and unsliced organoids. Shown are sample immunostaining confocal images for apoptosis marker cleaved caspase-3 (Cas3) and adherens junction marker PKCλ (F) and quantification of apoptotic cell death within the non-necrotic region (G). Scale bar, 100 μm. Values represent mean ± SEM (n ≥ 10 and 5 organoids for SNOs and unsliced organoids, respectively; ***p < 0.0005; Student’s t test). See also Figure S1.
Figure 2.
Figure 2.. Sustained Neurogenesis and Radial Migration of Newborn Neurons in SNOs
(A and B) Sample tiling confocal images showing the oSVZ of day 150 SNOs (top panel) and unsliced organoids (bottom panel), immunostaining for proliferation marker KI67, general NPC marker SOX2, oRG marker HOPX (A), and IPC marker TBR2 (B). Scale bars, 100 μm. (C) Quantification of the percentage of KI67+ cells in progenitor zones (VZ and oSVZ). Values represent mean ± SEM (n = 5 organoids; n.s.: p > 0.05; **p < 0.005; Student’s t test). (D) Quantification of the size of proliferative progenitor zones. Values represent mean ± SD (n ≥ 20 and 10 organoids for SNOs and unsliced organoids from 2 iPSC lines, respectively; n.s.: p > 0.05; **p < 0.005; ***p < 0.0005; Student’s t test). (E) Preferential infection of oRG-like cells with unipolar morphologies and basal processes contacting the pial surface by GFP-expressing adenovirus. Shown on the left is a sample tiling confocal image for a day 120 SNO with two large oSVZ structures. The inset shows a magnified view with a 90-degree counter-clockwise rotation. Scale bars, 100 μm. (F) Sample confocal images for 7-day EdU pulse-chase experiments, with newborn neurons labeled double positive for EdU and neuron marker CTIP2 or SATB2 in SNOs. Scale bars, 100 μm and 50 μm (insets). EdU+ nuclei in the insets (bottom right panels) are pseudo-colored to indicate their marker expression: gray (SATB2/CTIP2); red (SATB2+/CTIP2); blue (SATB2/CTIP2+); and purple (SATB2+/CTIP2+). (G) Sample confocal images for 3- and 7-day EdU pulse-chase experiments, showing that EdU+ cells migrated from the SOX2-enriched progenitor zones into the SATB2-enriched CP from day 98 to day 102. The insets (box 1 and 2) show magnified views with EdU and SATB2 double-positive nuclei circled in white. Scale bars, 100 μm and 50 μm (insets). (H) Quantification of the percentage of EdU+ cells expressing SATB2, SOX2, or TBR2 at 3 and 7 days post-EdU labeling on day 95. Values represent mean ± SEM (n = 5 SNOs for each marker). (I) Quantifications of the localization of EdU+ cells at 3 and 7 days post-EdU labeling. The cortical structure from apical surface to basal surface is evenly divided into bins 0–10. Shown are curves representing the normalized abundance within each bin, calculated as [no. of EdU+ cells in a bin/no. of total EdU+ cells]. Values represent mean ± SEM (n = 10 SNOs). Same samples as in (H) are shown. See also Figure S2.
Figure 3.
Figure 3.. Layer Expansion in SNOs over Long-Term Cultures
(A) Sample tiling confocal images of cortical structures in SNOs (top panel) and unsliced organoids (bottom panel), for immunostaining of CTIP2, SOX2, and TBR2. Dashed lines mark the pial surfaces and the boundaries of the VZ, oSVZ, and CP. The laminar structures in days 120 and 150 unsliced organoids are disorganized and thus not marked by dashed lines. Scale bar, 100 μm. (B and C) Quantifications of the total thickness (B) and CP thickness (C). Values represent mean ± SD (n ≥ 10 and 5 organoids for SNOs and unsliced organoids for each iPSC line, respectively; *p < 0.05; **p < 0.005; ***p < 0.0005; Student’s t test).
Figure 4.
Figure 4.. Establishment of Separated Upper and Deep Cortical Layers and Specification of Cortical Neuron Subtypes
(A) Sample immunostaining confocal images of the CP of SNOs for SATB2 and TBR1. Shown are cropped 100 × 300 μm columns in the CP, and the pial surface is at the top. Scale bar, 50 μm. (B) Quantifications of the distribution of SATB2+ and TBR1+ neurons in the CP. The CP is evenly divided into 11 bins; bins 0–10 follow the apical-to-basal direction. Shown are curves representing the normalized abundance within each bin, calculated as [no. of marker+ cells in a bin/no. of total neurons]. Values represent mean ± SEM (n = 10 SNOs from C1 and C3 iPSC lines). (C) Quantification of the ratio of co-expression of TBR1 and SATB2 over SATB2+ cells in the CP. Same samples as in (B) are shown. Values represent mean ± SD. (D) Sample immunostaining confocal images of the CP for RORB and CTIP2. Scale bar, 50 μm. (E) Quantification of the distribution of RORB+ and CTIP2+ neurons in the CP. Shown is similar to (B). Values represent mean ± SEM (n = 10 SNOs from C1 and C3 iPSC lines). (F) Quantification of the ratio of co-expression of RORB and CTIP2 over RORB+ cells in the CP. Same samples as in (E) are shown. Values represent mean ± SD. (G) Sample confocal images of morphologically distinct GFAP+ astrocytes in day 150 SNOs. Note localization of an interlaminar astrocyte cell body near the pial surface and protoplasmic astrocytes in the SATB2+ upper layer. Scale bars, 100 μm. (H) Graph-based clustering of cells from day 150 SNOs by single-nucleus RNA-seq (n = 6,888 nuclei). AG, astrocyte/glia; CN, cortical neuron; DL, deep layer; DPs, dividing progenitors; IPCs, intermediate progenitor cells; L1, layer I; RG, radial glia; UL, upper layer. Cell population identities were determined by gene enrichment analysis using cell type and layer-specific marker gene sets obtained from the Allen Brain Atlas (Hawrylycz et al., 2012) and published datasets of single-cell RNA-seq of the developing and adult human cerebral cortex (Fan et al., 2018; Lake et al., 2016; Nowakowski et al., 2017; Pollen et al., 2015). (I) Expression of selected cluster-specific marker genes used for cell type classification. Shown are violin plots overlaid on scatterplots, where the proportion of cells expressing a given gene is the highest. The color coding for the gene names indicates the cluster in which the gene is most enriched. See also Figures S2, S3, S4, and S5, Video S1, and Table S1.
Figure 5.
Figure 5.. Regulation of Cortical Neuron Fate Specification by WNT/β-Catenin Signaling
(A) Sample confocal images of the CP of SNOs with immunostaining for SATB2, CTIP2, and WNT7B. Scale bar, 100 μm. (B) Sample confocal images showing the effects of β-catenin antagonist (IWR-1-endo [IWR]) and agonist (CHIR9902 [CHIR]) on expression patterns of SATB2 and TBR1 in the CP. Drugs were added into culture medium at the indicated concentrations from day 100 to day 120, and the analysis was performed at day 120. Scale bar, 50 μm. (C) Quantifications of the distribution of SATB2+, TBR1+ and RORB+, CTIP2+ neurons in the CP of SNOs treated with drugs. Shown on the left are curves representing the normalized abundance within each bin, similar to Figure 4B. Values represent mean ± SEM (n = 10 SNOs from C1 and C3 iPSC lines for DMSO and IWR treatments; n = 5 SNOs for CHIR treatments). Shown on the right are cumulative distribution curves of marker-positive neurons. Kolmogorov-Smirnov tests were performed for the drug-treated conditions, indicated by the corresponding color, against the DMSO condition (n.s.: p > 0.05; *p < 0.05). (D) Heatmap plots for the differential abundance between SATB2+ and TBR1+ nuclei in the CP of drug-treated SNOs. Each row represents one of the 11 CP bins, and each column represents an individual SNO analyzed. The differences between the abundance of SATB2+ nuclei and TBR1+ nuclei within each bin are calculated as ([normalized SATB2+ nuclei no.] – [normalized TBR1+ nuclei no.]). Red on the heatmap indicates a positive value (more SATB2), and blue indicates a negative value (more TBR1). Same samples as in (C) are shown. (E and F) Quantifications of the ratio of co-expression between TBR1 and SATB2 over SATB2+ cells (E) and between RORB and CTIP2 over RORB+ cells (F) in drug-treated SNOs. Same samples as in (C) are shown. Values represent mean ± SEM (*p < 0.05; **p < 0.005; ***p < 0.0005; Student’s t test). See also Figure S6.
Figure 6.
Figure 6.. Aberrant Laminar Expression Patterns of Cortical Layers in mDISC1 SNOs
(A) Sample confocal images of the CP of control (C3; top panel) and mDISC1 (D2; bottom panel) SNOs for SATB2 and TBR1. Scale bar, 50 μm. (B and C) Quantifications of the distribution of SATB2+ and TBR1+ neurons in mDISC1 SNOs, to be compared with Figure 4B. Values represent mean ± SEM (n = 10 SNOs from D2 and D3 iPSC lines). Also shown in (C) are cumulative distribution curves of marker-positive neurons at each time point. Kolmogorov-Smirnov tests were performed between control (C) and mDISC1 (D) SNOs for SATB2 (red) and TBR1 (green; *p < 0.05; n.s.: p > 0.05). Same samples as in (B) and Figure 4B are shown. (D–F) Disorganized laminar distribution of RORB and CTIP2 in mDISC1 SNOs. Shown in (D) are 100 × 300 μm columns from sample confocal images at day 150. Scale bar, 50 μm. Shown in (E) are quantifications of marker distribution at days 120 and 150, to be compared with Figure 4E. Values represent mean ± SEM (n = 5 SNOs). Shown in (F) are cumulative distribution curves of marker-positive neurons at each time point. Kolmogorov-Smirnov tests were performed between control (C) and mDISC1 (D) SNOs for RORB (orange) and CTIP2 (blue) (n.s.: p > 0.05; *p < 0.05). Same samples as in (E) and Figure 4E are shown. (G and H) Comparison of cortical layers between the control and mDISC1 SNOs. Shown at the top panel are sample tiling confocal images of the CP in day 150 SNOs. Scale bars, 200 μm. Shown at the bottom panel are heatmap plots for the differential abundance between SATB2+ and TBR1+ in control (G) and in mDISC1 (H) SNOs, similar to Figure 5D. Same samples as in (B) and Figure 4 B are shown. See also Figure S7.
Figure 7.
Figure 7.. Cortical Neuron Fate Specification Deficits Caused by the DISC1 Mutation
(A) Elevated co-expression between SATB2 and TBR1 in mDISC1 SNOs. Shown on the left are sample confocal images at the boundary between upper and deep layers with double-positive cells marked in yellow. Scale bar, 50 μm. Shown on the right is the quantification of the ratio of SATB2 and TBR1 co-expressing cells over SATB2+ neurons. Same sample as in Figure 6B is shown. Values represent mean ± SEM (***p < 0.0005; Student’s t test). (B) Elevated co-expression ratio between RORB and CTIP2 in mDISC1 SNOs. Same sample as in Figure 6E is shown. Values represent mean ± SEM (***p < 0.0005; Student’s t test). (C and D) Restored layer-specific expression patterns of SATB2 and TBR1 in day 120 SNOs derived from the isogenic D3R iPSC line, in which the DISC1 mutation was corrected. Shown in (C) are 100 × 300 μm columns from sample confocal image. Scale bar, 50 μm. Shown in (D) (left) is the quantification for marker distribution in the CP. Shown is similar to Figure 4B. Values represent mean ± SEM (n = 5 SNOs). Shown in (D) (right) are cumulative distribution curves. Kolmogorov-Smirnov test was performed between D3R and D3 SNOs for SATB2 (red) and TBR1 (green; *p < 0.05). (E) Restored ratio of co-expression between SATB2 and TBR1 to a normal level in SNOs derived from the isogenic D3R iPSC line. Same samples as in (D) are shown. Values represent mean ± SD (***p < 0.0005; Student’s t test). (F and G) Restored layer-specific expression patterns of RORB and CTIP2 in day 120 SNOs derived from the isogenic D3R iPSC line. Shown in (F) are 100 × 300 μm columns from sample confocal images. Scale bar, 50 μm. Shown in (G) (left) is the quantification for marker distribution in the CP. Values represent mean ± SEM (n = 5 SNOs). Shown in (G) (right) are cumulative distribution curves. Kolmogorov-Smirnov test was performed between D3R and D3 SNOs for RORB (orange) and CTIP2 (blue; *p < 0.05). (H) Restored ratio of co-expression between RORB and CTIP2 to the normal level in D3R SNOs. Same samples as in (G) are shown. Values represent mean ± SD (***p < 0.0005; Student’s t test).

References

    1. Abu-Khalil A, Fu L, Grove EA, Zecevic N, and Geschwind DH (2004). Wnt genes define distinct boundaries in the developing human brain: implications for human forebrain patterning. J. Comp. Neurol. 474, 276–288. - PubMed
    1. Alsiö JM, Tarchini B, Cayouette M, and Livesey FJ (2013). Ikaros promotes early-born neuronal fates in the cerebral cortex. Proc. Natl. Acad. Sci. USA 110, E716–E725. - PMC - PubMed
    1. Amiri A, Coppola G, Scuderi S, Wu F, Roychowdhury T, Liu F, Pochareddy S, Shin Y, Safi A, Song L, et al.; PsychENCODE Consortium (2018). Transcriptome and epigenome landscape of human cortical development modeled in organoids. Science 362, eaat6720. - PMC - PubMed
    1. Bardy C, van den Hurk M, Eames T, Marchand C, Hernandez RV, Kellogg M, Gorris M, Galet B, Palomares V, Brown J, et al. (2015). Neuronal medium that supports basic synaptic functions and activity of human neurons in vitro. Proc. Natl. Acad. Sci. USA 112, E2725–E2734. - PMC - PubMed
    1. Bershteyn M, Nowakowski TJ, Pollen AA, Di Lullo E, Nene A, Wynshaw-Boris A, and Kriegstein AR (2017). Human iPSC-derived cerebral organoids model cellular features of lissencephaly and reveal prolonged mitosis of outer radial glia. Cell Stem Cell 20, 435–449.e4. - PMC - PubMed

Publication types