Review
. 2020 Jun:328:113272.
doi: 10.1016/j.expneurol.2020.113272. Epub 2020 Mar 3.

Biology of the human blood-nerve barrier in health and disease

Affiliations
Review

Biology of the human blood-nerve barrier in health and disease

Eroboghene E Ubogu. Exp Neurol. 2020 Jun.

Abstract

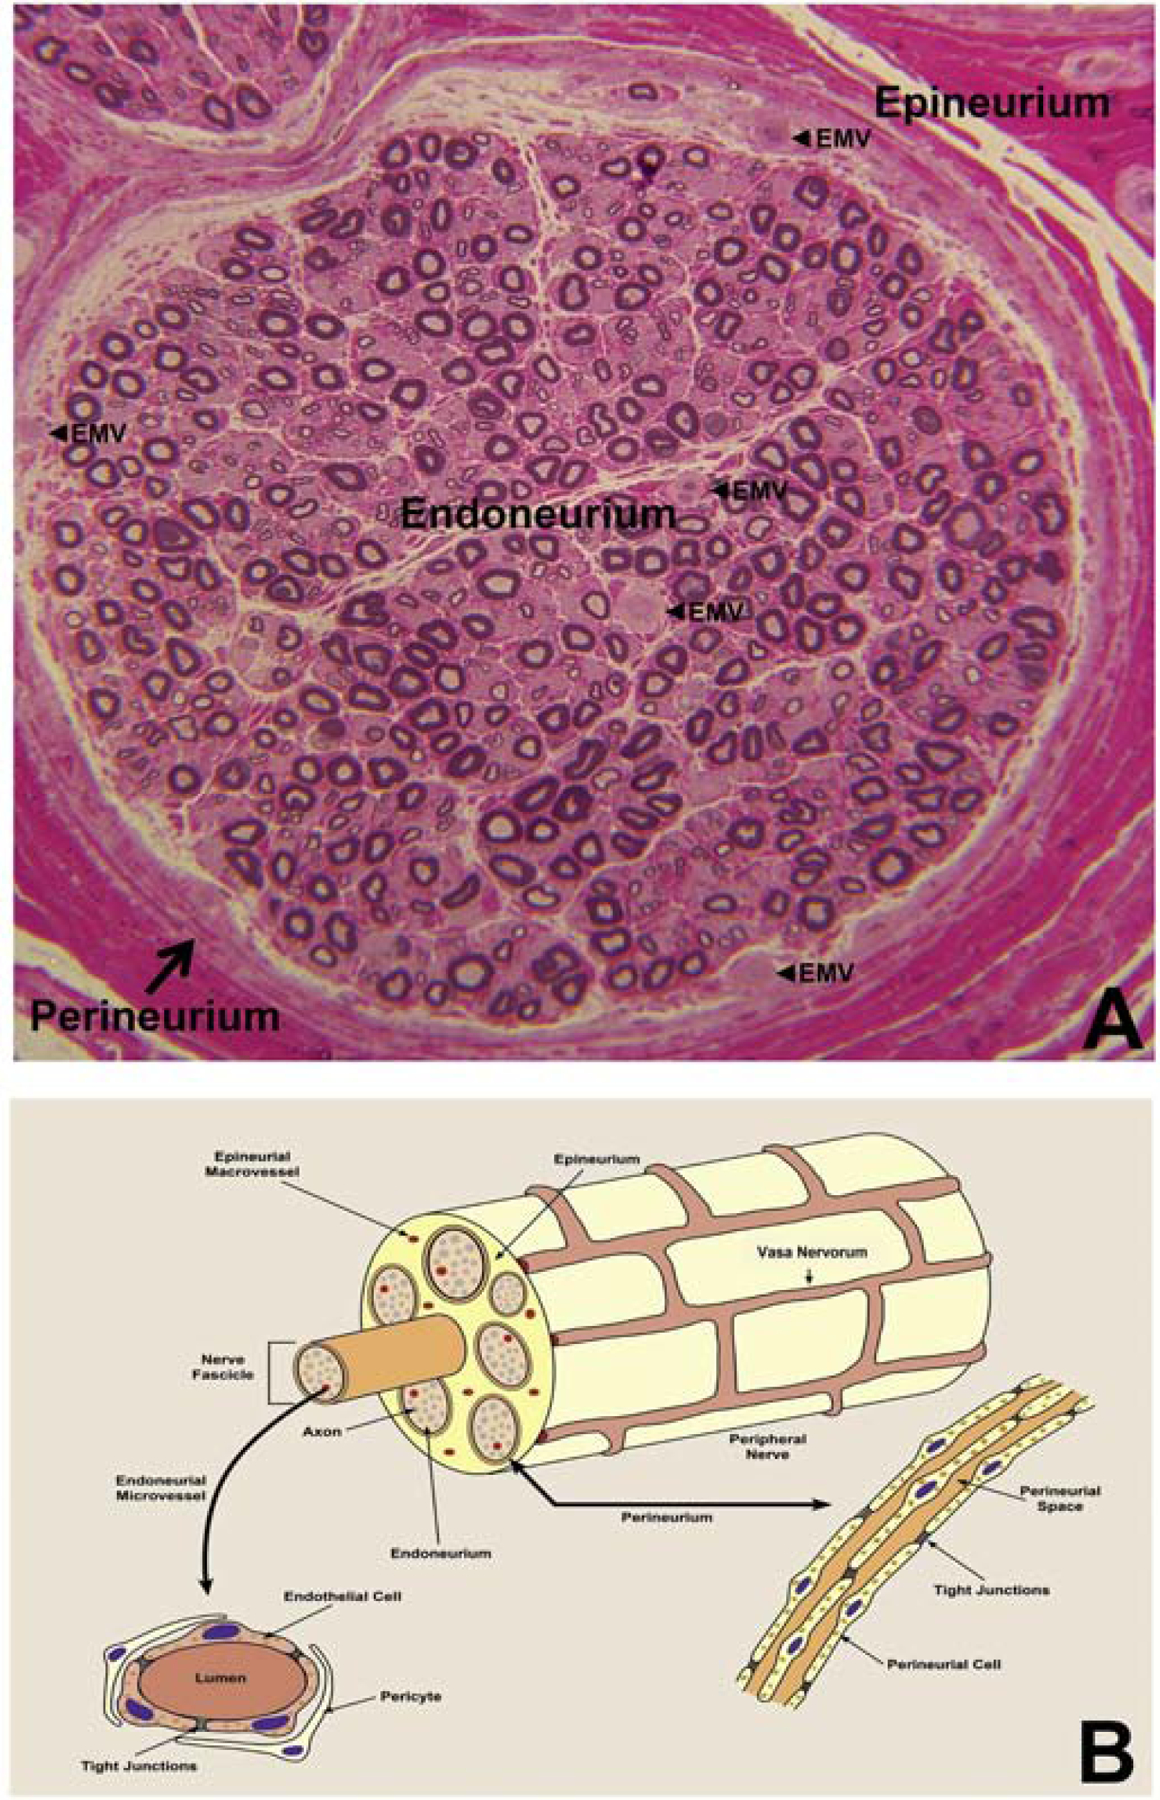
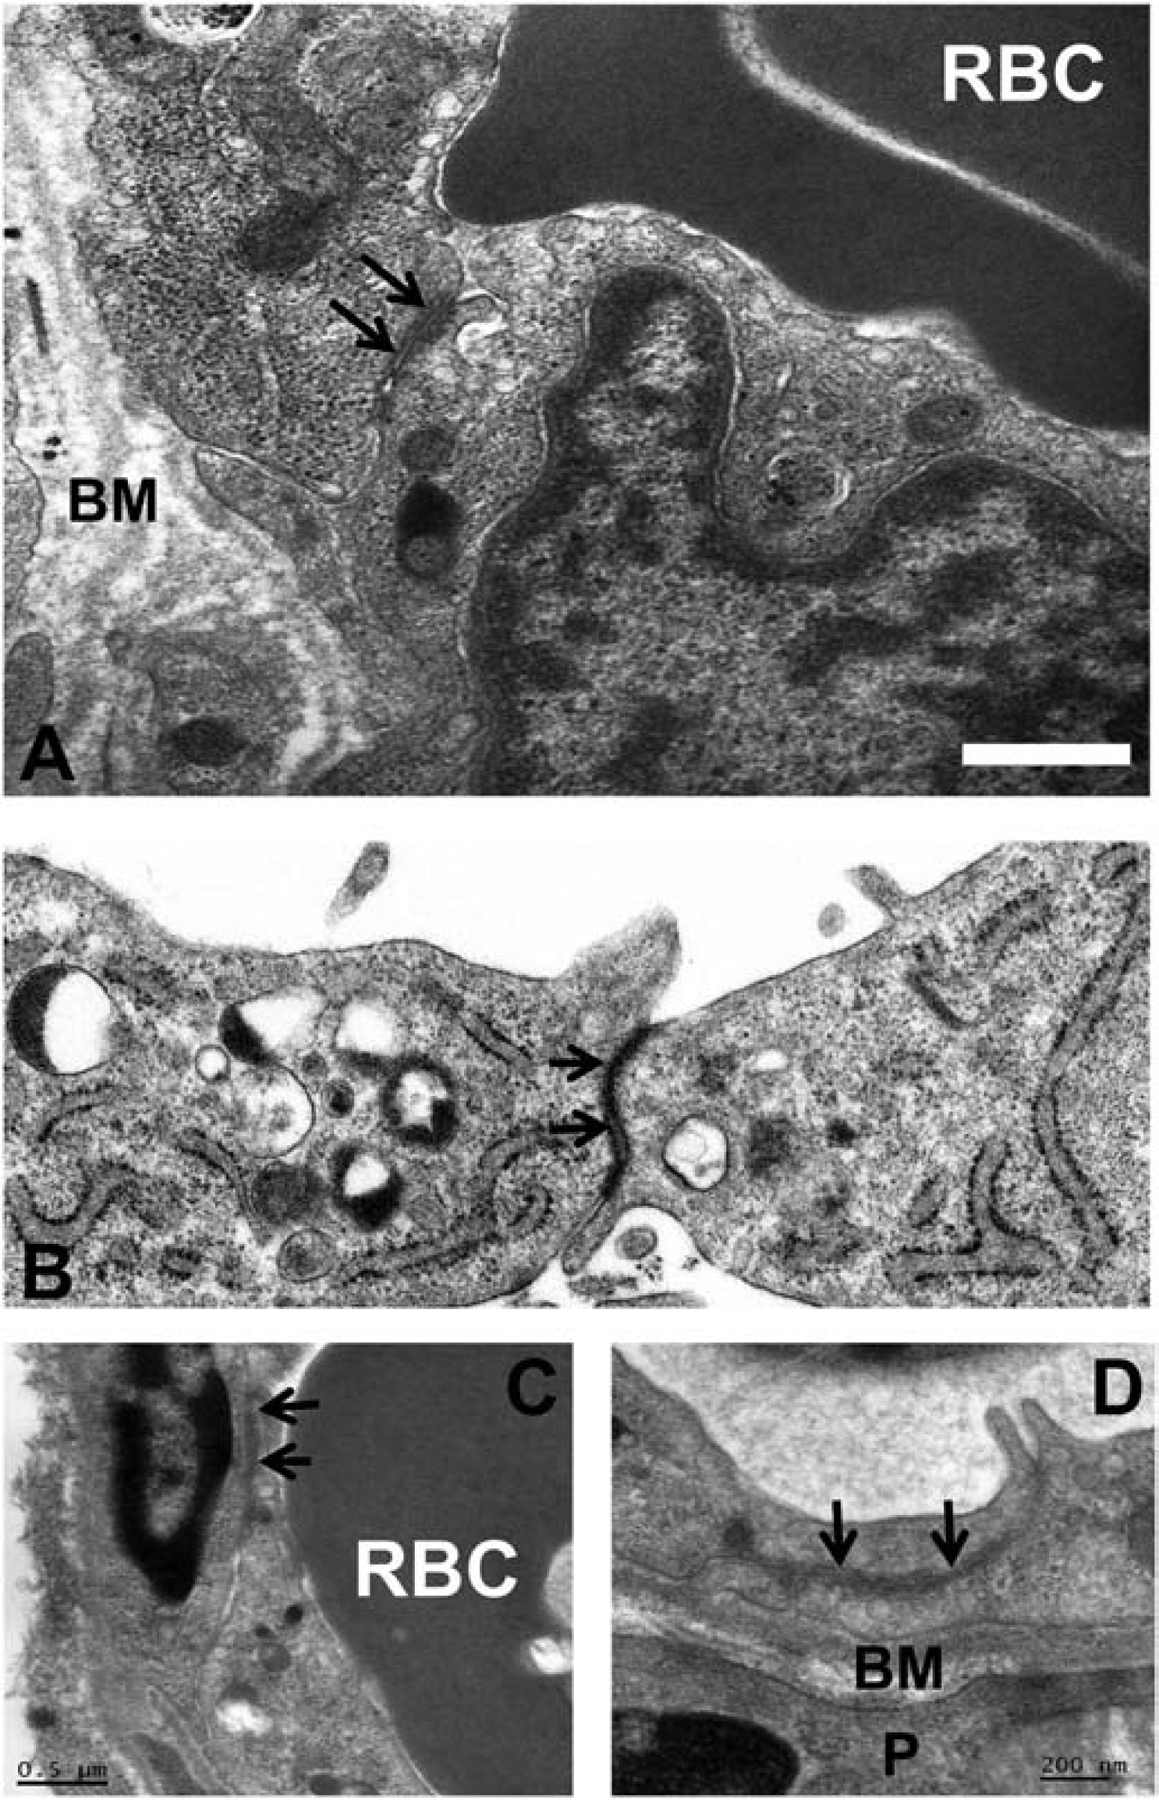
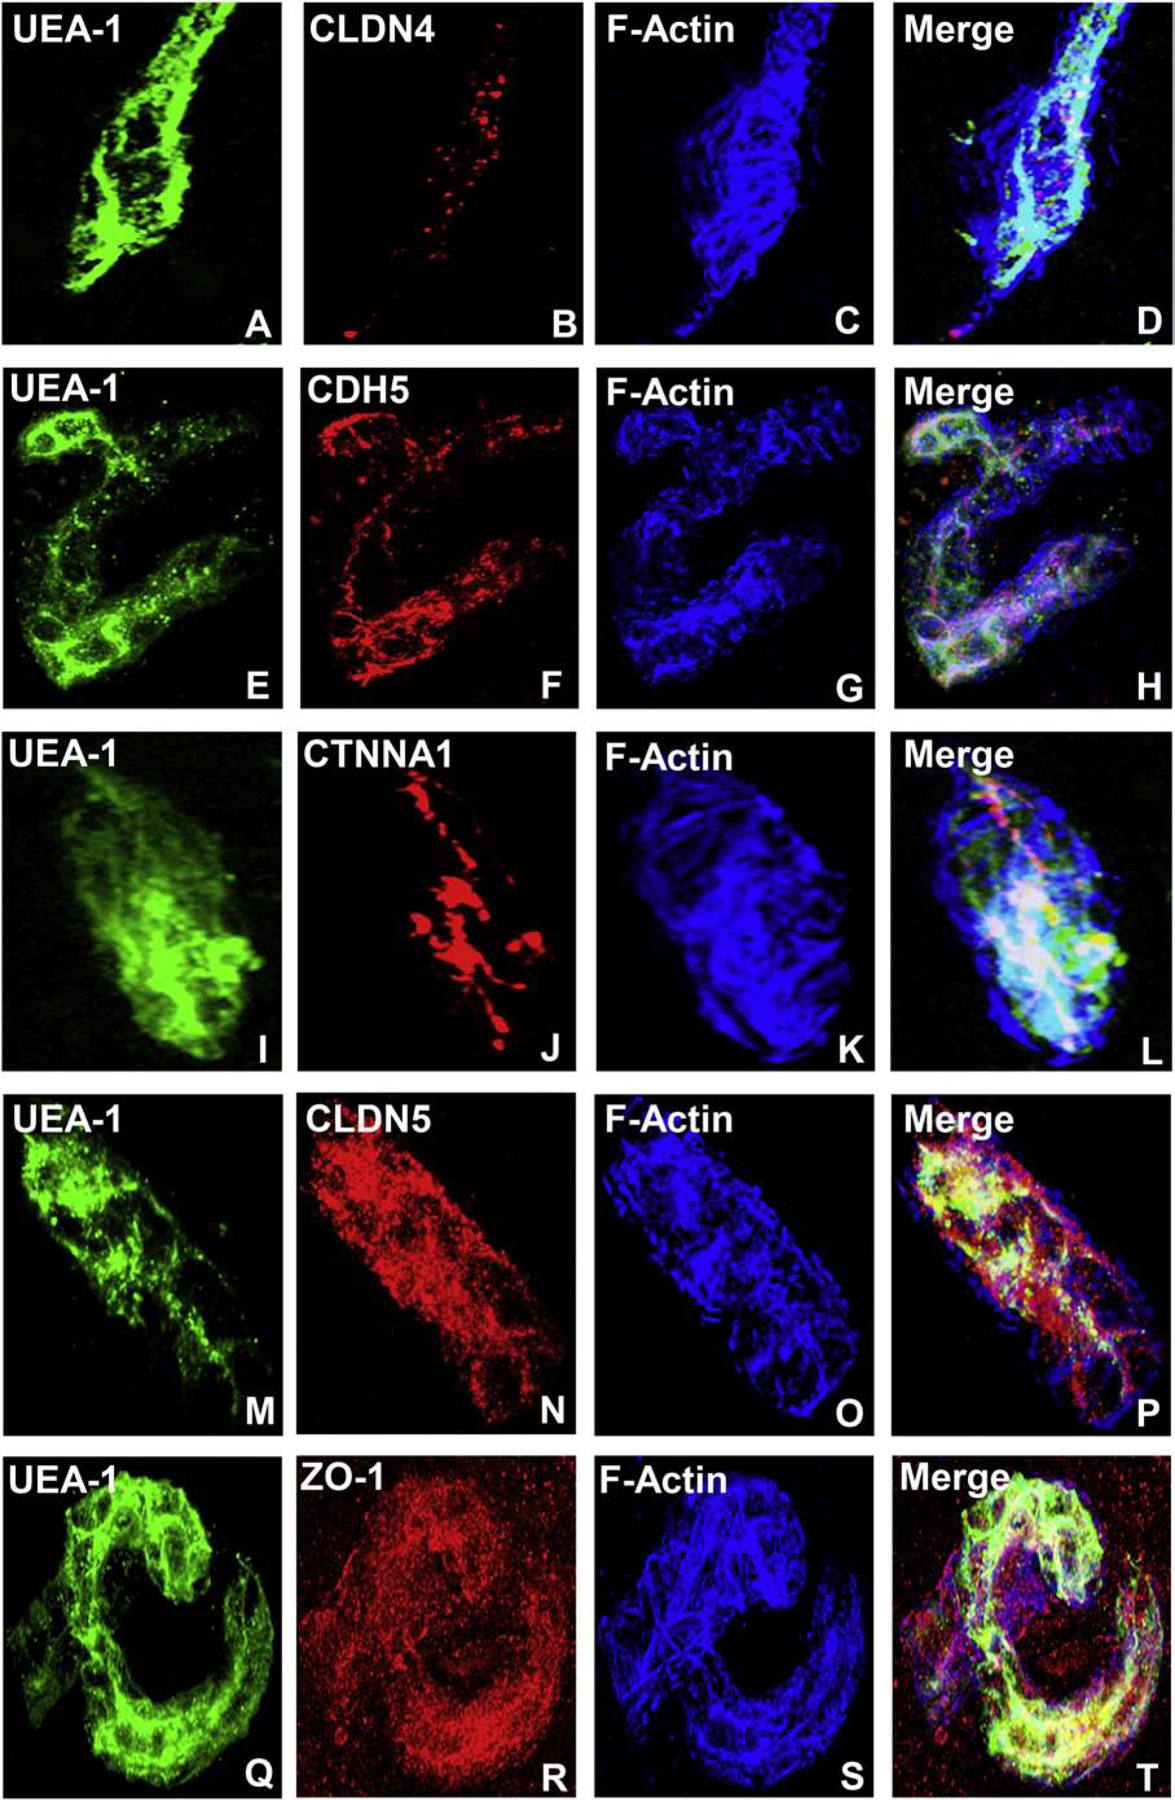
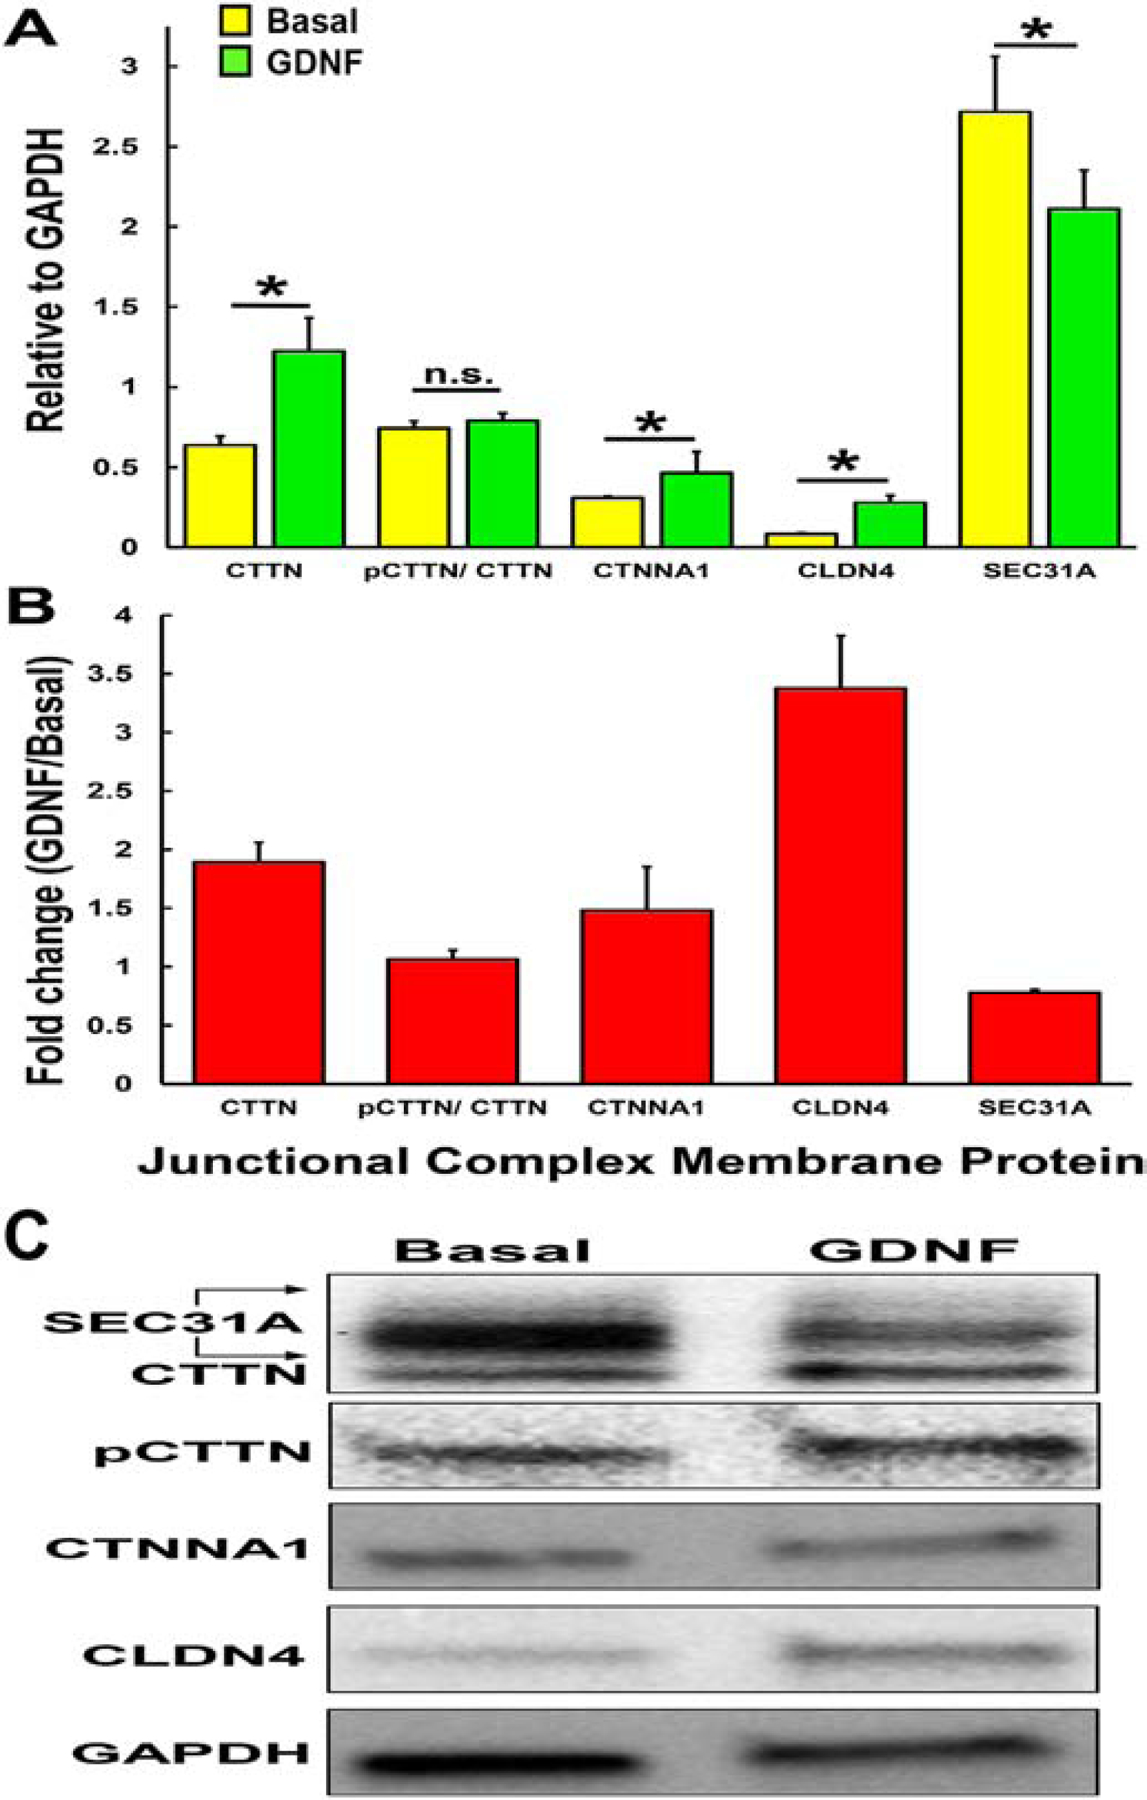
A highly regulated endoneurial microenvironment is required for normal axonal function in peripheral nerves and nerve roots, which structurally consist of an outer collagenous epineurium, inner perineurium consisting of multiple concentric layers of specialized epithelioid myofibroblasts that surround the innermost endoneurium, which consists of myelinated and unmyelinated axons embedded in a looser mesh of collagen fibers. Endoneurial homeostasis is achieved by tight junction-forming endoneurial microvessels that control ion, solute, water, nutrient, macromolecule and leukocyte influx and efflux between the bloodstream and endoneurium, and the innermost layers of the perineurium that control interstitial fluid component flux between the freely permeable epineurium and endoneurium. Strictly speaking, endoneurial microvascular endothelium should be considered the blood-nerve barrier (BNB) due to direct communication with circulating blood. The mammalian BNB is considered the second most restrictive vascular system after the blood-brain barrier (BBB) based on classic in situ permeability studies. Structural alterations in endoneurial microvessels or interactions with hematogenous leukocytes have been described in several human peripheral neuropathies; however major advances in BNB biology in health and disease have been limited over the past 50 years. Guided by transcriptome and proteome studies of normal and pathologic human peripheral nerves, purified primary and immortalized human endoneurial endothelial cells that form the BNB and leukocytes from patients with well-characterized peripheral neuropathies, validated by in situ or ex vivo protein expression studies, data are emerging on the molecular and functional characteristics of the human BNB in health and in specific peripheral neuropathies, as well as chronic neuropathic pain. These early advancements have the potential to not only increase our understanding of how the BNB works and adapts or fails to adapt to varying insult, but provide insights relevant to pathogenic leukocyte trafficking, with translational potential and specific therapeutic application for chronic peripheral neuropathies and neuropathic pain.

Keywords: Blood-nerve barrier; Chronic neuropathic pain; Endoneurium; Immune system; Inflammation; Junctional complex; Leukocyte trafficking; Peripheral neuropathy.


Figures

Figure 1.
Figure 1.. Peripheral nerve anatomy, including vascular supply.
Digital light photomicrograph of an axial section of a normal adult sural nerve (plastic embedded semi-thin axial section stained with Toluidine Blue and counterstained with Basic Fuchsin) showing the three compartments in peripheral nerves, and endoneurial microvessels (EMV, black arrowheads) that form the BNB (A). This structural organization is further illustrated in (B), with individual nerves supplied by extrinsic vessels, called vasa nervorum, which form a vascular anastomoses and penetrate into the epineurium, resulting epineurial macrovessels. These macrovessels cross the perineurium, forming endoneurial microvessels. The anatomical organization of endoneurial microvessels and the perineurium is further illustrated, with restrictive tight junctions between the endothelial cells and innermost perineurial myofibroblasts respectively.
Figure 2.
Figure 2.. Endoneurial endothelial cell ultrastructure.
Digital electron ultramicrographs from an adult sural nerve (A) and cultured semipermeable rat-tail collagen coated Transwell™ inserts (B) shows human endoneurial endothelial cells with apically located electron-dense intercellular tight junctions (black arrows). Similar tight junctions are seen between endothelial cells in adult mouse sciatic nerve endoneurial microvessels (C and D). A red blood cell (RBC) is present in the lumen of the human and mouse endoneurial microvessels (A and C). BM indicates the basement membrane, shared between endoneurial endothelial cells and pericytes (P). Scale bar = 0.5 μm (A), or as indicated in figure (C, D).
Figure 3.
Figure 3.. Human BNB Junctional complex.
Digital high resolution indirect immunohistochemistry confocal photomicrographs of normal adult endoneurial microvessels stained with Ulex Europaeus Agglutinin-1 (UEA-1) to detect endothelial cell membranes (green; A, E, I, M and Q) and Rhodamine Phalloidin to detect endoneurial microvessel F-actin cytoskeleton (pseudocolor blue; C, G, K, O and S) were generated to determine cellular localization of hypothesized junctional complex molecules (red) claudin 4 (CLDN4, B), cadherin 5 (CDH5, F), α−1 catenin (CTNNA1, J), claudin 5 (CLDN5, N) and zona occludens-1 (ZO-1, R). The punctuate CLDN4 expression and membrane co-localization suggest that this molecule is an essential component of BNB tight junctions (D). The linear, continuous CDH5 expression and membrane co-localization are consistent with an adherens junction protein (H). The plaque-like linear CTNNA1 expression and strong membrane and cytoskeletal co-localization suggest a role as an adaptor molecule that links the endoneurial microvessel membrane to the cytoskeleton. Both CLDN5 (P) and ZO-1 (T) demonstrate diffuse microvessel expression with additional strong continuous membrane and cytoskeletal co-localization, implying that they are not structural components of BNB tight junctions, but may have essential roles in the overall structural integrity (e.g. adaptor or scaffolding protein) of normal human adult endoneurial microvessels.
Figure 4.
Figure 4.. Human BNB Junctional complex.
Bar histograms demonstrate the effect of exogenous human recombinant GDNF on human BNB tight junctional complex protein expression after 48 hours in vitro. Western blot of confluent pHEndEC membrane protein extracts was performed following SDS-PAGE, using standard protocols with specific validated primary and secondary antibodies. Semi-quantitative expression relative to GAPDH for basal (yellow) and GDNF-treated (green) pHEndECs (A) and GDNF-induced fold-change (B) are shown for each protein, with the ratio of pCTTN/ CTTN shown to indicate whether GDNF modulates pCTTN expression independent of CTTN. * indicates p<0.05, n.s. = not significant. Error bars indicate standard errors of means (N=3). A representative digital western blot image showing GDNF-induced human BNB junctional complex protein expression at 48 hours in vitro is shown, with reduced membrane SEC31A (C)
Figure 5.
Figure 5.. Human BNB junction complex formation: The GDNF-CREB1-SRC-CTTN/CTNNA1/CLDN4-SEC31A hypothesis.
Guided by the human BNB transcriptome and in vitro pHEndEC membrane proteome, this figure illustrates a restrictive GDNF-mediated BNB forming pathway downstream of GFRα1-RET-MAPK signaling, including specialized junctional complex protein transport for further study. +P indicates a phosphorylation and P indicates an activated phosphorylated protein.
Figure 6.
Figure 6.. Molecular determinants of the in vitro human BNB.
ECIS was performed to continuously measure pHEndEC TEER following initial plating for 5 days and 48 hours after serum withdrawal (to induce endothelial cell detachment). Following treatment with GDNF (1 ng/mL) and transfection with validated specific siRNA to inhibit gene transcription or SRC kinase blockade using a Bosutinib, TEER increase was calculated for each well by subtracting the mean lowest TEER during the 1st hour after serum withdrawal from mean maximal resistance at predefined time points, with appropriate negative controls. Histograms demonstrate averages for each time point (A: 24 hours, B: 36 hours, and C: 48 hours) in this single experiment performed in duplicate for each experimental condition.
Figure 7.
Figure 7.. BNB tight junction ultrastructure in GBS (AIDP) and CIDP.
Composite digital electron ultramicrographs demonstrate structurally intact, apical membrane localized, electron dense intercellular tight junctions (solid white arrows) between endoneurial endothelial cells within the inflammatory milieu in severely affected GBS (A) and CIDP (B) patient sural nerve biopsies. RBC indicates luminal red blood cells and P indicates pericytes and their cytoplasmic projections surrounding these endoneurial microvessels. Scale bar = 2.5 μm.
Figure 8.
Figure 8.. Endoneurial microvessel wall thickening/ basement membrane duplication.
Composite digital light photomicrographs of an axial section of a CIDP patient sural nerve biopsy (plastic embedded semi-thin axial section stained with Toluidine Blue and counterstained with Basic Fuchsin) showing endoneurial microvessel wall thickening (black arrows) at low magnification (A) and at higher magnification in another CIDP patient (B). These changes are also seen in a vasculitic neuropathy patient with chronic neuropathic pain (C). These changes are in contrast to thin walls seen in normal adult endoneurial microvessels (D). Composite digital ultramicrographs of the sural nerve biopsy from a CIDP patient (E and F) show endoneurial microvessel basement membrane duplication (white arrows). This is shown at higher magnification in the insert in E. This is also observed in sciatic nerve endoneurial microvessels in transgenic GDNF wildtype mice following non-transecting crush injury followed by SRC kinase inhibition to impede BNB functional recovery (G). A normal sciatic nerve endoneurial microvessel from the contralateral uninjured side of the same transgenic GDNF wildtype mouse is shown for structural comparison (H).
Figure 9.
Figure 9.. CD11b leukocyte infiltration and demyelination in GBS (AIDP).
Digital indirect fluorescent photomicrographs of longitudinal sections from the sural nerves from 3 untreated adult patients with AIDP stained with S100β (green) to detect myelinating Schwann cells and membranes associated with axons (with DAPI [blue] detecting nuclei; A, D and G), show clusters of infiltrated endoneurial CD11b+ leukocytes (red; B, E and H) associated with disrupted Schwann cell membrane organization (C, F and I). Scale bar = 50 μm.
Figure 10.
Figure 10.. CD11d expression in CIDP Patient PBMLs.
Merged FACS histograms showing CD14+ CD11d+ monocyte expression in 2 untreated CIDP patients (CIDP 1 and CIDP 2) compared to 2 age- and sex-matched controls (control 1 and control 2) show increased mean fluorescent intensity (MFI, a marker of receptor density) in the CIDP patients compared to controls. The tables show comparative CD11d expression data for CD14+ monocytes, CD19+ B-lymphocytes, as well as CD3+ CD4+, CD3+ CD8+ and CD3+ CD4− CD8− T-lymphocytes, suggesting a potential role in pathogenic leukocyte trafficking in CIDP.
Figure 11.
Figure 11.. CD11d expression in CIDP Patient sural nerve.
Digital indirect fluorescent photomicrographs of axial and longitudinal sections from 2 CIDP patients and age- and sex-matched adult controls stained with monocyte/ macrophage marker CD68, B-lymphocyte marker CD19 and T-lymphocyte marker CD3 (green) with nuclei stained with DAPI (blue; A, D, G, J, M, P) to co-localize with CD11d expression (red, B, E, H, K, N, Q), showing increased endoneurial expression in CD68+ CD11d+ monocytes/ macrophages (C), CD19+ CD11d+ B-lymphocytes (I) and CD3+ CD11d+ T-lymphocytes (O) compared to controls (F, L, R). The white lines depict the abluminal membrane of endoneurial microvessels in order to highlight adherent luminal CD11d+ leukocytes. Scale bar = 25 μm.
Figure 12.
Figure 12.. CCL5 expression by the basal human in vitro BNB.
TaqMan rt-PCR was performed using complementary DNA obtained by reverse transcription of confluent cultured pHEndEC mRNA extracts 4–5 days after initial plating to detect CCL5 expression using specific validated primers. Expression was verified from 2 separate cultures via amplicon detection intensity above a predefined detection threshold (A), detection of PCR reaction with appropriate sigmoidal amplification with repetitive cycles (B) and verification of expected PCR product using ethidium bromide-stained gel electrophoresis (C, with numbers indicating base pair [bp] size markers), compared to negative controls that lack specific primers. CCL5 pHEndEC protein expression was confirmed in duplicate by western blot (most likely as a dimer of ~ 15 KDa) using a specific validated primary goat-anti human antibody following SDS-PAGE of total cytoplasmic and membrane protein extracts from confluent cultures, using standard protocols (D). Numbers indicate molecular weight of the protein standard markers, in KDa. Bar histograms from a human chemokine antibody array show chemokine expression by basal confluent pHEndECs (yellow) and 10 U/mL TNF-α and 20 U/mL IFN-γ cytokine treated pHEndECs for 24 hours in vitro, relative to internal array controls. CCL5 expression is shown with black arrow, with no significant upregulation following physiological cytokine stimulus.
Figure 13.
Figure 13.. CCR5 expression in HIV DSN Patient sural nerve: IHC.
Merged digital indirect fluorescent photomicrographs of axial and longitudinal sections from a HIV+ patient with DSN show clusters of endoneurial CCR5+ CD68+ monocytes/macrophages at low (A) and higher magnification (B and C, white arrows), and an endoneurial microvessel (white outline) with multiple luminal adherent CCR5+ CD68+ monocytes (white arrow heads, D). Less common endoneurial clusters of CCR5+ CD4+ T-lymphocytes (E) and CCR5+ CD8+ T-lymphocytes (F) are also observed in this specimen.
Figure 14.
Figure 14.. PBML CCR5 expression in untreated HIV+ patient vs. HIV− controls.
Comparative histograms of HIV+ cART-naïve patients and age- and sex-matched controls show increased mean % of CD14+ CD16+ (A) and CD14+ CD16+ CCR5+ (B) monocytes in HIV+ patients, as well as increased CCR5 mean fluorescent intensity (marker of receptor density per cell) in CD3+ CD4+ (C) and CD3+ CD8+ (D) T-lymphocytes, suggesting a potential role in pathogenic leukocyte trafficking in HIV−DSN.
Figure 15.
Figure 15.. CCR5 blockade during HIV+ PBML trafficking at the human in vitro BNB under flow.
0.1 μg/mL of function neutralizing mouse anti-human CCR5 antibody maximally inhibited a single HIV+ cART-naïve PBML adhesion/ migration at the in vitro basal human BNB, mimicking conditions that may occur during the early stages of HIV infection, using our published leukocyte-BNB dynamic trafficking assay. Numbers are normalized to trafficking measured during basal PBML migration without antagonists or agonists.
Figure 16.
Figure 16.. CD11d expression in HIV DSN Patient sural nerve.
Merged digital indirect fluorescent photomicrographs of axial sections from a HIV+ patient with DSN show CD11d+ CD45+ leukocytes (white arrows) trafficking across endoneurial microvessels (A and B) at high magnification. CCR5+ CD68+ monocytes/macrophages (white arrows, A, B). Clusters of endoneurial CD11d+ CD45 leukocytes at different magnifications are also shown (C, D and E).
Figure 17.
Figure 17.. PBML CD11d expression in untreated HIV+ patient vs. HIV− control.
Comparative FACS gated color dot plots for cryopreserved PBMLs from HIV+ cART-naïve patient and age- and sex-matched HIV− control show increased relative expression of CD16+, CD16+ CCR5+ CD14+ monocytes in the HIV+ patient with 100% of CD14+ CD16+ CCR5+ cells being CD11d+ in both the patient and HICV control. Upper panels indicate HIV+ patient data while lower panels represent the HIV− control data, with the numbers showing % of the indicated subpopulation in each panel. These data suggest the HIV effector cell, CD14+ CD16+ monocytes may utilize CD11d integrin for leukocyte trafficking downstream of CCR5.
Figure 18.
Figure 18.. CD99L2 expression during diapedesis in HIV DSN Patient sural nerve.
Merged digital indirect fluorescent high magnification photomicrographs of axial sections from a HIV+ patient with DSN show focal CD99L2 co-localization (white arrows, A and B) between infiltrating leukocytes and UEA-1+ endoneurial microvessels (green) with nuclei stained with DAPI (blue), implying a role in HIV+ leukocyte diapedesis associated with DSN. Scale bar = 5 μm.
Figure 19:
Figure 19:. Leukocyte Trafficking in HIV DSN: The CCR5-CD11d-CD99L2 hypothesis.
Guided by the multistep paradigm for leukocyte trafficking and emerging data on HIV−DSN, the figure illustrates chemoattraction of hematogenous CD14+ CD16+ CCR5+ monocytes to endoneurial microvascular endothelial cells that express CCL5 on the luminal (apical) surface membranes bound to glycosaminoglycans. CCR5-CCL5 binding results in a conformational change in CD11d integrin that converts it from a non-binding to a binding molecule (integrin activation) that induces firm leukocyte adhesion with flattening due to strong flow-resistant binding and interactions with an unknown endothelial surface cell adhesion molecule (? VCAM-1, ICAM-1). This is followed by paracellular diapedesis via CD99L2 hemophilic interactions between infiltrating leukocytes and endoneurial endothelial cells en route to the endoneurium to carry out effector functions.
Figure 20.
Figure 20.. Loss of CTNNA1 and CLDN4 loss in endoneurial microvessels in the sural nerve of a patient with vasculitic neuropathy with chronic neuropathic pain.
Digital high resolution indirect immunohistochemistry confocal micrographs of endoneurial microvessels from a patient with a vasculitic neuropathy and chronic neuropathic pain and age- and sex-matched normal adult control sural nerves stained with UEA-1 to detect endothelial cell membranes (green; A, D, G and J), and junctional complex molecules CTNNA1 (red, with nuclei stained with DAPI, pseudocolor grey, B and E) or CLDN4 (red, H and K), show loss of both endoneurial microvessel CTNNA1 (B and C) and CLDN4 (H and I) expression compared to the plaque-like linear CTNNA1 (E and F) and punctate CLDN4 (K and L, consistent with a tight junction protein) associated with normal endoneurial endothelial microvessel membranes. This observation suggests that molecular alterations of essential junctional complex proteins may occur in vasculitic neuropathy in association with chronic neuropathic pain.
Figure 21.
Figure 21.. Chronic reflex nociception in transgenic GDNF mice following sciatic nerve crush injury.
Blinded reflexive nociception tests demonstrate recovery in reflexive neurobehavioral nociception measures in GDNF WT mice (associated with restoration of restrictive BNB permeability function within 14 days after injury) by 29 days post-injury, indicated as equivalent mean % threshold (~100%) between the injured and uninjured (Sham) sciatic nerves, with significant persistent increased nociception, indicated a % mean reduction in normal withdrawal thresholds (normalized to the contralateral injured [Sham] sciatic nerve) in GDNF CKO mice (associated with delayed restoration of restrictive BNB permeability function) up until 6 weeks post-injury. Error bars indicate standard errors of the mean. * indicates p<0.05, N=4
Figure 22.
Figure 22.. pCTTN expression at the murine BNB in GDNF transgenic mice following sciatic nerve crush injury.
Digital indirect fluorescent photomicrographs of murine sciatic nerve endoneurial microvessels within 3 hours (Day 0) and 7 days (Day 7) after crush injury in GDNF WT and GDNF CKO mice are shown, with Sham indicating uninjured sciatic nerves. CD31 (green, endothelial cell marker, A, E, I, M and Q) and nuclear marker DAPI (blue, C, G, K, O and S) were performed to identify endoneurial microvessels. Punctuate membrane pCTTN expression is lost in both GDNF WT and CKO mice immediately after injury, with partial recovery seen in GDNF WT mice only on Day 7. N=2, Scale bar = 2.5 μm.
Figure 23.
Figure 23.. CTNNA1 expression at the murine BNB in GDNF transgenic mice following sciatic nerve crush injury.
Digital indirect fluorescent photomicrographs of murine sciatic nerve endoneurial microvessels within 3 hours (Day 0) and 7 days (Day 7) after crush injury in GDNF WT and GDNF CKO mice are shown, with Sham indicating uninjured sciatic nerves. CD31 (green, endothelial cell marker, A, E, I, M and Q) and nuclear marker DAPI (blue, C, G, K, O and S) were performed to identify endoneurial microvessels. Plaque-like linear membrane CTNNA1 expression is partly lost in both GDNF WT and CKO mice immediately after injury, with near complete recovery seen in GDNF WT mice and partial recovery in GDNF CKO mice on Day 7, implying an important role in restoring endoneurial homeostasis after injury. N=2, Scale bar = 2.5 μm.
Figure 24.
Figure 24.. CLDN4 expression at the murine BNB in GDNF transgenic mice following sciatic nerve crush injury.
Digital indirect fluorescent photomicrographs of murine sciatic nerve endoneurial microvessels within 3 hours (Day 0) and 7 days (Day 7) after crush injury in GDNF WT and GDNF CKO mice are shown, with Sham indicating uninjured sciatic nerves. CD31 (green, endothelial cell marker, A, E, I, M and Q) and nuclear marker DAPI (blue, C, G, K, O and S) were performed to identify endoneurial microvessels. Punctuate membrane CLDN4 expression is lost in both GDNF WT and CKO mice immediately after injury, with partial recovery seen in GDNF WT mice only on Day 7. N=2, Scale bar = 2.5 μm.
Figure 25.
Figure 25.. Role of SRC kinase in restoring structure and restrictive murine BNB permeability in GDNF transgenic mice following sciatic nerve crush injury.
Axial digital ultramicrographs show electron-dense inter-cellular tight junctions (white arrows) in normal, horseradish peroxidase-impermeable endoneurial microvessels in Sham surgery control nerves (A). On Day 7 after crush injury, tight junctions are commonly seen in GDNF WT mice (B), even in microvessels with endothelial cell proliferation (C). Structurally disorganized permeable microvessels are commonly seen in GDNF WT mice treated with SRC kinase inhibitor, Bosutinib, with basement membrane duplication (red arrow, D). Structurally organized permeable microvessels that lack tight junctions are commonly seen in GDNF CKO mice (E). On Day 14, more intact endoneurial microvessels with tight junctions (white arrows) are seen in GDNF WT mice (F). Permeable microvessels with disorganized endothelial cells and basement membrane duplication (red arrows) are commonly seen in GDNF WT mice treated with Bosutinib (G). More permeable microvessels are seen in GDNF CKO mice, with less frequent tight junctions (white arrow, H) compared to GDNF WT mice. Original magnification 4500–7000X. Bar histograms show sciatic nerve BNB permeability to horseradish peroxidase, quantified as the % of permeable microvessels in each nerve by electron microscopy, with data compared with the uninjured contralateral Sham surgery nerve (purple) and the different experimental groups on Day 7 (I) and Day 14 (J). SRC kinase inhibitor, Bosutinib abrogated the expected GDNF-driven restoration of BNB impermeability following nerve injury on days 7 and 14, with the expected delayed in GDNF CKO mice also observed as previously published. N=1 (quantified in duplicate with a mean of 17 microvessels/ mouse evaluated).

Similar articles

Cited by

References

    1. 2008. Life expectancy of individuals on combination antiretroviral therapy in high-income countries: a collaborative analysis of 14 cohort studies. Lancet 372, 293–299. - PMC - PubMed
    1. Abe M, Sano Y, Maeda T, Shimizu F, Kashiwamura Y, Haruki H, Saito K, Tasaki A, Kawai M, Terasaki T, Kanda T, 2012. Establishment and characterization of human peripheral nerve microvascular endothelial cell lines: a new in vitro blood-nerve barrier (BNB) model. Cell Struct Funct 37, 89–100. - PubMed
    1. Allen SJ, Watson JJ, Shoemark DK, Barua NU, Patel NK, 2013. GDNF, NGF and BDNF as therapeutic options for neurodegeneration. Pharmacol Ther 138, 155–175. - PubMed
    1. Allt G, Lawrenson JG, 2000. The blood-nerve barrier: enzymes, transporters and receptors--a comparison with the blood-brain barrier. Brain Res Bull 52, 1–12. - PubMed
    1. Aziz MH, Cui K, Das M, Brown KE, Ardell CL, Febbraio M, Pluskota E, Han J, Wu H, Ballantyne CM, Smith JD, Cathcart MK, Yakubenko VP, 2017. The Upregulation of Integrin alphaDbeta2 (CD11d/CD18) on Inflammatory Macrophages Promotes Macrophage Retention in Vascular Lesions and Development of Atherosclerosis. J Immunol 198, 4855–4867. - PMC - PubMed

Publication types