

Healthcare utilization after a first hospitalization for COPD: a new approach of State Sequence Analysis based on the '6W' multidimensional model of care trajectories
- PMID: 32143702
- PMCID: PMC7059729
- DOI: 10.1186/s12913-020-5030-0
Healthcare utilization after a first hospitalization for COPD: a new approach of State Sequence Analysis based on the '6W' multidimensional model of care trajectories
Abstract
Background: Published methods to describe and visualize Care Trajectories (CTs) as patterns of healthcare use are very sparse, often incomplete, and not intuitive for non-experts. Our objectives are to propose a typology of CTs one year after a first hospitalization for Chronic Obstructive Pulmonary Disease (COPD), and describe CT types and compare patients' characteristics for each CT type.
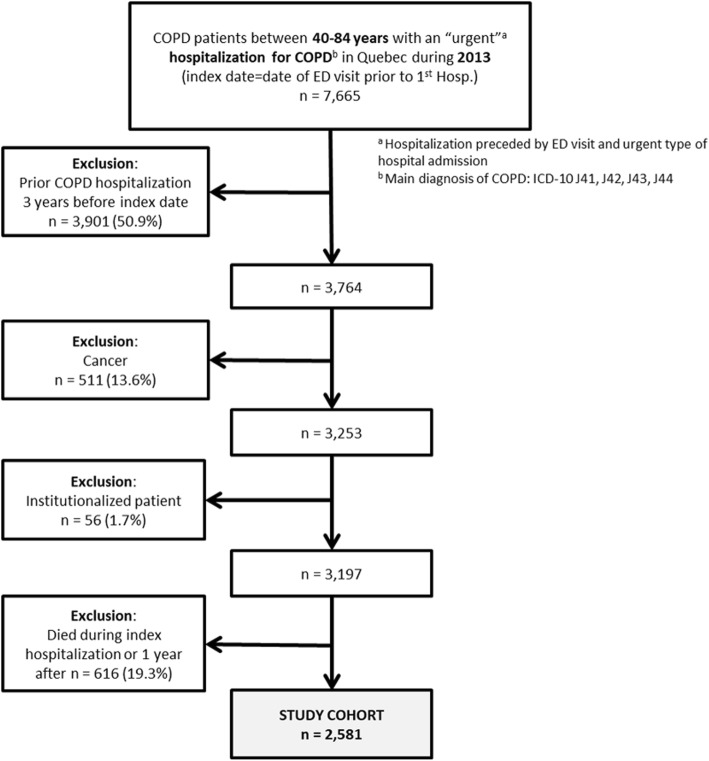
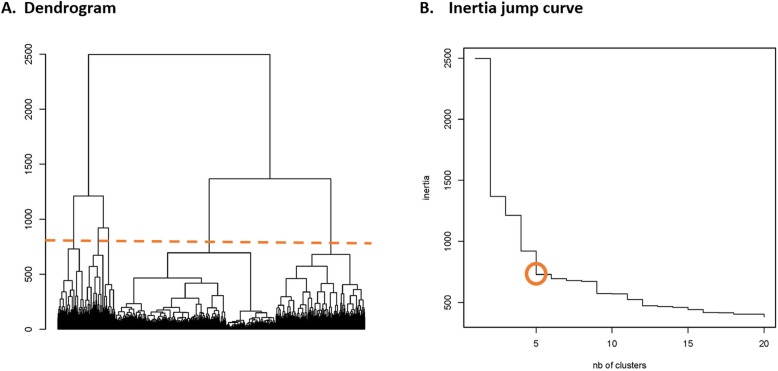
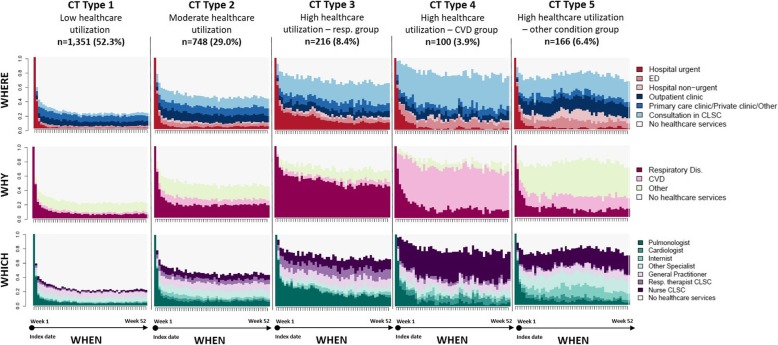
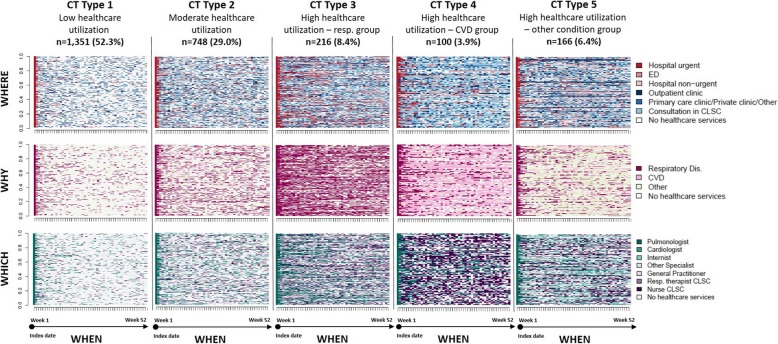
Methods: This is an observational cohort study extracted from Quebec's medico-administrative data of patients aged 40 to 84 years hospitalized for COPD in 2013 (index date). The cohort included patients hospitalized for the first time over a 3-year period before the index date and who survived over the follow-up period. The CTs consisted of sequences of healthcare use (e.g. ED-hospital-home-GP-respiratory therapists, etc.) over a one-year period. The main variable was a CT typology, which was generated by a 'tailored' multidimensional State Sequence Analysis, based on the "6W" model of Care Trajectories. Three dimensions were considered: the care setting ("where"), the reason for consultation ("why"), and the speciality of care providers ("which"). Patients were grouped into specific CT types, which were compared in terms of care use attributes and patients' characteristics using the usual descriptive statistics.
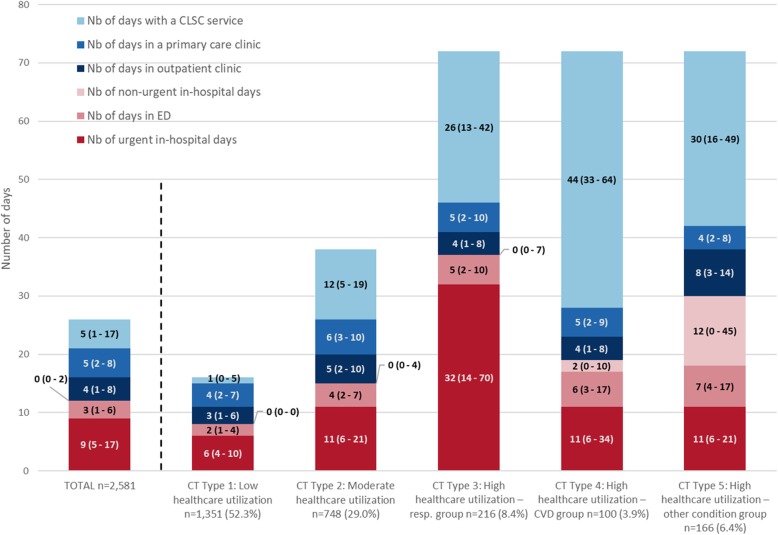
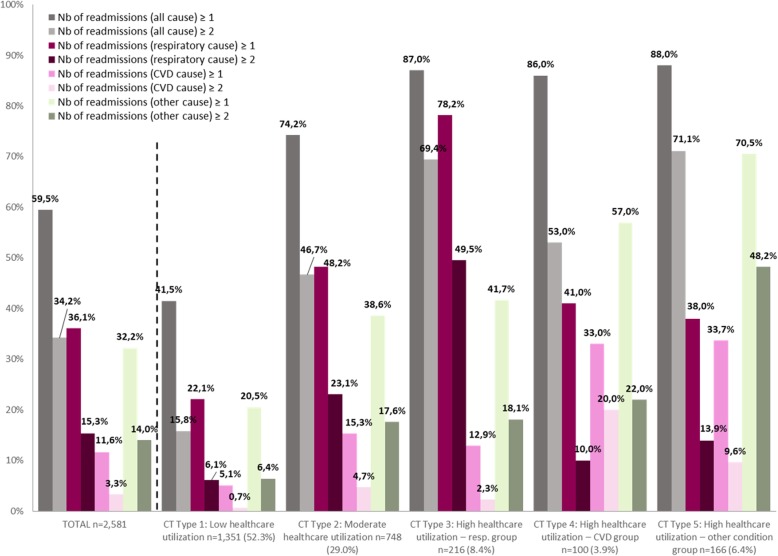
Results: The 2581 patients were grouped into five distinct and homogeneous CT types: Type 1 (n = 1351, 52.3%) and Type 2 (n = 748, 29.0%) with low healthcare and moderate healthcare use respectively; Type 3 (n = 216, 8.4%) with high healthcare use, mainly for respiratory reasons, with the highest number of urgent in-hospital days, seen by pulmonologists and respiratory therapists at primary care settings; Type 4 (n = 100, 3.9%) with high healthcare use, mainly cardiovascular, high ED visits, and mostly seen by nurses in community-based primary care; Type 5 (n = 166, 6.4%) with high healthcare use, high ED visits and non-urgent hospitalisations, and with consultations at outpatient clinics and primary care settings, mainly for other reasons than respiratory or cardiovascular. Patients in the 3 highest utilization CT types were older, and had more comorbidities and more severe condition at index hospitalization.
Conclusions: The proposed method allows for a better representation of the sequences of healthcare use in the real world, supporting data-driven decision making.
Keywords: (3–10) State sequence analysis; COPD; Care Trajectories; Data visualization; Healthcare utilization; Observational study; Optimal matching; TraMineR; Typology.
Conflict of interest statement
The authors declare that they have no competing interests.
Figures

References
-
- World Health Organization (WHO). Chronic obstructive pulmonary disease (COPD), key facts. 2017. Available from https://www.who.int/news-room/fact-sheets/detail/chronic-obstructive-pul.... Cited Mar 2019.
-
- Singh D, Agusti A, Anzueto A, Barnes PJ, Bourbeau J, Celli BR, Criner GJ, Frith P, Halpin DM, Han M, Varela MV. Global strategy for the diagnosis, management, and prevention of chronic obstructive lung disease: the GOLD science committee report 2019. Eur Respir J. 2019;1:1900164. doi: 10.1183/13993003.00164-2019. - DOI - PubMed
Publication types
MeSH terms
Grants and funding
LinkOut - more resources
Full Text Sources
Medical
Research Materials
