. 2020 Mar 6;11(1):1228.
doi: 10.1038/s41467-020-15051-z.

Electron transport chain activity is a predictor and target for venetoclax sensitivity in multiple myeloma

Affiliations

Electron transport chain activity is a predictor and target for venetoclax sensitivity in multiple myeloma

Richa Bajpai et al. Nat Commun. .

Abstract

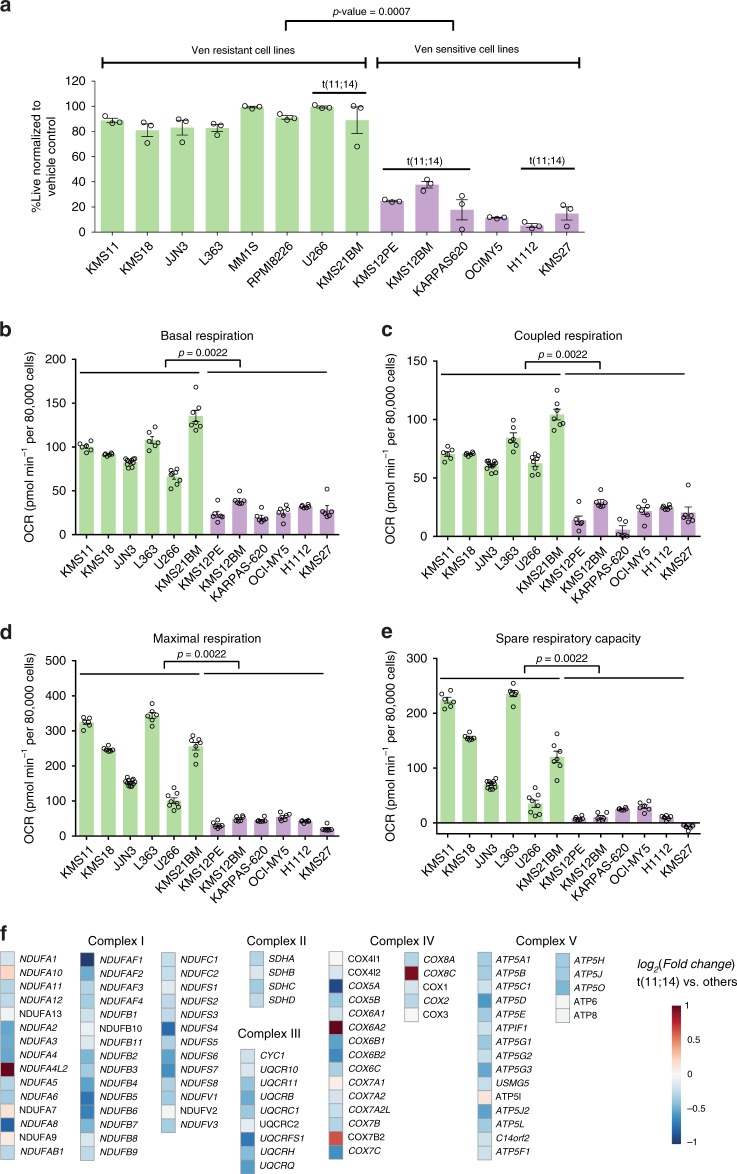
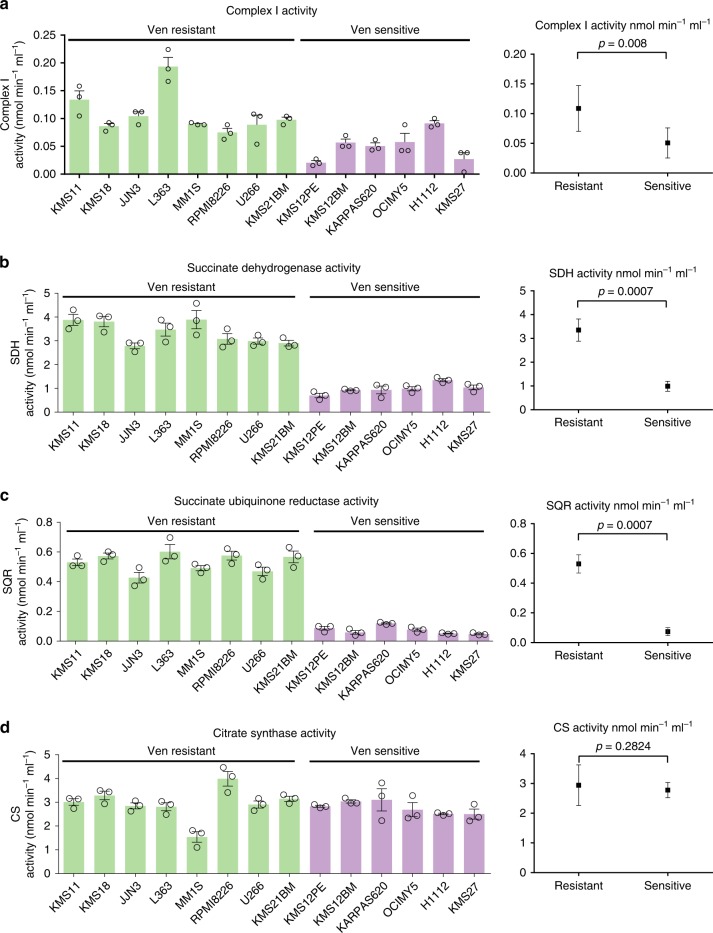
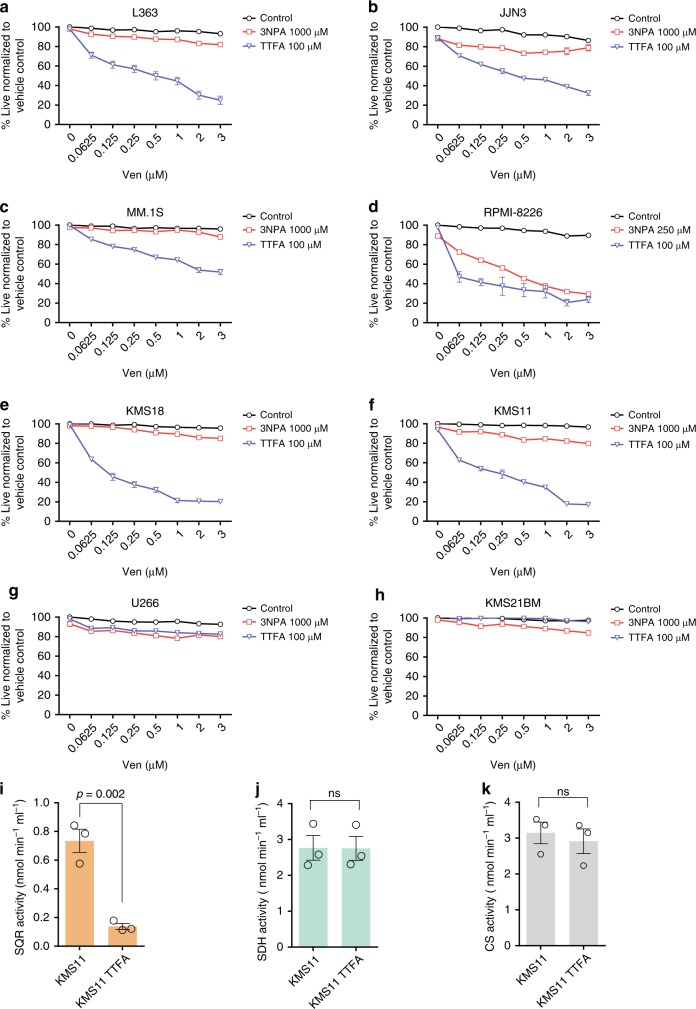
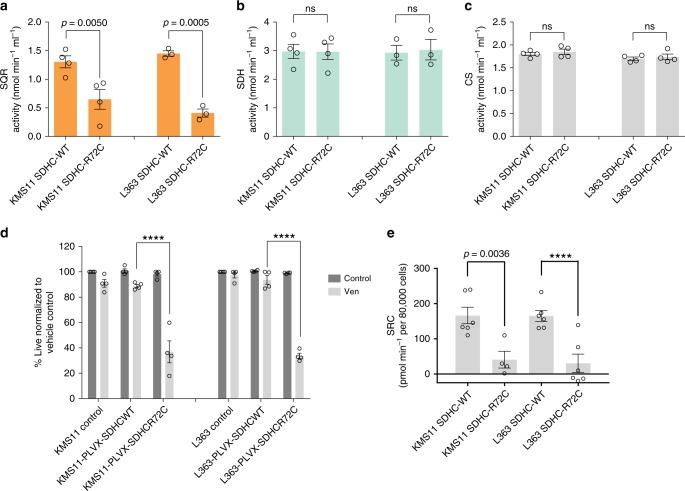
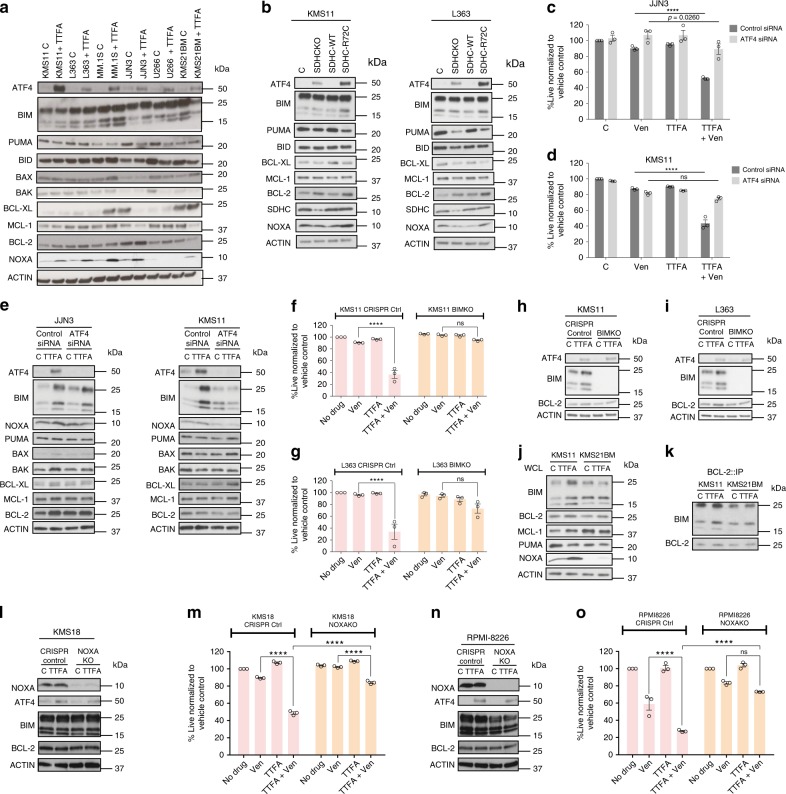
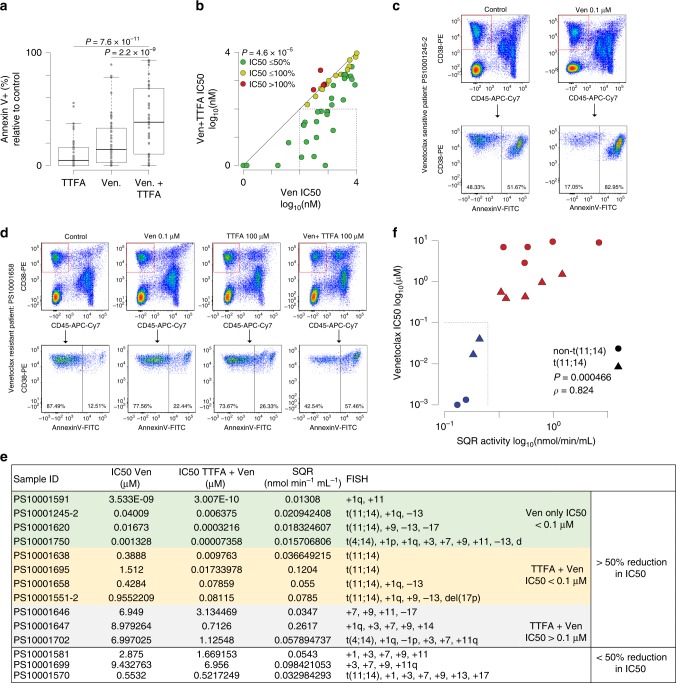
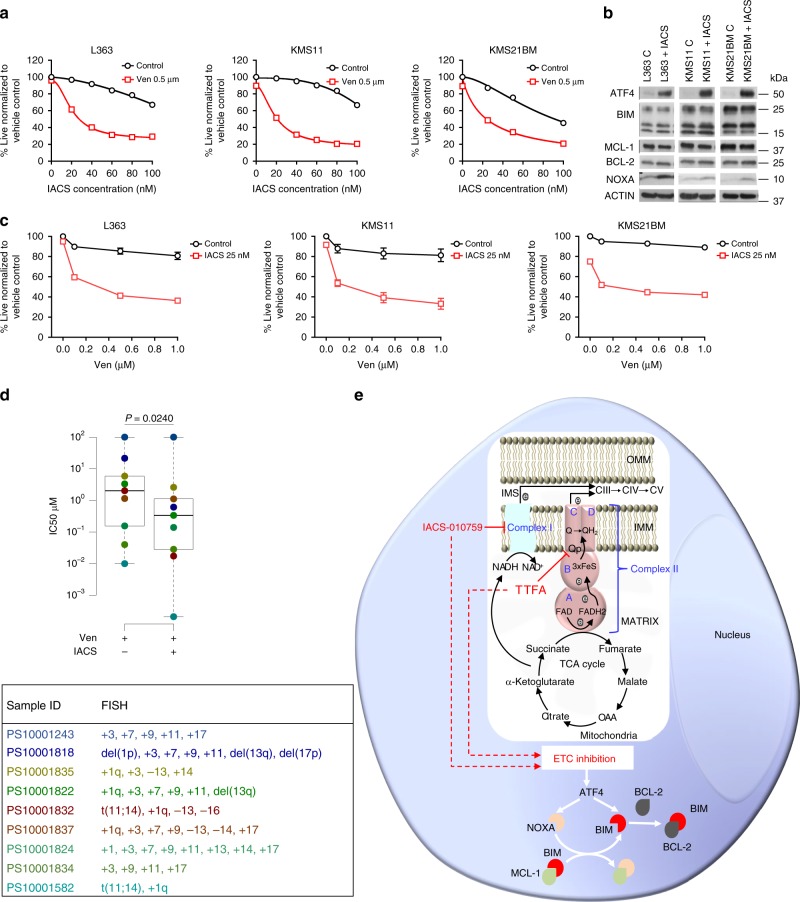
The BCL-2 antagonist venetoclax is highly effective in multiple myeloma (MM) patients exhibiting the 11;14 translocation, the mechanistic basis of which is unknown. In evaluating cellular energetics and metabolism of t(11;14) and non-t(11;14) MM, we determine that venetoclax-sensitive myeloma has reduced mitochondrial respiration. Consistent with this, low electron transport chain (ETC) Complex I and Complex II activities correlate with venetoclax sensitivity. Inhibition of Complex I, using IACS-010759, an orally bioavailable Complex I inhibitor in clinical trials, as well as succinate ubiquinone reductase (SQR) activity of Complex II, using thenoyltrifluoroacetone (TTFA) or introduction of SDHC R72C mutant, independently sensitize resistant MM to venetoclax. We demonstrate that ETC inhibition increases BCL-2 dependence and the 'primed' state via the ATF4-BIM/NOXA axis. Further, SQR activity correlates with venetoclax sensitivity in patient samples irrespective of t(11;14) status. Use of SQR activity in a functional-biomarker informed manner may better select for MM patients responsive to venetoclax therapy.


Conflict of interest statement

S.K.M. is a consultant for Agios Pharmaceuticals; L.H.B. is a consultant for Abbvie, consultant for Genentech and has research funding and is a consultant for Astra Zeneca; A.K.N. is consultant with honoraria from Janssen, GSK, Celgene, Amgen, Takeda, Spectrum, BMS, Adaptive and research funding from Janssen, GSK, Celgene, Amgen, Takeda, BMS; S.L. is a consultant and receives honoraria for Millennium, Onyx Pharmaceuticals, Novartis, BMS, Janssen, and Celgene and received honorarium from Celgene, Takeda, BMS, GSK, Novartis, Amgen, Merck, and Janssen. All other authors declare no competing interests.

Figures

Fig. 1
Fig. 1. Venetoclax-sensitive MM exhibits reduced cellular energetics in contrast to the venetoclax-resistant cells.
a MM cell lines treated ±0.5 μM venetoclax (Ven) for 24 h were assessed for cell death by AnnexinV/4′,6-diamidino-2-phenylindole (DAPI) flow cytometric staining. Percent live normalized to vehicle control, with cell lines grouped by sensitivity. n = 3 independent experiments. Data are presented as mean values ± SEM. p value is calculated using a two-tailed Mann−Whitney test. bd MM lines were evaluated for basal, coupled and maximal respiration in a mito stress assay using a Seahorse XFe96 analyzer. n = 6 replicate Seahorse wells for each cell line except JJN3 (n = 11), U266 (n = 8) and KMS21BM (n = 7). OCR displayed are normalized to live cell number. Data are presented as mean values ± SEM. Venetoclax-sensitive MM exhibited significantly lower basal, maximal and coupled OCR (p values = 0.0022) determined after the addition of oligomycin, FCCP and antimycin/rotenone. p values are calculated using a two-tailed Mann−Whitney test. e Spare respiratory capacity in venetoclax-sensitive and -resistant cells was determined by subtracting basal OCR from maximal OCR. Data are presented as mean values ± SEM. Venetoclax-resistant lines have been shown in green and venetoclax-sensitive lines have been shown in purple bars in (ae). f Heat map of electron transport chain-specific gene expression in t(11;14) vs. non-t(11;14) patients derived from the CoMMpass trial RNAseq. Statistical significance (adjusted p value < 0.01) is highlighted for gene names in bold-italic font. Source data are provided as a source data file.
Fig. 2
Fig. 2. Venetoclax-sensitive MM exhibits reduced Complex I and Complex II activity.
a Complex I activity was assessed in the indicated lines as described in Materials and Methods. b SDH activity and c SQR activity were assessed in gently permeabilized whole cells supplemented with succinate and Complex I, III and IV inhibitors. d CS activity was assessed as described in Materials and Methods. Complex I, SQR and SDH activity were significantly different in sensitive vs. resistant lines (p values 0.008, 0.0007 and 0.0007 respectively) while CS activity did not differ significantly (p value = 0.2824). n = 3 independent experiments. Data are presented as mean values ± SEM. p values are calculated using a two-tailed Mann−Whitney test. Venetoclax-resistant lines have been shown in green and venetoclax-sensitive lines have been shown in purple bars in (ad). Source data are provided as a source data file.
Fig. 3
Fig. 3. Inhibition of SQR with Qp site inhibitor TTFA effectively sensitizes resistant MM to venetoclax.
ah SQR inhibition with TTFA (100 μM) sensitizes indicated myeloma cell lines to venetoclax more effectively than inhibition of SDHA with 3-NPA (1000 μM except for RPMI-8226 treated with 250 μM) upon cotreatment with indicated doses of venetoclax for 24 h. Cell viability assessed by AnnexinV/DAPI staining. n = 3 independent experiments. Data are presented as mean values ± SEM. i SQR, j SDH and k CS activities were evaluated demonstrating selective inhibition of SQR activity upon 24 h TTFA treatment. Data are presented as mean values ± SEM. p values are calculated using a two-tailed unpaired Student’s t test. Data presented are from an n = 3 ± SEM. Source data are provided as a source data file.
Fig. 4
Fig. 4. SQR inhibition via Qp site SDHC-mutant introduction sensitizes MM to venetoclax.
a SQR, b SDH and c CS activities were determined in KMS11 and L363, SDHCKO cells expressing SDHC-WT or SDHC-R72C mutant constructs. n = 4 independent experiments except L363 SQR and SDH activity (n = 3). Data are presented as mean values ± SEM. Adjusted p values are calculated using a two-way ANOVA with post-hoc Sidak’s multiple comparisons test. d SDHC-WT and SDHC-R72C mutant-expressing cells ± 0.5 μM venetoclax (24 h) were evaluated for viability by AnnexinV/DAPI flow cytometric staining, demonstrating increased sensitivity of SDHC-R72C cells to venetoclax. n = 4 independent experiments. Adjusted p values are calculated using a two-way ANOVA with post-hoc Tukey’s multiple comparisons test. e Spare respiratory capacity determined in the indicated SDHC-WT and SDHC-R72C-mutant-expressing cells demonstrated a net reduction in SRC upon introduction of the mutant. n = 6 replicate Seahorse wells except KMS11 SDHC-R72C (n = 4). Data are presented as mean values ± SEM. Adjusted p values are calculated using a two-way ANOVA with post-hoc Sidak’s multiple comparisons test. **** denotes p value < 0.0001. Source data are provided as a source data file.
Fig. 5
Fig. 5. ATF4, BIM and NOXA regulate TTFA-induced venetoclax sensitivity in MM.
a Expression of ATF4 and the indicated pro- and antiapoptotic proteins was evaluated in whole cell lysates of the indicated lines treated with ±100 μM TTFA for 24 h with Actin as loading control. Representative blots from one of three independent experiments is presented. b Protein expression levels were evaluated in SDHC-WT or SDHC-R72C mutant-expressing cells. c, d Control siRNA or ATF4 siRNA-transfected KMS11 or JJN3 cells were treated with venetoclax (0.5 μM), TTFA (100 μM) or the combination for 24 h and cell viability assessed by AnnexinV/DAPI flow cytometric staining. n = 3 independent experiments. Data are presented as mean values ± SEM. e Cells from (c, d) were used to prepare lysates for immunoblot evaluation of indicated proteins. f, g CRISPR Cas9 generated L363 and KMS11 BIMKO (KO efficiency shown in (h) and (i)) were treated with ±TTFA (100 μM), ±venetoclax (0.5 μM) for 24 h and cell death evaluated by Annexin V/DAPI flow cytometric staining. n = 3 independent experiments. Data are presented as mean values ± SEM. j Whole-cell lysates from KMS11 and KMS21BM treated or untreated with TTFA were evaluated for expression of indicated proteins by immunoblot analysis. k Cellular lysates from panel (j) were evaluated for immunoprecipitates of BCL-2 and bound BIM by immunoblotting. Representative blots from one of the three independent experiments is presented. l, n Whole-cell lysates from RPMI-8226 and KMS18 NOXA KO cells treated or untreated with TTFA were evaluated for expression of indicated proteins by immunoblot analysis. Representative blots from one of three independent experiments is presented. m, o RPMI-8226 and KMS18 NOXA KO cells were treated with ±TTFA (100 μM), ±venetoclax (0.5 μM) for 24 h and cell death evaluated by Annexin V/DAPI flow cytometric staining. n = 3 independent experiments. Data are presented as mean values ± SEM. Adjusted p values are calculated using a two-way ANOVA with post-hoc Tukey’s multiple comparisons test. **** denotes p value < 0.0001. Source data are provided as a source data file.
Fig. 6
Fig. 6. SQR activity inversely correlates with venetoclax sensitivity in MM patient samples.
a Box plot of cell death measured by Annexin V staining relative to vehicle control in samples from 50 myeloma patient bone marrow aspirates treated with 0.1 μM venetoclax, 100 μM TTFA alone or in the combination for 24 h. CD38-PE and CD45-APC-Cy7 were used to gate myeloma cells. n = 50 biological independent samples. Boxplots show the median and quartiles with the whiskers extending to the most extreme data point within 1.5 times the interquartile range. IC50 ± TTFA was calculated as indicated in supplementary Table 1. b Scatter plot of IC50 for patient samples treated with venetoclax (Ven; x-axis) vs. those treated with Ven and 100 µM TTFA (y-axis). A diagonal line denotes one-to-one correspondence of IC50. Samples are colored by the change in IC50 relative to the Ven group (green: ≤50%; yellow: 50−100%; red >100%). The dashed box denotes patient samples with Ven IC50s > 100 nM and Ven + TTFA IC50s ≤ 100 nM. Samples with an IC50 < 1 nM are plotted at 1 nM. p values were calculated using a paired Student’s t test. c, d Flow plots of representative patient samples (exhibiting high and low SQR activity) and corresponding sensitivity of MM-gated cells to venetoclax and/or TTFA cotreatment are shown. e Ven ± TTFA IC50, SQR activity and FISH characteristics of purified CD138+ myeloma cells from 14 patient samples. Samples additionally segregated on the basis of >50% reduction in IC50. f Scatter plot of SQR activity and Venetoclax IC50 showing a positive correlation (Spearman’s rank correlation (ρ) = 0.824, n = 14, p value = 0.000466). Samples are colored by Ven IC50 (blue: ≤0.1 µM; red: >0.1 µM). Triangles denote t(11;14) samples and circles denote non-t(11;14) samples. The dashed box denotes patient samples with Ven IC50 ≤ 0.1 µM and SQR activity ≤ 0.25 nmol min−1 mL−1. Source data are provided as a source data file.
Fig. 7
Fig. 7. Inhibition of Complex I with IACS-010759 sensitizes resistant MM to venetoclax.
a Dose−response curves for cotreatment of indicated cell lines with 0.5 µM venetoclax and increasing doses of IACS-010759 for 24 h. Cell viability assessed by AnnexinV/DAPI flow cytometric staining. b Expression of ATF4 and the indicated pro- and antiapoptotic proteins were evaluated in whole-cell lysates of the indicated lines treated ±25 nM IACS-010759 for 24 h. Actin was assessed as a loading control. Representative blots from one of two independent experiments is presented. c Dose−response curves for cotreatment of 25 nM IACS-010759 with increasing doses of venetoclax. Cell viability assessed by AnnexinV/DAPI staining. n = 3 independent experiments. Data are presented as mean values ± SEM. d Box plot of IC50 values of Ven and Ven + IACS, and table with FISH characteristics of nine myeloma patient samples. n = 9 biologically independent samples. Boxplots show the median and quartiles with the whiskers extending to the most extreme data point within 1.5 times the interquartile range. PS10001243 was resistant to Ven ± IACS and has been represented to have an artificial IC50 of 100 µM for Ven ± IACS in the box plot. e Mechanistic representation of how Complex I and Complex II regulate BCL-2 dependence in an MM cell. IACS-010759 and TTFA inhibit Complex I and Complex II, respectively, resulting in ETC inhibition. ETC inhibition regulates BCL-2 dependency by inducing ATF4. ATF4 induces NOXA (light orange) that displaces BIM (red) from MCL-1 (green). The increased binding of BIM to BCL-2 (gray) elevates BCL-2 dependence leading to sensitization to venetoclax. Source data are provided as a source data file.

References

    1. Siegel RL, Miller KD, Jemal A. Cancer statistics, 2017. CA Cancer J. Clin. 2017;67:7–30. doi: 10.3322/caac.21387. - DOI - PubMed
    1. Barlogie B, et al. Curing myeloma at last: defining criteria and providing the evidence. Blood. 2014;124:3043–3051. doi: 10.1182/blood-2014-07-552059. - DOI - PMC - PubMed
    1. Danial NN, Korsmeyer SJ. Cell death: critical control points. Cell. 2004;116:205–219. doi: 10.1016/S0092-8674(04)00046-7. - DOI - PubMed
    1. Cheng EH, et al. BCL-2, BCL-X(L) sequester BH3 domain-only molecules preventing BAX- and BAK-mediated mitochondrial apoptosis. Mol. Cell. 2001;8:705–711. doi: 10.1016/S1097-2765(01)00320-3. - DOI - PubMed
    1. Ni Chonghaile T, Letai A. Mimicking the BH3 domain to kill cancer cells. Oncogene. 2008;27(Suppl 1):S149–S157. doi: 10.1038/onc.2009.52. - DOI - PMC - PubMed

Publication types

MeSH terms