. 2020 Mar 6;10(1):4271.
doi: 10.1038/s41598-020-61162-4.

Identification of the key genes and pathways involved in the tumorigenesis and prognosis of kidney renal clear cell carcinoma

Affiliations

Identification of the key genes and pathways involved in the tumorigenesis and prognosis of kidney renal clear cell carcinoma

Hao Cui et al. Sci Rep. .

Abstract

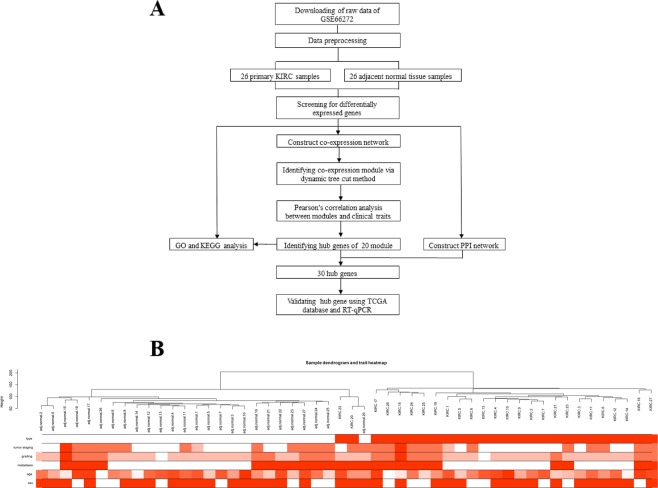
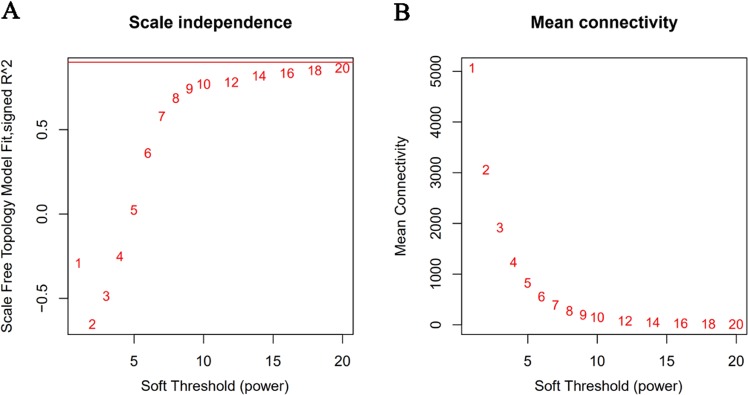
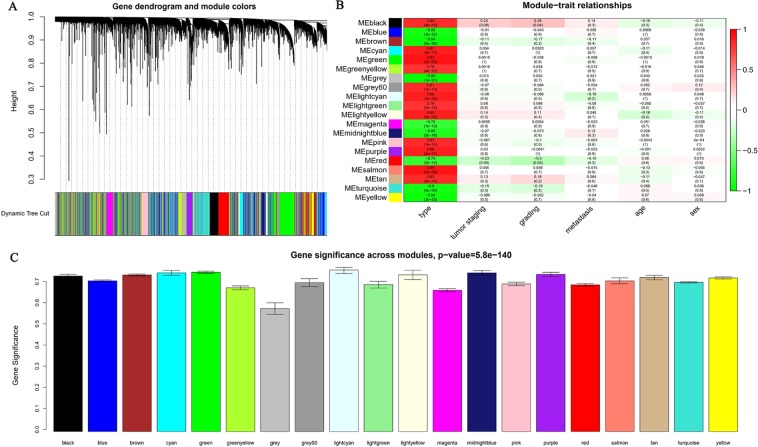
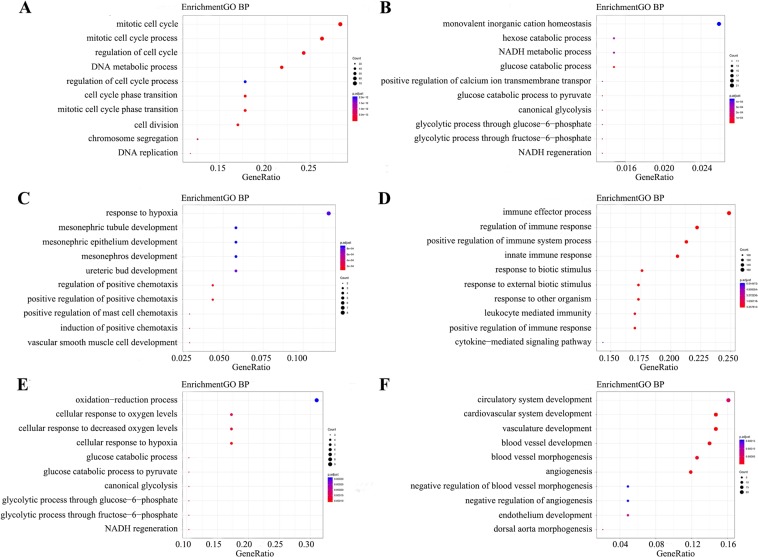
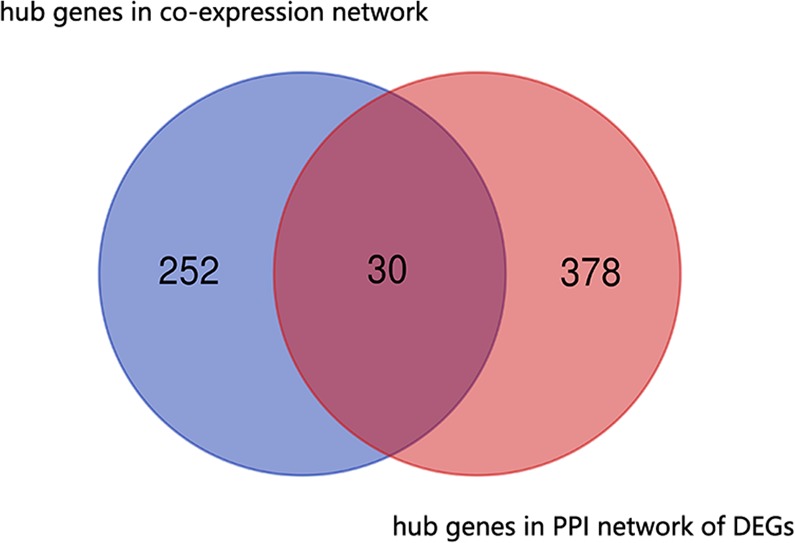
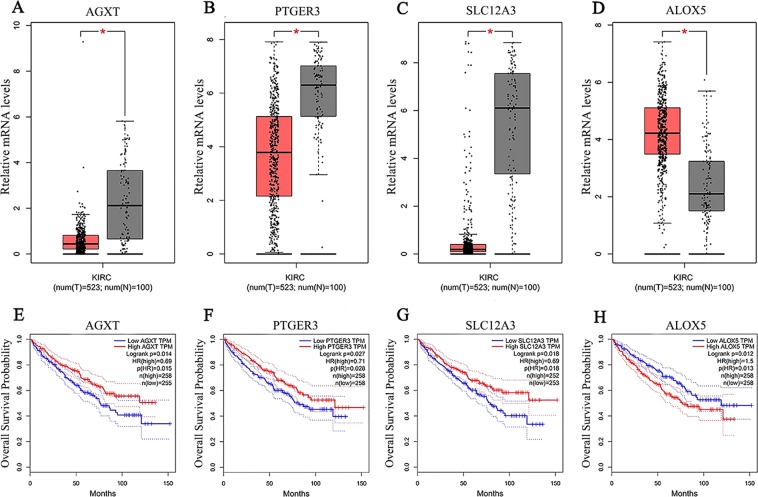
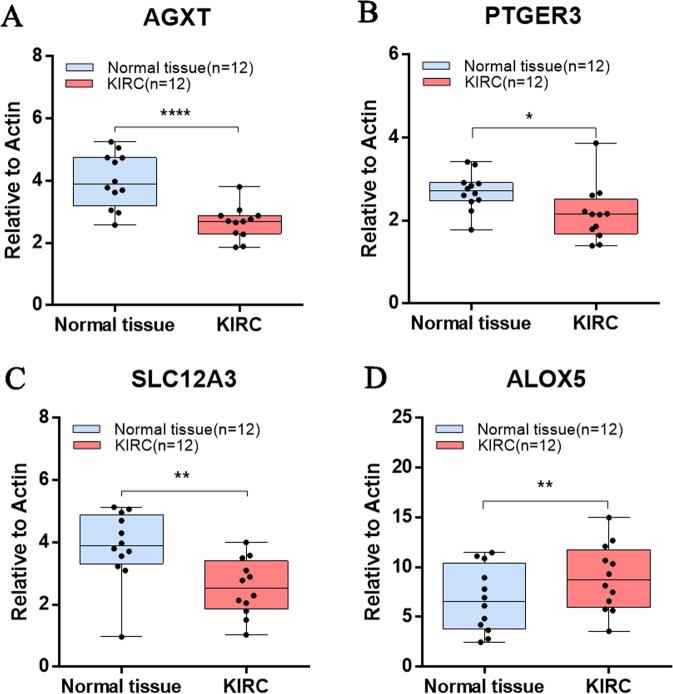
Kidney renal clear cell carcinoma (KIRC) is the most common renal cell carcinoma (RCC). However, patients with KIRC usually have poor prognosis due to limited biomarkers for early detection and prognosis prediction. In this study, we analysed key genes and pathways involved in KIRC from an array dataset including 26 tumour and 26 adjacent normal tissue samples. Weighted gene co-expression network analysis (WGCNA) was performed with the WGCNA package, and 20 modules were characterized as having the highest correlation with KIRC. The upregulated genes in the tumour samples are involved in the innate immune response, whereas the downregulated genes contribute to the cellular catabolism of glucose, amino acids and fatty acids. Furthermore, the key genes were evaluated through a protein-protein interaction (PPI) network combined with a co-expression network. The comparatively lower expression of AGXT, PTGER3 and SLC12A3 in tumours correlates with worse prognosis in KIRC patients, while higher expression of ALOX5 predicts reduced survival. Our integrated analysis illustrated the hub genes involved in KIRC tumorigenesis, shedding light on the development of prognostic markers. Further understanding of the function of the identified KIRC hub genes could provide deep insights into the molecular mechanisms of KIRC.


Conflict of interest statement

The authors declare no competing interests.

Figures

Figure 1
Figure 1
Study design and clustering dendrogram of the patient samples and clinical traits. (A) Flow diagram of the analysis procedure: data collection, preprocessing, analysis and validation. (B) Clustering was based on the expression data of the differentially expressed genes between KIRC (n = 26) and adjacent normal (n = 26) tissues. The red colour represents the tumour, metastasis and male. Colour intensity is proportional to tumour staging, grading, and age.
Figure 2
Figure 2
Determination of the soft-thresholding power (β) in weighted gene co-expression network analysis (WGCNA). (A) Analysis of the scale-free topology model fitting index (R2, y-axis). (B) Mean connectivity for various soft-thresholding powers. The red Arabic numbers in the panels denote different soft thresholds. There is a trade-off between maximizing R2 and maintaining a high mean number of connections. Thus, we set β = 20.
Figure 3
Figure 3
Identification of modules associated with the tumorigenesis of KIRC. (A) Dendrogram of all differentially expressed genes clustered based on a dissimilarity measure (1-TOM). (B) Heatmap of the correlations between the module eigengenes and clinical traits of KIRC. (C) Distribution of average gene significance and errors in the modules associated with the occurrence of KIRC.
Figure 4
Figure 4
GO enrichment analysis of the genes in modules significantly related to tumorigenesis. GO analysis was carried out on 20 identified modules, among which 6 modules with the highest correlation with tumorigenesis included (A) black module, (B) brown module, (C) cyan module, (D) green module, (E) lightyellow module, and (F) pink module. The size of the bubble indicates the enrichment score, while the colours represent enrichment significance.
Figure 5
Figure 5
KEGG pathway analysis of the genes in modules significantly related to tumorigenesis. KEGG analysis was carried out on 20 identified modules, among which 6 modules with the highest correlation with tumorigenesis included (A) black module, (B) brown module, (C) cyan module, (D) green module, (E) lightyellow module, and (F) pink module. The length of the column indicates the enrichment score, while the colours represent enrichment significance.
Figure 6
Figure 6
Common hub genes in the co-expression network and PPI network. A Venn diagram was utilized to screen the hub genes between the DEGs and WGCNA. Thirty common network genes were screened as candidates for further analysis and validation.
Figure 7
Figure 7
Hub gene validation based on TCGA data in GEPIA. (A–D) Gene expression levels between tumours and normal tissues. (A) AGXT, (B) PTGER3, (C) SLC12A3, (D) ALOX5. (E–H) Survival analysis of the relevance between the overall survival time and the relative expression levels of the hub genes in KIRC. (E) AGXT, (F) PTGER3, (G) SLC12A3, (H) ALOX5. The red line represents the samples with high gene expression, and the blue line indicates the samples with low gene expression.
Figure 8
Figure 8
Validation of the hub genes by using RT-qPCR analysis. (A) AGXT, (B) PTGER3, (C) SLC12A3, (D) ALOX5. Tumour tissue and paired normal tissue were collected from 12 KIRC patients, and a paired t test was used to evaluate the statistical significance of differences.

Similar articles

Cited by

References

    1. Rossi SH, et al. Epidemiology and screening for renal cancer. World J. Urol. 2018;36(9):1341–1353. doi: 10.1007/s00345-018-2286-7. - DOI - PMC - PubMed
    1. Sanchez DJ, Simon MC. Genetic and metabolic hallmarks of clear cell renal cell carcinoma. Biochim. Biophys. Acta Rev. Cancer. 2018;1870(1):23–31. doi: 10.1016/j.bbcan.2018.06.003. - DOI - PMC - PubMed
    1. Cairns P. Renal cell carcinoma. Cancer Biomark. 2010;9(1-6):461–73. doi: 10.3233/CBM-2011-0176. - DOI - PMC - PubMed
    1. Siska PJ, et al. Strategies to overcome therapeutic resistance in renal cell carcinoma. Urol. Oncol. 2017;35(3):102–110. doi: 10.1016/j.urolonc.2016.12.002. - DOI - PMC - PubMed
    1. Barata PC, Rini BI. Treatment of renal cell carcinoma: Current status and future directions. CA Cancer J. Clin. 2017;67(6):507–524. doi: 10.3322/caac.21411. - DOI - PubMed

Publication types

MeSH terms

Substances