. 2020 Mar 6;10(1):4189.
doi: 10.1038/s41598-020-60699-8.

The Role of Transthyretin in Oligodendrocyte Development

Affiliations

The Role of Transthyretin in Oligodendrocyte Development

Bandar Alshehri et al. Sci Rep. .

Abstract

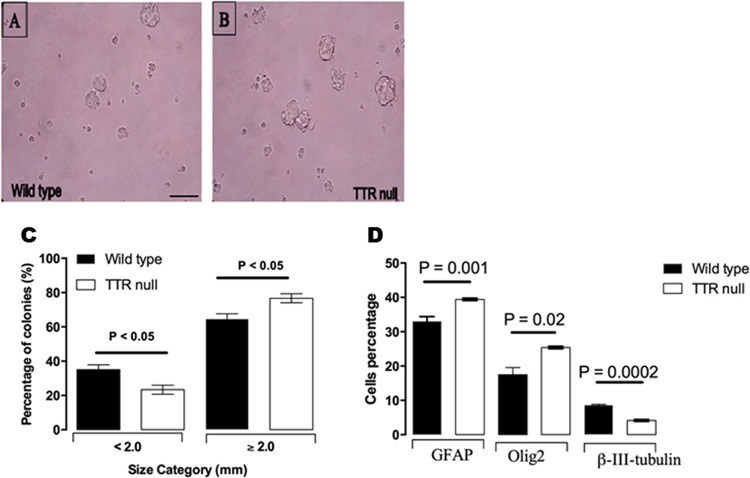
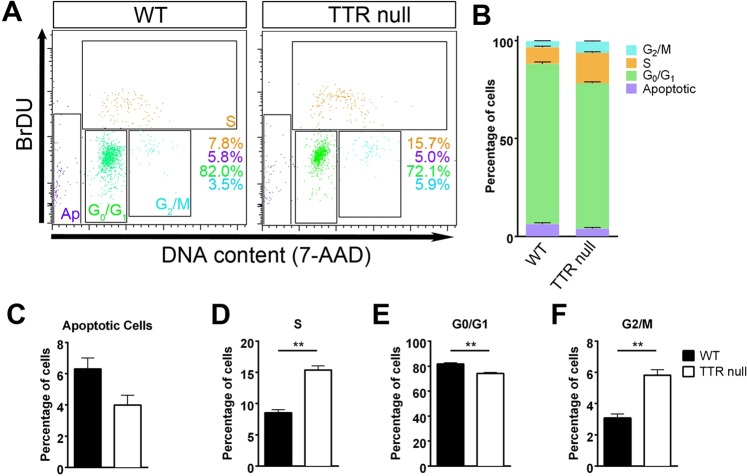
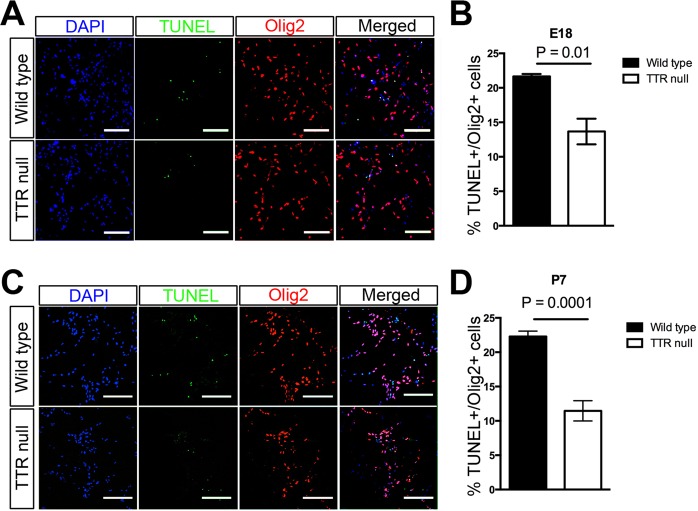
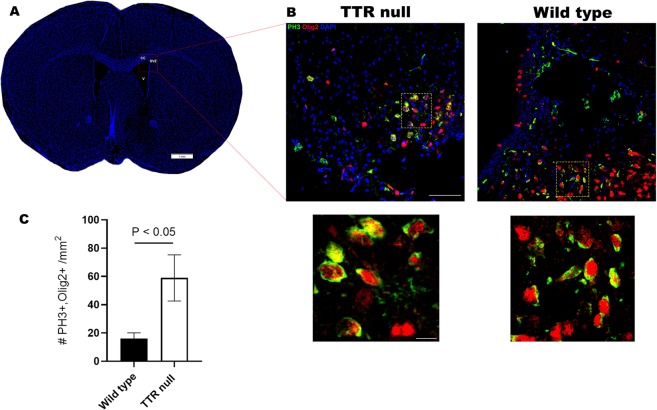
Transthyretin (TTR) is a protein that binds and distributes thyroid hormones (THs) in blood and cerebrospinal fluid. Previously, two reports identified TTR null mice as hypothyroid in the central nervous system (CNS). This prompted our investigations into developmentally regulated TH-dependent processes in brains of wildtype and TTR null mice. Despite logical expectations of a hypomyelinating phenotype in the CNS of TTR null mice, we observed a hypermyelination phenotype, synchronous with an increase in the density of oligodendrocytes in the corpus callosum and anterior commissure of TTR null mice during postnatal development. Furthermore, absence of TTR enhanced proliferation and migration of OPCs with decreased apoptosis. Neural stem cells (NSCs) isolated from the subventricular zone of TTR null mice at P21 revealed that the absence of TTR promoted NSC differentiation toward a glial lineage. Importantly, we identified TTR synthesis in OPCs, suggestive of an alternate biological function in these cells that may extend beyond an extracellular TH-distributor protein. The hypermyelination mechanism may involve increased pAKT (involved in oligodendrocyte maturation) in TTR null mice. Elucidating the regulatory role of TTR in NSC and OPC biology could lead to potential therapeutic strategies for the treatment of acquired demyelinating diseases.


Conflict of interest statement

The authors declare no competing interests.

Figures

Figure 1
Figure 1
TTR null mice have a hypermyelination phenotype. (A) Comparison of the size of the myelinated area of the corpus callosum between wild type and TTR null mice. Coronal brain sections of 10 µm thickness corresponding to the area between 0.6 and 1.3 bregma were analysed for mice aged P7, P14, P21 and 12 weeks for myelin staining using LFB. Myelin was not detected in the corpus callosum of P7 or P14 mice. However, at P21 the entire corpus callosum was clearly stained (myelinated) in TTR null mice, but not in wild type mice. For 12-week-old mice, LFB stained the entire corpus callosum in both wild type and TTR null mice (scale bar 2 mm). (B) Comparison of brain weights between TTR null and wild type mice. The brain weights of TTR null mice at ages P7, P14, and 12 weeks were heavier than age-matched wild type mice (but not significantly different for P21 mice). All data were expressed as the mean ± SEM. Statistical comparisons were performed using a one-way ANOVA with post hoc analysis using Sidak’s test as appropriate (n = 6 mice per group were assessed and P < 0.05 was considered statistically significant). (C) Graphical summary of the comparison of the size of the myelinated area of the corpus callosum between P21 and 12-week-old wild type and TTR null mice using LFB. All data were expressed as the mean ± SEM. Statistical comparisons were performed using a one-way ANOVA with post hoc analysis using Sidak’s test as appropriate (n = 5 mice per group were assessed and P < 0.05 was considered statistically significant). (D) Detection of myelin within the corpus callosum at P7 and P14 for wild type and TTR null mice by MBP immunostaining. Coronal brain sections of 10 µm thickness, corresponding to the area between 0.6 and 1.3 bregma for wild type and TTR null mouse corpus callosum were stained with a polyclonal anti-MBP antibody. MBP was not detected in P7 mice. P14 mice revealed MBP-immunoreactive myelinated fibres (red arrows) in the corpus callosum indicating that myelination had begun in earnest in the TTR null mice (scale bar 200 µm). (E) Quantification of the MBP positive area per 0.3 mm2 for P14 mice. All data were expressed as the mean ± SEM. Statistical comparisons were performed using a Student’s t-test (n = 3 mice were analyzed at this time point and P < 0.05 was considered statistically significant). (F) Representative EM images of the corpus callosum from P7, P14, P21 and 12 weeks-of-age respectively, for both wild type and TTR null mice. As expected, myelin cannot be detected in either genotype at P7. However, from P14 to 12 weeks-of-age, myelin thickness is visibly increased in TTR null compared to wild type mice. (G) Measurement of myelin thickness and calculation of g ratios in P14 wild type and TTR null mice (n = 3 mice per genotype, G- ratios were calculated from 100 axons per mouse. Graphical illustration of the relationship between g ratio of individual axons and axon diameter, with regression lines for P14 wild type and TTR null mice. (H) Histogram of g ratio comparison between P14 TTR null and wild type mice. All data were expressed as the mean ± SEM. Statistical comparisons were performed using a Student’s t-test (P < 0.05 was considered statistically significant). (I) Measurement of myelin thickness and calculation of g ratios in P21 wild type and TTR null mice (n = 3 mice per genotype, g ratios were calculated from 100 axons per mouse). Graphical illustration of the relationship between g ratio of individual axons and axon diameter, with regression lines for P21 wild type and TTR null mice. (J) Summary histogram of the g ratio comparison between P21 TTR null and wild type mice. All data were expressed as the mean ± SEM. Statistical comparisons were performed using a Student’s t-test (P < 0.05 was considered statistically significant). (K) Measurement of myelin thickness and calculation of g ratios in 12-week-old wild type and TTR null mice. n = 3 mice per genotype. g ratios were calculated from 100 axons per mouse. Graphical illustration of the relationship between g ratios of individual axons and axon diameter, with regression lines for 12-week-old wild type and TTR null mice. (L) Summary histogram of the g ratio comparison between 12-week-old wild type and TTR null mice. All data were expressed as the mean ± SEM. Statistical comparisons were performed using a Student’s t-test (P < 0.05 was considered statistically significant).
Figure 2
Figure 2
TTR null mice have increased numbers of mature CC1-positive oligodendrocytes in the corpus callosum during early stages of postnatal development. (A) Measured area outlining the corpus callosum used in cell density analyses of Olig2, CC1 and DAPI positive cells from wild type and TTR null mice (scale bar 1 mm). (B) Images of coronal brain sections (10 µm) between 0.6 to 1.3 bregma representing cells stained for CC1 and DAPI in wild type and TTR null mice from ages P7, P14, P21 and 12 weeks (scale bar 200 µm). (C) Images of coronal brain sections (10 µm) between 0.6 to 1.3 bregma representing cells stained for CC1 and Olig2 in wild type and TTR null mice from ages P7, P14, P21 and 12 weeks (scale bar 200 µm). (D) A semi-quantitative analysis of CC1/Olig2 positive cells counted per mm2 throughout the corpus callosum of wild type and TTR null mice at ages P7, P14, P21 and 12 weeks. Data were expressed as the mean ± SEM. Age groups of mouse genotypes (n = 6 per group) were compared using an unpaired Student’s t-test (P < 0.05 was considered statistically significant).
Figure 3
Figure 3
TTR influences OPC differentiation. Representative images of neurospheres in 3D culture, isolated from SVZ derived NSCs of P21 (A) wild type and (B) TTR null mice. Scale bar 5 mm. (C) Quantitation of the potency of the NSC colonies isolated from the SVZ of P21 mice by neural colony-forming cell assays. There was a significant increase in the number of colonies with an average diameter ≥ 2 mm that were isolated from the SVZ of P21 TTR null mice when compared with wild type at the same age. Increases corresponded with a significant decrease in the number of colonies with an average diameter < 2 mm that were isolated from TTR null mouse SVZ compared to wild type. The colonies ≥ 2 mm in diameter are “NSC derived” and have self-renewal and multi-potential capabilities. Colonies < 2 mm diameter are “progenitor derived”. All data were expressed as the mean ± SEM. Statistical comparisons were performed using a one-way ANOVA with post hoc analysis using Sidak’s test as appropriate (data derived from n = 4 independent experiments per genotype and P < 0.05 was considered statistically significant). (D) Characterization of NSCs isolated from the SVZ of P21 TTR null mice and differentiated into the three neural lineages: oligodendrocytes, astrocytes and neurons. Nuclei were stained with DAPI; oligodendrocytes were stained with anti-Olig2; neurons were stained with anti-β-III-tubulin; astrocytes were stained with anti-GFAP. Lack of TTR promotes NSCs to differentiate into glial precursor cells. Differentiation assay for NSCs isolated from the SVZ of P21 TTR null mice showed a greater proportion of cells differentiating into a glial lineage, whereas the equivalent cells from wild type mice had a greater proportion differentiating into a neuronal lineage. All data were expressed as the mean ± SEM. Statistical comparisons were performed using a one-way ANOVA with post hoc analysis using Sidak’s test as appropriate (n = 3 independent experiments and P < 0.05 was considered statistically significant). (Modified from).
Figure 4
Figure 4
TTR alters the cell cycle of OPCs. (A) Absence of TTR enhances proliferation of OPCs isolated from the cerebral cortices of E18 TTR null mice. Upper panel: wild type mice; lower panel: TTR null mice. Nuclei were stained with DAPI; OPCs were stained with polyclonal anti-Ki67 (proliferation marker; green) and monoclonal anti-Olig2 (OPC marker; red) (scale bar 100 µm). (B) Semi-quantitative analysis of cells double labeled for Ki67 and Olig2 from cerebral cortices of E18 wild type and TTR null mice. There was a significant increase in the number of proliferating Olig2 positive cells isolated from TTR null mice compared wild type mice. All data were expressed as the mean ± SEM. Statistical comparisons were performed using Student’s t-test (n = 4 were mice per genotype and P < 0.05 was considered statistically significant). (C) Absence of TTR enhances proliferation of OPCs isolated from cortices of P7 TTR null mice. Upper panel: wild type mice; lower panel: TTR null mice. Nuclei were stained with DAPI; polyclonal Ki67 antibody (green); anti-Olig2 monoclonal antibody (red) (scale bar 100 µm). (D) Semi-quantitative analysis of cells double labeled for Ki67 and Olig2 from the cerebral cortices of P7 wild type and TTR null mice. There was a significant increase in the number of proliferating Olig2 positive cells isolated from TTR null mice compared to wild type mice. Data were expressed as the mean ± SEM. Statistical comparisons were performed using Student’s t-test (n = 4 mice per genotype and P < 0.05 was considered statistically significant).
Figure 5
Figure 5
Increased numbers of proliferating OPCs isolated from cortices of P7 TTR null compared to P7 wild type mice. (A–F) Flow cytometric analyses of BrdU-mediated cell cycle for OPCs isolated from P7 TTR null and wild type (WT) mice. (A) Representative dot plots following BrdU incorporation (Ap: apoptotic cells). (B) Percentage of OPCs in each stage of the cell cycle. (C) There was no significant difference in the number of apoptotic cells in OPCs from TTR null versus wild type mice (P = 0.0711). (D) There was a major increase in the population of OPCs in the S phase from TTR null mice (15%) compared to wild type mice (7%) (P = 0.0011). (E) There was a significant decrease in the population of OPCs cells in G0/G1 phase for OPCs isolated from cortices of TTR null mice (77%) versus wild type mice (84%) (P = 0.0031). (F) There was a substantial increase in the population of OPCs in G2/M phase in TTR null OPCs (6%) versus 4% in wild type mouse OPCs (P = 0.0034). All data were expressed as the mean ± SEM. Statistical comparisons were performed using Student’s t-test (n = 3, **P < 0.01, P < 0.05 was considered statistically significant).
Figure 6
Figure 6
Absence of TTR increases the migration of OPCs isolated from the cerebral cortices of E18 and P7 mice. (A) The migratory rates of TTR null OPCs compared to wild type OPCs were analyzed using the modified Boyden chamber assay (migration assay). Representative photomicrograph high power fields (HPF = 0.3 mm2) (400X) of migrated OPCs isolated from cortices of E18 and P7 wild type and TTR null mice were stained with crystal violet. (B) Data were analyzed from 3 independent experiments for the E18 group and 5 independent experiments for the P7 group. All data were expressed as the mean ± SEM. Statistical comparisons were performed using a one-way ANOVA with post hoc analysis using Sidak’s test as appropriate (P < 0.05 was considered statistically significant).
Figure 7
Figure 7
Absence of TTR decreases the rate of apoptosis of OPCs isolated from cerebral cortices of E18 and P7 mice. (A) OPCs were isolated from cerebral cortices of E18 TTR null mice. Apoptotic cells were detected via TUNEL (green) staining and oligodendroglial cells were identified by IHC staining for Olig2 (red). Nuclei were stained with DAPI (blue) (scale bar 100 µm). (B) Semi-quantitative analysis of OPCs isolated from cortices of E18 wild type and TTR null mice double labeled for TUNEL and Olig2. There was a significant decrease in the number of double-labeled Olig2+ and TUNEL+ OPCs isolated from cortices of E18 TTR null mice compared to those from wild type mice. Data were expressed as the mean ± SEM. Statistical comparisons were performed using Student’s t-test (n = 4 mice per genotype and P < 0.05 was considered statistically significant). (C) OPCs were isolated from cerebral cortices of P7 mice. Apoptotic cells were detected via TUNEL (green) staining and oligodendroglial cells were identified by IHC staining for Olig2 (red). Nuclei were stained with DAPI (blue) (scale bar 100 µm). (D) Semi-quantitative analysis of OPCs isolated from cortices of P7 wild type and TTR null mice double labeled for TUNEL and Olig2. There was a significant decrease in the number of double-labeled Olig2+ and TUNEL+ OPCs isolated from cortices of P7 TTR null mice compared to those from wild type mice. All data were expressed as the mean ± SEM. Statistical comparisons were performed using Student’s t-test (n = 5 mice per genotype and P < 0.05 was considered statistically significant).
Figure 8
Figure 8
Optic nerves of adult TTR null mice display higher concentrations of phosphorylated AKT compared to wild type mice. (A) Western blot analysis of total protein lysate (5 µg) from optic nerves of wild type and TTR null mice (n = 18–20 optic nerves from 9–10 mice per genotype), identifying bands of corresponding molecular weights for proteins: pAKT, AKT, pERK1, pERK2, ERK1, ERK2, β-actin and TTR. (B) Densitometric analysis of immunoblots (n = 3) comparing wild type and TTR null mice displayed as a phosphorylated to non-phosphorylated protein ratio for AKT and ERK1, ERK2, normalised against β-actin. (C) Densitometric analysis of immunoblots (n = 3) from comparing the fold change of TTR null to wild type mice of phosphorylated to non-phosphorylated AKT, ERK1 and ERK2. (D) Immunoprecipitation and Western blotting of AKT, ERK1 and ERK2 from total protein lysates (100 µg) (n = 18–20 optic nerves from 9–10 mice per genotype). (E) Densitometric analysis of immunoblots (n = 3) following immunoprecipitation of anti-AKT, anti-ERK1 and anti-ERK2 directly comparing wild type and TTR null mice displayed as a phosphorylated to non-phosphorylated protein ratio, normalised against β-actin. (F) Densitometric analysis of immunoblots (n = 3) following immunoprecipitation comparing the fold change of TTR null to wild type mice of phosphorylated to non-phosphorylated AKT, ERK1 and ERK2. (G) Regions of the lateral corpus callosum in wild type and TTR null mice at ages P21 selected for image analysis to identify localisation of pAKT in mature oligodendrocytes (10 µm formalin fixed paraffin embedded sections, scale bar 1 mm). (H) Immunofluorescent images obtained from the lateral corpus callosum of P21 wild type null mice displaying colocalisation of pAKT around the nuclei of Sox10- CC1-positive oligodendrocytes (yellow arrows). Panels top to bottom: DAPI, CC1, Sox10, pAKT merge; DAPI, pAKT; Sox10, pAKT; CC1, pAKT (scale bar 50 µm). (I) Immunofluorescent images obtained from the lateral corpus callosum of P21 TTR null mice displaying increased colocalisation of pAKT around the nuclei of Sox10- CC1-positive oligodendrocytes (yellow arrows). Panels top to bottom: DAPI, CC1, Sox10, pAKT merge; DAPI, pAKT; Sox10, pAKT; CC1, pAKT (scale bar 50 µm).
Figure 9
Figure 9
TTR reduces proliferation and migration of OPCs in vivo. (A) Coronal section mouse brain labelled for DAPI-positive nuclei indicating boxed area of interest within the corpus callosum (CC) and subventricular zone (SVZ) where representative images were taken and cell densities calculated for semi-quantitative analyses of Olig2- and PH3-positive cells, from wild type and TTR null mice, respectively (scale bar 1 mm). (B) Representative confocal images of coronal brain cryosections (12 µm) between bregma 0.6 to 1.3 representing cells stained for Olig2 (red), PH3 (green) and DAPI (blue) in P4 TTR null (left) and wild type mice (right) (scale bar 50 µm). Region of individual cells magnified (yellow box) and illustrated below (scale bar 5 µm). (C) A semi-quantitative cell density analysis of double positive PH3/Olig2 cells counted per mm2 from P4 wild type and TTR null mice. Data were expressed as the mean ± SEM (n = 5–6 per genotype). Mouse genotypes were compared using an unpaired Student’s t-test (P < 0.05 was considered statistically significant).

References

    1. Blake CC, Geisow MJ, Swan ID, Rerat C, Rerat B. Strjcture of human plasma prealbumin at 2-5 A resolution. A preliminary report on the polypeptide chain conformation, quaternary structure and thyroxine binding. Journal of Molecular Biology. 1974;88:1–12. doi: 10.1016/0022-2836(74)90291-5. - DOI - PubMed
    1. Soprano DR, Herbert J, Soprano KJ, Schon EA, Goodman DS. Demonstration of transthyretin mRNA in the brain and other extrahepatic tissues in the rat. Journal of Biological Chemistry. 1985;260:11793–11798. - PubMed
    1. Dickson PW, et al. High Prealbumin and Transferrin Messenger RNA Levels in the Choroid Plexus of Rat Brain. Biochem. Biophys. Res. Commun. 1985;127:890–895. doi: 10.1016/S0006-291X(85)80027-9. - DOI - PubMed
    1. Stauder AJ, et al. Synthesis of transthyretin (pre-albumin) mRNA in choroid plexus epithelial cells, localized by in situ hybridization in rat brain. Journal of Histochemistry & Cytochemistry. 1986;34:949–952. doi: 10.1177/34.7.3458812. - DOI - PubMed
    1. Harms PJ, et al. Transthyretin (prealbumin) gene expression in choroid plexus is strongly conserved during evolution of vertebrates. Comparative Biochemistry &. Physiology - B: Comparative Biochemistry. 1991;99:239–249. - PubMed

Publication types

MeSH terms