. 2020 Mar 6;10(1):4180.
doi: 10.1038/s41598-020-61017-y.

Transcriptomic and computational analysis identified LPA metabolism, KLHL14 and KCNE3 as novel regulators of Epithelial-Mesenchymal Transition

Affiliations

Transcriptomic and computational analysis identified LPA metabolism, KLHL14 and KCNE3 as novel regulators of Epithelial-Mesenchymal Transition

V Di Lollo et al. Sci Rep. .

Abstract

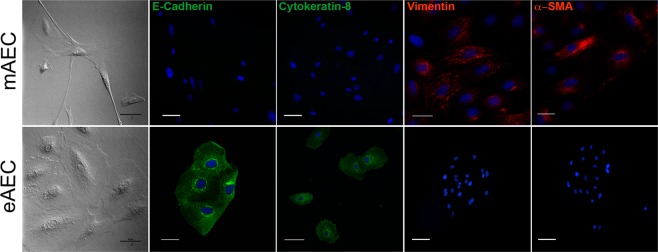
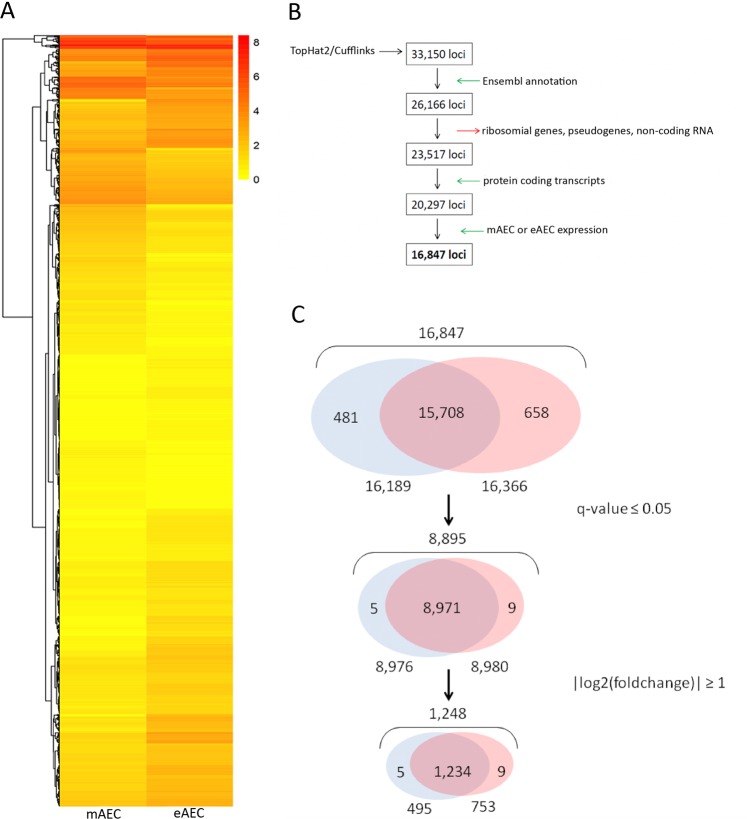
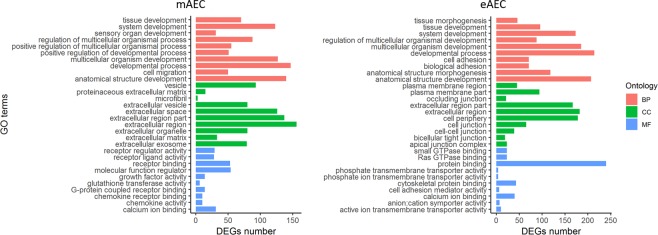
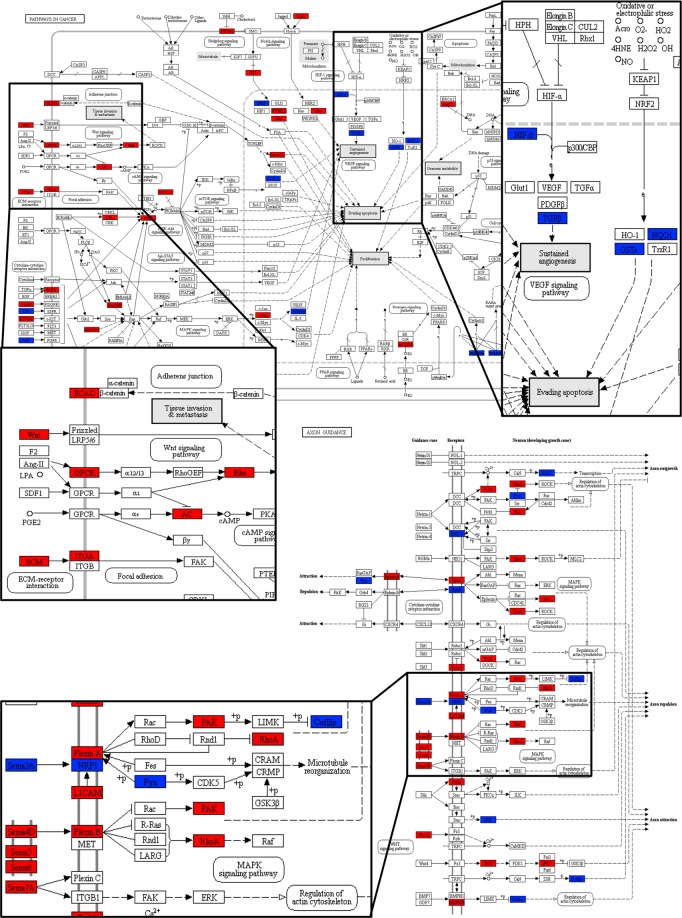
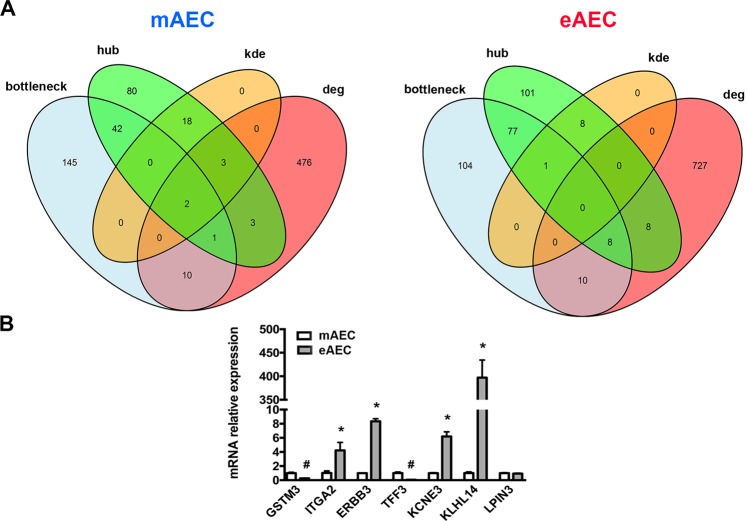
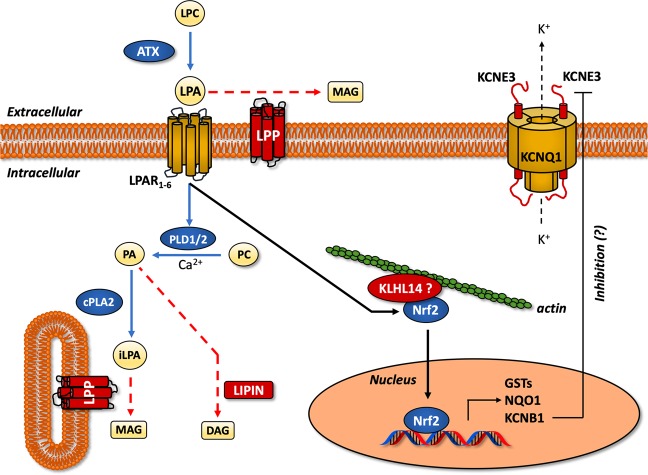
Epithelial-mesenchymal transition (EMT) is a complex biological program between physiology and pathology. Here, amniotic epithelial cells (AEC) were used as in vitro model of transiently inducible EMT in order to evaluate the transcriptional insights underlying this process. Therefore, RNA-seq was used to identify the differentially expressed genes and enrichment analyses were carried out to assess the intracellular pathways involved. As a result, molecules exclusively expressed in AEC that experienced EMT (GSTA1-1 and GSTM3) or when this process is inhibited (KLHL14 and KCNE3) were identified. Lastly, the network theory was used to obtain a computational model able to recognize putative controller genes involved in the induction and in the prevention of EMT. The results suggested an opposite role of lysophosphatidic acid (LPA) synthesis and degradation enzymes in the regulation of EMT process. In conclusion, these molecules may represent novel EMT regulators and also targets for developing new therapeutic strategies.


Conflict of interest statement

The authors declare no competing interests.

Figures

Figure 1
Figure 1
mAEC and eAEC phenotype examples after three passage of in vitro amplification. Upper box. AEC cultured using validated amplification protocol (mAEC) showed a fibroblastic-like, elongated morphology, high positivity for mesenchymal markers such as Vimentin and α-SMA and a low expression of epithelial markers. Scale Bar: 50 µm. Bottom box. eAEC cells preserved the native epithelial phenotype and the high expression of epithelial markers. Scale Bar: 50 µm. Conversely, Vimentin and α-SMA showed a rare or absent expression. Scale Bar: 25 µm.
Figure 2
Figure 2
Bioinformatics steps. (A) Heatmap analysis shows differences in gene expression between the mAEC and eAEC. Each column represents a cell population and each row represents a gene. The expression levels, based on FPKM expression values, are visualized using a gradient color scheme. (B) The flowchart summarizes the procedure performed to identify the study dataset (16,847 loci) using TopHat2/Cufflinks pipeline (detailed information on filtering procedure can be found in Supplementary File S1). The boxes represent the subsequent output data returned from individual filtering steps (green and red arrows) starting from RNA-seq raw data (33,150 loci). (C) The Venn diagrams show the characteristic DEGs number identified in both AEC populations after q-value ≤ 0.05 and |log2(foldchange)| ≥ 1 filtering steps. The figure not only displays the number of overlapped genes between the two cell populations but highlights the genes expressed exclusively in one of them.
Figure 3
Figure 3
GO enrichment analysis. Representative scheme of the top 10 most abundant GO terms identified for the mAEC and eAEC in the three GO category: Biological Process (red), Cellular component (green), and Molecular Function (blue). The x-axis indicates the number of genes in a specific category while the y-axis indicates different GO terms.
Figure 4
Figure 4
KEGG maps analysis. The figure displays two examples of differentially regulated KEGG Pathways: Pathway in cancer (upper map) and Axon Guidance (lower map). The differentially expressed genes (DEGs) are mapped in blue for mAEC and in red for eAEC cells.
Figure 5
Figure 5
Gene-gene interaction network analysis. The mAEC (A) and the eAEC (B) networks were displayed using the Cytoscape Prefuse Force Directed Layout. In the figure the size of nodes is directly proportional to the node degree and the gradual color change reflects different clustering coefficient values.
Figure 6
Figure 6
Sub-networks analyses. (A) Venn diagram analysis of overlapping genes in mAEC and eAEC. (B) Real-Time qPCR validation of most representative genes. Results are the mean ± SEM, from n = 3 independent experiments performed in triplicate. #represents a significative reduction in eAEC, with p < 0.001; *represents a significative increase in eAEC, with p < 0.001.
Figure 7
Figure 7
LPA metabolism, KLHL and KCNE3 as novel EMT controller genes. Schematic pathway representation of controller genes involved in the induction (blue) and in the inhibition (red) of EMT in AEC cell model. Moreover, biosynthetic (blue arrows) and degradative (red arrows) LPA pathways are showed. KLHL14 is hypothetically represented in a complex with Nfr2, as its homologous protein KLHL19. LPC, lysophosphatidilcoline; LPA, lysophosphatidic acid; iLPA, intracellular LPA; ATX, autotaxin; LPAR, LPA receptor; LPP, lipid phosphate phosphatases; PDL, phospholipase D; PLA2, phospholipase A2; PC, phosphatidylcholine; PA, phosphatidic acid; MAG, monoacylglycerol; DAG, diacylglycerol; KLHL14, kelch-like protein 14; Nrf2, nuclear factor erythroid 2-related factor 2; GST, Glutathione S-transferase; NQO1, NAD(P)H:quinone oxidoreductase. See the text for more details.

Similar articles

Cited by

References

    1. Lu W, Kang Y. Epithelial-Mesenchymal Plasticity in Cancer Progression and Metastasis. Dev. Cell. 2019;49:361–374. doi: 10.1016/j.devcel.2019.04.010. - DOI - PMC - PubMed
    1. Lee K, Nelson CM. New insights into the regulation of epithelial-mesenchymal transition and tissue fibrosis. Int. Rev. Cell Mol. Biol. 2012;294:171–221. doi: 10.1016/B978-0-12-394305-7.00004-5. - DOI - PubMed
    1. Derynck R, Weinberg RA. EMT and Cancer: More Than Meets the Eye. Dev. Cell. 2019;49:313–316. doi: 10.1016/j.devcel.2019.04.026. - DOI - PMC - PubMed
    1. Morandi A, Taddei ML, Chiarugi P, Giannoni E. Targeting the Metabolic Reprogramming That Controls Epithelial-to-Mesenchymal Transition in Aggressive Tumors. Front. Oncol. 2017;7:40. doi: 10.3389/fonc.2017.00040. - DOI - PMC - PubMed
    1. Liao TT, Yang MH. Revisiting epithelial-mesenchymal transition in cancer metastasis: the connection between epithelial plasticity and stemness. Mol. Oncol. 2017;11:792–804. doi: 10.1002/1878-0261.12096. - DOI - PMC - PubMed

MeSH terms