. 2020 Mar 6;10(1):4203.
doi: 10.1038/s41598-020-61082-3.

A high-throughput screening platform for Polycystic Kidney Disease (PKD) drug repurposing utilizing murine and human ADPKD cells

Affiliations

A high-throughput screening platform for Polycystic Kidney Disease (PKD) drug repurposing utilizing murine and human ADPKD cells

Rosita R Asawa et al. Sci Rep. .

Erratum in

Abstract

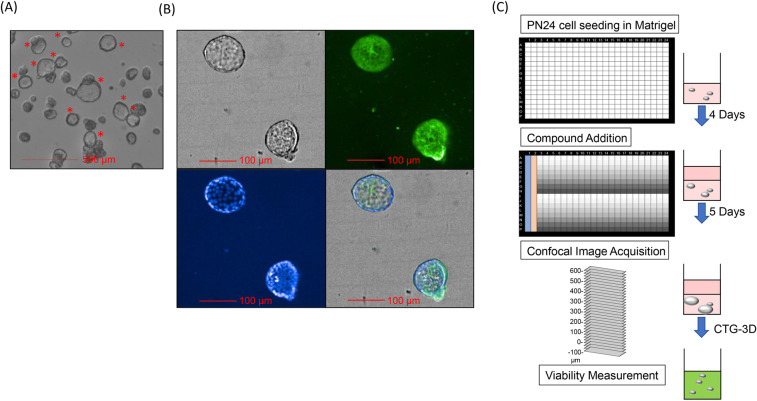
Autosomal dominant polycystic kidney disease (ADPKD) is one of the most common inherited monogenic disorders, characterized by a progressive decline in kidney function due in part to the formation of fluid-filled cysts. While there is one FDA-approved therapy, it is associated with potential adverse effects, and all other clinical interventions are largely supportive. Insights into the cellular pathways underlying ADPKD have revealed striking similarities to cancer. Moreover, several drugs originally developed for cancer have shown to ameliorate cyst formation and disease progression in animal models of ADPKD. These observations prompted us to develop a high-throughput screening platform of cancer drugs in a quest to repurpose them for ADPKD. We screened ~8,000 compounds, including compounds with oncological annotations, as well as FDA-approved drugs, and identified 155 that reduced the viability of Pkd1-null mouse kidney cells with minimal effects on wild-type cells. We found that 109 of these compounds also reduced in vitro cyst growth of Pkd1-null cells cultured in a 3D matrix. Moreover, the result of the cyst assay identified therapeutically relevant compounds, including agents that interfere with tubulin dynamics and reduced cyst growth without affecting cell viability. Because it is known that several ADPKD therapies with promising outcomes in animal models failed to be translated to human disease, our platform also incorporated the evaluation of compounds in a panel of primary ADPKD and normal human kidney (NHK) epithelial cells. Although we observed differences in compound response amongst ADPKD and NHK cell preparation, we identified 18 compounds that preferentially affected the viability of most ADPKD cells with minimal effects on NHK cells. Our study identifies attractive candidates for future efficacy studies in advanced pre-clinical models of ADPKD.


Conflict of interest statement

The authors declare no competing interests.

Figures

Figure 1
Figure 1
Cell viability outcome of reference set compounds. (A) Differential response between Pkd1-null and wt cells is shown as difference in area under the curve (ΔAUC) for mouse embryonic (E) and postnatal (P) kidney cell pairs. Pink: differential response between Pkd1-null vs. wt; yellow: no difference between Pkd1-null vs. wt/no response. (B) PAK-4 inhibitor KPT-9274 reduces the viability of Pkd1-null cells. Dose response curves of KPT-9274 treated postnatal (top) and MEK (bottom) Pkd1-null (black) and wt (red) cell pairs. Responses obtained with the GF-AFC and CTG reagents are shown on the left and right, respectively. Data is represented as Mean ± SD, n = 3. Unpaired, parametric (mean AUC) T-test (Welch’s correction) *p-val < 0.05; **p-val < 0.001; ***p-val < 0.0001.
Figure 2
Figure 2
qHTS identifies multiple compounds with differential viability effects in Pkd1-null vs. wt cells. (A) Venn diagram shows the number of unique compounds with differential viability effects identified in each cell pair and each readout. E-embryonic and P-postnatal kidney cells. (B) Examples of compounds showing differential effects in only embryonic (Geliomycin, top left), only postnatal (Gemcitabine, top right) or in both cell models (AHPN, bottom). Data is represented as Mean ± SD, n = 3. Unpaired, parametric (mean AUC) T-test (Welch’s correction) *p-val < 0.05; **p-val < 0.001; ***p-val < 0.0001. (C) Target-based analysis of compounds with differential activity in Pkd1-null vs. wt cells. Asterisks indicate statistically significant enrichment of target classes. Only target classes containing two or more compounds are shown. Note that for Antimetabolites enrichment analysis is not possible due to lack of library annotation for this category. (D) Primary Indication of compounds with differential activity in Pkd1-null vs. wt cells.
Figure 3
Figure 3
A high-throughput 3D cyst growth assay. (A) Bright-field image (representative Z-plane) at 5X magnification of PN24 cysts grown in 40% Matrigel for 9 days. Red asterisks show examples of swelled cysts with a visible lumen. (B) Cysts were stained with WGA-Alexa-488 (green; top right) and Hoeschst (blue; bottom left) and imaged at 20X magnification (representative Z-plane is shown). Bright-field (top left) and merged images (bottom right) are also shown. (C) Schematic representation of the 384-well 3D cyst assay. PN24 cells were embedded in 40% Matrigel and allowed to form cysts for 4 days. Compound solutions were added following the plate map shown: Columns 1 and 2 contained positive and neutral controls, respectively. Columns 3–24, rows A and I, contained test compounds at 8 column-wise dilution points. Plates were incubated for an additional 5 days before bright-field confocal imaging as in (A), followed by addition of CTG-3D to obtain an endpoint measurement of cell viability.
Figure 4
Figure 4
The 3D assay identifies multiple compounds that reduce cyst growth and swelling. (A) Examples of compounds that either reduce (Teniposide) or have no effect (ABT-737) on cyst growth. Graphs on the left indicate dose response curves of each compound in the CTG (grey circles) and imaging-based cyst size (purple squares) readouts. Data is represented as Mean ± SD, n = 3. Representative images of wells treated with the indicated compound are on the right. Each compound was tested at a total of 8 concentration points (1:2 serial dilutions). Teniposide was tested at a concentration range of 10–0.078 µM and ABT-737 at 50–0.39 µM. (B) Compounds that reduce cyst swelling and have minimal effect on viability. Graphs on the left indicate dose response curves of each compound in the CTG (grey circles) and imaging-based cyst size (purple squares) readouts. Representative images of wells treated with the indicated compound are on the right. Each compound was tested at a total of 8 concentration points (1:2 serial dilutions). Epothilone A was tested at a concentration range of 10–0.078 µM and Tosedostat at 50–0.39 µM.
Figure 5
Figure 5
Compound responses in a panel of primary ADPKD and normal human kidney (NHK) epithelial cells. (A) Pairwise analysis of similarity of compound response between kidney cell preparations. Cell pairs displaying similar responses (p-val > 0.05) are colored yellow and those displaying different responses (p-val < 0.05) are colored pink. ADPKD cells are labeled in black and NHK in red. Left: CTG readout; Right: GF-AFC readout. (B) Mean ΔAUC ± SD of compounds with differential response in ADPKD vs. NHK cell pairs. Only compounds with differential responses in more than 6 pairs (with at least 2 different ADPKD and 3 different NHK cell isolates) are shown. The size of the node corresponds to the number of cell pairs. (C) Dose response curves of antimetabolites displaying differential response in pairwise analysis of ADPKD (black) and NHK (red) primary cells in the CTG readout. Responses obtained with GF-AFC reagent are shown in Supplementary Fig. 9. Data is represented as Mean ± SD, n = 3.

References

    1. Harris, P. C. & Torres, V. E. In GeneReviews((R)) (eds Adam, M. P. et al.) (1993).
    1. Torres VE, Harris PC, Pirson Y. Autosomal dominant polycystic kidney disease. Lancet. 2007;369:1287–1301. doi: 10.1016/S0140-6736(07)60601-1. - DOI - PubMed
    1. Torres VE, Rossetti S, Harris PC. Update on autosomal dominant polycystic kidney disease. Minerva Med. 2007;98:669–691. - PubMed
    1. Seeger-Nukpezah T, Geynisman DM, Nikonova AS, Benzing T, Golemis EA. The hallmarks of cancer: relevance to the pathogenesis of polycystic kidney disease. Nat. Rev. Nephrol. 2015;11:515–534. doi: 10.1038/nrneph.2015.46. - DOI - PMC - PubMed
    1. Hwang VJ, et al. Anticystogenic activity of a small molecule PAK4 inhibitor may be a novel treatment for autosomal dominant polycystic kidney disease. Kidney Int. 2017;92:922–933. doi: 10.1016/j.kint.2017.03.031. - DOI - PMC - PubMed

Publication types