. 2020 Mar 6;10(1):4247.
doi: 10.1038/s41598-020-61192-y.

Diet influences the functions of the human intestinal microbiome

Affiliations

Diet influences the functions of the human intestinal microbiome

Maria De Angelis et al. Sci Rep. .

Abstract

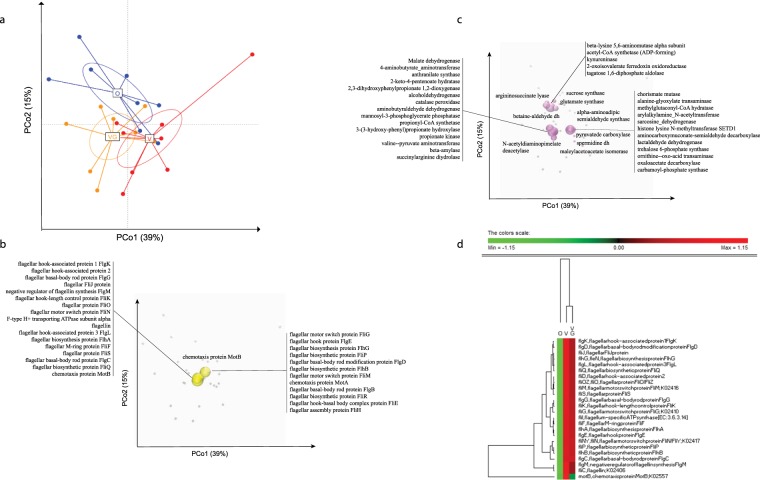
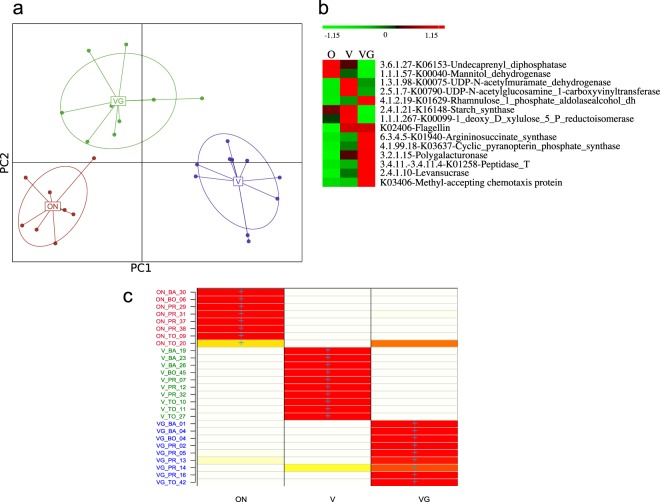
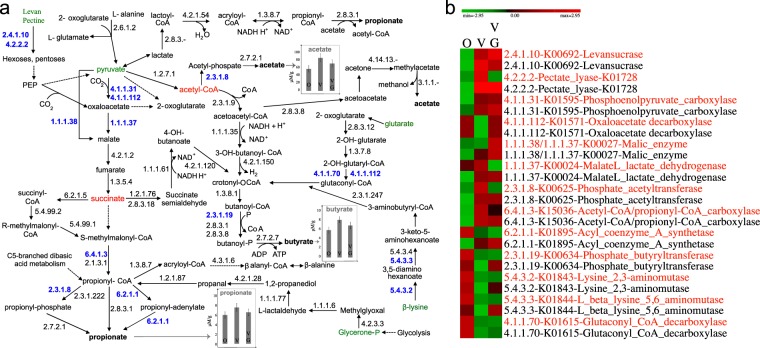
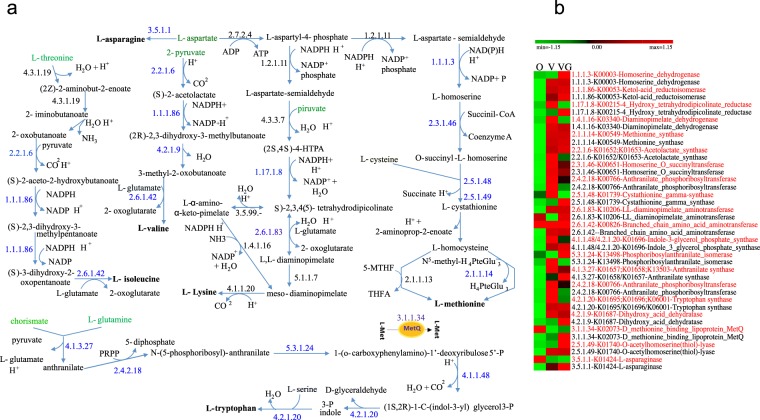
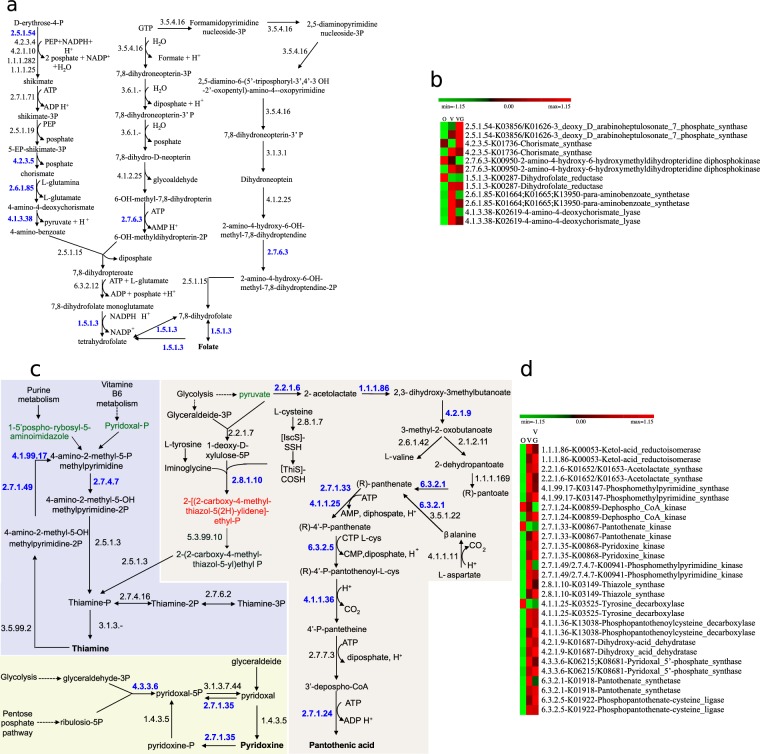
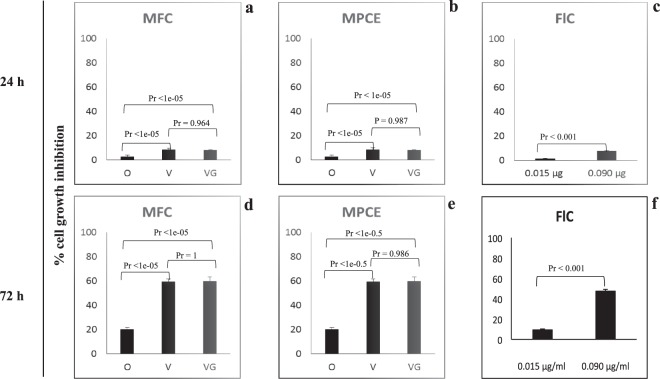
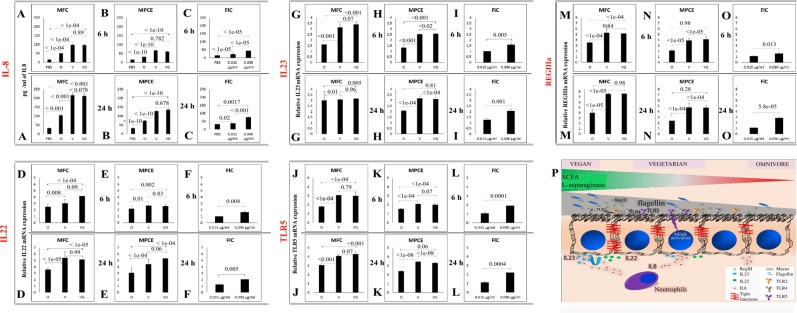
Gut microbes programme their metabolism to suit intestinal conditions and convert dietary components into a panel of small molecules that ultimately affect host physiology. To unveil what is behind the effects of key dietary components on microbial functions and the way they modulate host-microbe interaction, we used for the first time a multi-omic approach that goes behind the mere gut phylogenetic composition and provides an overall picture of the functional repertoire in 27 fecal samples from omnivorous, vegan and vegetarian volunteers. Based on our data, vegan and vegetarian diets were associated to the highest abundance of microbial genes/proteins responsible for cell motility, carbohydrate- and protein-hydrolyzing enzymes, transport systems and the synthesis of essential amino acids and vitamins. A positive correlation was observed when intake of fiber and the relative fecal abundance of flagellin were compared. Microbial cells and flagellin extracted from fecal samples of 61 healthy donors modulated the viability of the human (HT29) colon carcinoma cells and the host response through the stimulation of the expression of Toll-like receptor 5, lectin RegIIIα and three interleukins (IL-8, IL-22 and IL-23). Our findings concretize a further and relevant milestone on how the diet may prevent/mitigate disease risk.


Conflict of interest statement

The authors declare no competing interests.

Figures

Figure 1
Figure 1
Principal coordinate analysis (PCoA) of the KEGG Orthology (KO) genes that discriminated the fecal microbiomes of omnivorous (O), vegan (V) and vegetarian (VG) volunteers based on their diets. Panel a, Euclidean PCoA plot illustrating the observed diversity between samples. Panel b, the most abundant KO genes belonging to carbohydrate and amino acid metabolism. Panel c, the most abundant KO genes involved in flagellar assembly and bacterial chemotaxis. The spheres represent KO genes mapped onto the weighted average of the coordinates of all samples, where the weights are the relative abundances of the genes in the samples. The size of the spheres is proportional to the mean relative abundance of the corresponding genes across all samples. Purple spheres represent amino acid or carbohydrate metabolism; yellow spheres represent flagellar assembly, bacterial chemotaxis or two-component system genes. Panel d, heatmap showing the differentially (FDR < 0.05) detected genes involved in flagellar assembly and bacterial chemotaxis. The colors of the scale bar denote the abundance of the genes, with 1.15 indicating the highest abundance (red) and −1.15 indicating the lowest abundance (green) between diet groups.
Figure 2
Figure 2
Multivariate statistical analyses based on the meta-proteomes of omnivores (O), vegans (V) or vegetarians (VG). Panel a, discriminant analysis of principal components (DAPC) score plot. Panel b, heatmap showing the differentially (FDR < 0.05) detected proteins in the sample meta-proteomes that mostly discriminated the diet groups. The colors of the scale bar denote the protein abundance with 1.15 indicating the highest abundance (red) and −1.15 indicating the lowest abundance (green) between diet groups. Panel c represents whether the individuals (rows) were correctly assigned (based on discriminant functions) to the genetic cluster where they were included a priori (columns) by K-means analyses used to infer the best-supported clustering solution. Colors represent membership probabilities to each cluster (red = 1, orange = 0.75, yellow = 0.25, white = 0) and blue crosses indicate the cluster where the individuals were originally assigned by K-means analyses. Sample label colours match the sample diet labels in the DAPC clusters (Panel a).
Figure 3
Figure 3
Reconstruction of microbial pathways in the intestine involved in the biosynthesis of short-chain fatty acids (acetic acid, butanoate and propionate) (SCFAs) using DESeq statistically significant differences for genes and proteins identified from the multi-omics data sets belonging to omnivores (O), vegans (V) and vegetarians (VG). Panel a, schematic representation of the SCFA metabolic pathways. The blue numbers indicate enzymes that were differentially (FDR < 0.05) detected among diet groups. Principal metabolites are colored in green. The average concentrations (µM/g of feces) of acetate, butyrate and propionate found in the metabolome of omnivores, vegans and vegetarians are indicated in the histograms. Panel b, heatmap showing the differentially detected genes (red characters) and proteins (black characters) in the diet groups. The colors of the scale bar denote the abundance of the genes and proteins (indicated in blue characters in panel a), with 1.94 indicating the highest abundance (red) and −1.94 indicating the lowest abundance (green) between diet groups.
Figure 4
Figure 4
Reconstruction of the microbial pathways in the intestine involved in the biosynthesis of L-methionine, L-lysine, L-isoleucine, L-valine and L-tryptophan using DESeq statistically significant differences for genes and proteins identified from multi-omics data sets belonging to omnivores (O), vegans (V) and vegetarians (VG). Panel a, schematic representation of metabolic pathways for the biosynthesis of amino acids. The blue numbers indicate enzymes that were differentially (FDR < 0.05) detected among diet groups. Principal metabolites are colored in green. Panel b, heatmap showing the differentially detected genes (red characters) and proteins (black characters) in the diet groups. The colors of the scale bar denote gene and protein abundance (indicated in blue characters in panel a), with 1.15 indicating the highest abundance (red) and −1.15 indicating the lowest abundance (green) between diet groups.
Figure 5
Figure 5
Reconstruction of the microbial intestinal pathways involved in the biosynthesis of folate (Panels a, b) and thiamine, pyridoxal, pantothenic acid and coenzyme A (Panels c, d) statistically significant differences for genes and proteins identified from multi-omics data sets by applying the DESeq2 R package and belonging to omnivores (O), vegans (V) and vegetarians (VG). Panels a and c, schematic representations of metabolic pathways for the biosynthesis of folate and thiamine, pyridoxal, pantothenic acid and coenzyme A. The blue numbers indicate enzymes that were differentially (FDR < 0.05) detected among diet groups by applying the DESeq2 package. Panels b and d, heatmap showing the differentially detected genes (red characters) and proteins (black characters) in the diet groups. The colors of the scale bar denote gene and protein abundance (indicated in blue characters in panel a), with 1.15 indicating the highest abundance (red) and −1.15 indicating the lowest abundance (green) between diet groups.
Figure 6
Figure 6
The intestinal microbiota inhibits the proliferation of colon cancer cells. The capacity of microbial fecal cells (MFCs) extracted from 22 omnivores (O), 20 vegetarians (VG) and 19 vegans (V) and the corresponding microbial protein cell extracts (MPCEs) and flagellin (FlC) at two different concentrations (0.015 µg/ml of DMEM for O and 0.090 µg/ml for VG and V MPCE samples) to affect cell viability was assessed by the sulforhodamine B assay at different time-points in human HT29 colon cancer cells. Percentages of growth inhibition for colon cancer cells treated with MFCs, MPCEs or FlC compared to control (cells treated with PBS only), presented as the mean value ± s.d. from three replicates for each of the 61 samples. All data shown are representative of three independent experiments using fecal samples collected at three time-points in one month. Corrected P-values were obtained by using ANOVA test and Tukey test for multiple test correction.
Figure 7
Figure 7
The intestinal microbiota induces the expression of interleukins, Toll-like receptor 5 and the lectin RegIIIα. The capacity of microbial fecal cells (MFCs) extracted from 22 omnivores (O), 20 vegetarians (VG) and 19 vegans (V) and the corresponding microbial protein cell extracts (MPCEs) and flagellin (FlC) at two different concentrations (0.015 µg/ml of DMEM for O and 0.090 µg/ml for VG and V MPCE samples) to affect the expression of IL-8 (panels A–C), IL-22 (D–F) and IL-23 (G–I), Toll-like receptor 5 (J–L) and the lectin RegIIIα (M–O) was assessed at 6 and 24 h in human HT29 colon cancer cells. The levels of expression of each gene in colon cancer cells treated with MFCs, MPCEs or FlC, compared to control (cells treated with PBS only), presented as the mean value ± s.d. from three replicates for each of the 61 samples. All data shown are representative of three independent experiments using fecal samples collected at three time-points in one month. Differences between control and treated cells were considered statistically significant when p < 0.05. A schematic representation of how interleukins, TLR-5 and RegIIIα work synergically is provided in panel P.

References

    1. Lozupone C, et al. Identifying genomic and metabolic features that can underlie early successional and opportunistic lifestyles of human gut symbionts. Genome Res. 2012;22:1974–1984. doi: 10.1101/gr.138198.112. - DOI - PMC - PubMed
    1. Zhernakova A, et al. Population-based metagenomics analysis reveals markers for gut microbiome composition and diversity. Science. 2016;352:565–569. doi: 10.1126/science.aad3369. - DOI - PMC - PubMed
    1. De Filippis F, Vitaglione P, Cuomo R, Berni Canani R, Ercolini D. Dietary interventions to modulate the gut microbiome - how far away are we from precision medicine. Inflamm. Bowel Dis. 2018;40:2142–2154. doi: 10.1093/ibd/izy080. - DOI - PubMed
    1. Honda K, Littman DR. The microbiota in adaptive immune homeostasis and disease. Nature. 2016;535:75–84. doi: 10.1038/nature18848. - DOI - PubMed
    1. Flemer B, et al. Tumour-associated and non-tumour-associated microbiota in colorectal cancer. Gut. 2017;66(4):633–643. doi: 10.1136/gutjnl-2015-309595. - DOI - PMC - PubMed

Publication types