. 2020 Nov;287(22):4933-4951.
doi: 10.1111/febs.15280. Epub 2020 Mar 20.

Mitotic entry upon Topo II catalytic inhibition is controlled by Chk1 and Plk1

Affiliations

Mitotic entry upon Topo II catalytic inhibition is controlled by Chk1 and Plk1

Maria Arroyo et al. FEBS J. 2020 Nov.

Abstract

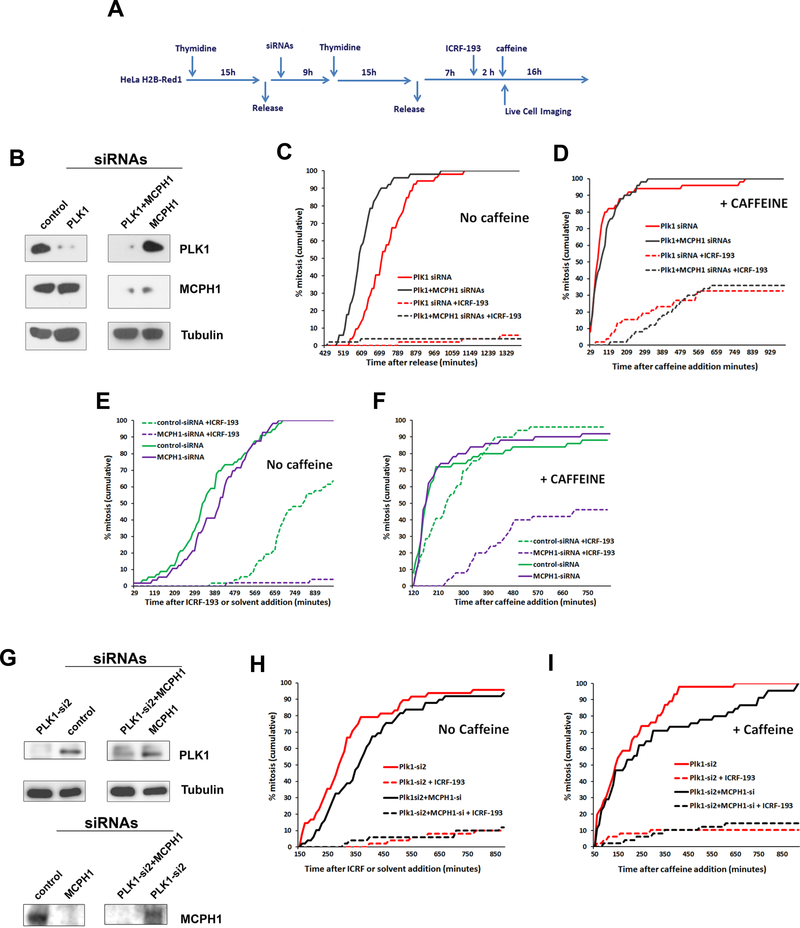
Catalytic inhibition of topoisomerase II during G2 phase delays onset of mitosis due to the activation of the so-called decatenation checkpoint. This checkpoint is less known compared with the extensively studied G2 DNA damage checkpoint and is partially compromised in many tumor cells. We recently identified MCPH1 as a key regulator that confers cells with the capacity to adapt to the decatenation checkpoint. In the present work, we have explored the contributions of checkpoint kinase 1 (Chk1) and polo-like kinase 1 (Plk1), in order to better understand the molecular basis of decatenation checkpoint. Our results demonstrate that Chk1 function is required to sustain the G2 arrest induced by catalytic inhibition of Topo II. Interestingly, Chk1 loss of function restores adaptation in cells lacking MCPH1. Furthermore, we demonstrate that Plk1 function is required to bypass the decatenation checkpoint arrest in cells following Chk1 inhibition. Taken together, our data suggest that MCPH1 is critical to allow checkpoint adaptation by counteracting Chk1-mediated inactivation of Plk1. Importantly, we also provide evidence that MCPH1 function is not required to allow recovery from this checkpoint, which lends support to the notion that checkpoint adaptation and recovery are different mechanisms distinguished in part by specific effectors.

Keywords: Chk1; MCPH1; Plk1; checkpoint adaptation; topoisomerase II.


Conflict of interest statement

Conflict of Interest

The funders had no role in study design, data collection and analysis, decision to publish, or preparation of the manuscript. The corresponding author, on behalf of all authors of the paper, declares no conflict of interest.

Figures

Figure 1:
Figure 1:. MCPH1 depleted cells are able to recover from the decatenation checkpoint arrest and capable of bypass this G2 arrest when Chk1 is simultaneously depleted by RNAi.
(A) Description of the experimental procedure performed in HeLa cells stably expressing fluorescent histone H2B fused to Redl. Cells were synchronized at the Gl/S border by double thymidine block. MCPH1 depletion was achieved by transfection with siRNAs duplexes during the release from the first thymidine block. ICRF-193 (7 μM) was added 6h after release from the second thymidine block to coincide with the occurrence of PLCs during G2 in the siRNA treated cells [47]. Time-lapse phase contrast and fluorescent images were collected immediately after release from ICRF-193 incubation (2h) with a Leica TCS SP5 microscope. Images were stacked and processed using Image J software. Timing data were obtained after visual inspection of mitosis onset, revealed by nuclear envelope breakdown, of 50 cells. (B) Immunoblots analyses of MCPH1 and alpha—tubulin (loading control) levels in HeLa H2B-Red1 cells treated as explained in A. (C) Cumulative frequency chart showing the timing (in minutes) of mitosis onset, revealed by nuclear envelope breakdown, during recovery from ICRF-193 incubation in HeLa H2B-Red1 cells monitored as explained in A. (D) Same recovery analyses as in 1C but with caffeine present in the medium, which was added immediately after release from ICRF-193. (E) Description of the experimental procedure. Briefly, cells were treated as in 1A but two rounds of siRNAs transfection were used this time to assure double knock-downs. (F) Immunoblots analysis of Chk1, MCPH1 and alpha—tubulin (loading control) levels in HeLa H2B-Red1 cells treated as explained in 1E. (G) Cumulative frequency chart showing the timing (in minutes) of mitosis onset, revealed by nuclear envelope breakdown, after ICRF-1933 addition in HeLa H2B-Red1 cells monitored as described in 1E. (H) Same analyses as in 1G but in absence of ICRF-193 treatment. Time after release from the second thymidine block is shown. (I) Box-plots showing the time that chromosome condensation remained visible in cells from 1D before nuclear envelope breakdown. The red line indicates the mean value. C.C. = chromosome condensation; NEB = nuclear envelope breakdown. At least 50 cells were analyzed in each case. Statistical comparisons for the mean and median data were done by T-student and Wilcoxon (W) tests respectively. ** p<0.01; N.S. not significant.
Figure 2:
Figure 2:. Chk1 inactivation is the target of the MCPH1-mediated pathway triggering decatenation checkpoint adaptation.
(A) Description of the experimental procedure performed. HeLa H2B-Red1 cells were synchronized at the G1/S border by double thymidine block. MCPH1 depletion was achieved by transfection with siRNAs duplexes during the release from the first thymidine block. ICRF-193 (7 μM) or solvent (DMSO) was added 7h after release from the second thymidine block to coincide with the occurrence of PLCs during G2 in the siRNA treated cells [47]. Chk1 inhibitor was added two hours afterwards. Time-lapse phase contrast and fluorescent images were collected immediately after UCN01 addition with a Leica TCS SP5 microscope. Images were stacked and processed using Image J software. Timing data were obtained after visual inspection of mitosis onset, revealed by nuclear envelope breakdown, of 50 cells. (B, C) Cumulative frequency chart showing the timing (in minutes) of mitosis onset, revealed by nuclear envelope breakdown, of control cells (B) and MCPH1 depleted cells (C) after the indicated treatments as explained in 2A. Time after UCN01 or solvent addition is shown. (D, E) Cumulative frequency chart showing the timing of mitosis onset of control cells (D) and MCPH1 depleted cells (E) after the indicated treatments as explained in 2A. Time after CHIR-124 or solvent addition is shown. (F) Selected frames showing the mitotic progression of representative control and MCPH1-depleted HeLa cells treated with UCN01 and ICRF-193. Time from UCN01 addition is indicated in minutes. Note that cells end mitosis aberrantly as chromosome segregation is prevented. Scale bars, 10 μM. (G) Selected frames showing the mitotic progression of representative control and MCPH1-depleted HeLa cells treated only with UCN01. Time from UCN01 addition is indicated in minutes. In this case cells progress normally through mitosis. Scale bars, 10 μM. (H) Frequency of histone H3PS10 positive cells in control and MCPH1 patient lymphoblastoid cells, determined by flow cytometry, after incubation with nocodazole alone or combined with UCN01, ICRF-193 or both for the indicated time points. Mean and range (bars) data from two independent experiments is presented. For each time point, pooled data for each treatment were compared independently in control and patient cells by x2 test of independence to nocodazole-treated cells. Furthermore, for each treatment and time point, control and patient data were pairwise compared by x2 test of independence (underlined). ns, non-significant. *P < 0.01. (I) Representative images from cytogenetic preparations of control and MCPH1 patient cells treated simultaneously with ICRF-193 and UCN01. Arrows point to mitotic cells showing entangled and disorganized chromosomes, typical of cells treated with Topo II inhibitors, which were equally observed in both samples. In comparison, cells treated only with UCN01 show normal mitotic chromosomes. Scale bars, 5 μM.
Figure 3:
Figure 3:. The ability of caffeine to bypass the G2 decatenation checkpoint is strongly perturbed if Plk1 function is depleted by RNAi.
(A) Description of the experimental procedure performed. HeLa H2B-Red1 cells were synchronized at the G1/S border by double thymidine block. MCPH1 and/or Plk1 depletion was achieved by transfection with siRNAs duplexes during the release from the first thymidine block. ICRF-193 (7 μM) or solvent (DMSO) was added 7h after release from the second thymidine block while caffeine or solvent (medium) was added two hours afterwards. Time-lapse phase contrast and fluorescent images were collected immediately after UCN01 with a Leica TCS SP5 microscope. Images were stacked and processed using Image J software. Timing data were obtained after visual inspection of mitosis onset, revealed by nuclear envelope breakdown, of 50 cells. (B) Immunoblot analysis of Plk1, MCPH1 and alpha—tubulin (loading control) levels in HeLa H2B-Red1 cells transfected with the indicated siRNAs as explained in 3A. (C-F) Cumulative frequency chart showing the timing (in minutes) of mitosis onset, revealed by nuclear envelope breakdown, of HeLa H2B-Red1 cells after the corresponding treatments in absence (C, E) or presence of caffeine (D, F) as explained in 3A. (G) Immunoblot analysis of Plk1, MCPH1 and alpha—tubulin (loading control) levels in HeLa H2B-Red1 cells transfected with the indicated siRNAs. (H, I) Same analyses as in 3C and 3D but using a different siRNA oligo against Plk1.
Figure 4:
Figure 4:. The ability of caffeine to bypass the G2 decatenation checkpoint is strongly perturbed if Plk1 function is blocked by chemical inhibitors.
(A) Description of the experimental procedure performed. HeLa H2B-Red1 cells were synchronized at the G1/S border by double thymidine block. MCPH1 depletion was achieved by transfection with siRNAs duplexes during the release from the first thymidine block. ICRF-193 (7 μM) was added 7h after release from the second thymidine block. BI2536 and/or caffeine were added two hours later, and time-lapse phase contrast and fluorescent images were collected immediately afterwards with a Leica TCS SP5 microscope. Images were stacked and processed using Image J software. Timing data were obtained after visual inspection of mitosis onset, revealed by nuclear envelope breakdown, of 50 cells. (B, C) Cumulative frequency chart showing the timing (in minutes) of mitosis onset, revealed by nuclear envelope breakdown, of control (B) and MCPH1 depleted (C) HeLa H2B-Red1 cells after the corresponding treatments in the presence of ICRF-193. Time after ICRF-193 addition is shown. (D, E) Cumulative frequency chart showing the timing (in minutes) of control (D) and MCPH1 depleted (E) HeLa H2B-Red1 cells treated with solvent or BI2536 upon release from the second thymidine block. Time after release from the second thymidine block is shown. (F) Selected frames showing the condensation dynamics of control and MCPH1-siRNA treated HeLa cells while arrested in G2 by simultaneous ICRF-193, BI2536 and caffeine incubation. Time from caffeine addition is indicated in minutes. Scale bars, 10 μM. (G, H) Selected frames showing the mitotic progression of representative control and MCPH1-depleted HeLa cells treated with BI2536 (G) or untreated (H). Time from the second thymidine release is shown. Note that in the first case cells were unable to perform chromosome alignment and segregation as a consequence of Plk1 inhibition. However, in the absence of the Plk1 inhibitor cells completed mitosis successfully. Note that chromosome alignment at prometaphase is delayed in the absence of MCPH1 function, in agreement with previous reports (delayed chromosomes indicated by red arrows). Scale bars, 10 μM.
Figure 5:
Figure 5:. Plk1 function is required for caffeine to induce decatenation checkpoint bypass in human lymphoblastoid cells
(A-D) Frequency of histone H3PS10 positive cells in control (A, B) and MCPH1 patient (C, D) lymphoblastoid cells, determined by flow cytometry, after four or seven hours of incubation with nocodazole alone or in combination with the indicated inhibitors. Mean and range (bars) data from two independent experiments is presented. For each time point from A and C, pooled data for each treatment were compared independently by x2 test of independence to nocodazole-treated cells. For each time point from B and D, pooled data were similarly compared to cells treated with ICRF and caffeine. ns, non-significant. *P < 0.01. (E) Representative images from cytogenetic preparations of control and MCPH1 patient cells treated simultaneously with nocodazole alone or combined with BI2536. Scale bars, 5 μM.
Figure 6:
Figure 6:. Wee1 does not contribute to the MCPH1-dependent pathway controlling decatenation checkpoint adaptation.
(A) Description of the experimental procedure performed. HeLa H2B-Red1 cells were synchronized at the G1/S border by double thymidine block. MCPH1 depletion was achieved by transfection with siRNAs duplexes during the release from the first thymidine block. ICRF-193 (7 μM) or solvent (DMSO) was added 6h after release from the second thymidine block. MK1775 alone or in combination with BI2536 were added two hours afterwards, and time-lapse phase contrast and fluorescent images were collected immediately after MK1775 addition with a Leica TCS SP5 microscope. Images were stacked and processed using Image J software. Timing data were obtained after visual inspection of mitosis onset, revealed by nuclear envelope breakdown, of 50 cells. (B, C) Cumulative frequency chart showing the timing (in minutes) of mitosis onset, revealed by nuclear envelope breakdown, of HeLa H2B-Red1 cells after the corresponding treatments in absence (B) or presence of BI2536 (C) as explained in 3B. (D) Frequency of histone H3PS10 positive cells in control and MCPH1 patient lymphoblastoid cells, determined by flow cytometry, after four hours of incubation with nocodazole alone or combined with MK1775, ICRF-193 and BI2536 as indicated. Mean and range (bars) data from two independent experiments is presented. For each time point, pooled data for each treatment were compared independently in control and patient cells by x2 test of independence to nocodazole-treated cells. Furthermore, for each treatment and time point, control and patient data were pairwise compared by x2 test of independence (underlined). ns, non-significant. *P < 0.01. (E) Schematic diagram showing the domain structure and size of the MCPH1 constructs employed in the pull-down analyses of protein interactions. (F) Pull-down analyses showing the in vitro interaction of MCPH1 and Chk1. GFP alone or GFP-tagged MCPH1 constructs were transfected into HEK293 cells for 48 h before purification and incubation with either myc-Chk1 or myc-Plk1 cell extracts obtained from transfected HEK293 cells. Samples were finally analyzed by western blotting using anti-myc and anti-GFP antibodies. Blots representative of two independent biological replicates are presented.
Figure 7:
Figure 7:. Pkl1 function is required to bypass the decatenation checkpoint in cells following Chk1 inhibition.
(A) Description of the experimental procedure performed. HeLa H2B-Red1 cells were synchronized at the G1/S border by double thymidine block. MCPH1 depletion was achieved by transfection with siRNAs duplexes during the release from the first thymidine block. ICRF-193 (7 μM) was added 7h after release from the second thymidine block. BI2536, UCN01 and caffeine were added two hours later. Time-lapse phase contrast and fluorescent images were collected immediately afterwards with a Leica TCS SP5 microscope. Images were stacked and processed using Image J software. Timing data were obtained after visual inspection of mitosis onset, revealed by nuclear envelope breakdown, of 50 cells. (B-D) Cumulative frequency chart showing the timing (in minutes) of mitosis onset, revealed by nuclear envelope breakdown, of HeLa H2B-Red1 cells incubated with ICRF-193 and further treated as indicated. Time after UCN01 (B) or caffeine addition (C, D) is shown. (E) Description of the experimental procedure. HeLa H2B-Red1 were synchronized at the G1/S border by double thymidine block. Transfection with the corresponding siRNAs duplexes was performed during the incubation and release from the first thymidine block. ICRF-193 (7 μM) was added 6h after release from the second thymidine block. Time-lapse analyses were done as explained in 7A. (F, G) Cumulative frequency chart showing the timing (in minutes) of mitosis onset, revealed by nuclear envelope breakdown, of ICRF-193 treated cells transfected with the corresponding siRNAs as explained in E. Time after ICRF-193 addition is shown. (H-I) Frequency of histone H3PS10 positive cells in control and MCPH1 patient lymphoblastoid cells, determined by flow cytometry, after four or seven hours of incubation with nocodazole alone or in combination with the indicated inhibitors. Mean and range (bars) data from two independent experiments is presented. For each time point, pooled data for each treatment were compared independently by X2 test of independence to cells simultaneously treated with ICRF-193 and UCN01 (H) or to nocodazole-treated cells (I). ns, non-significant. *P < 0.01. (J) Model representing some components of the pathway regulating the G2 arrest induced by catalytic inhibitors of Topo II. Blue components represent factors required for triggering the G2 arrest after catalytic inhibition of Topo II, while red components are factors whose activity is indispensable for bypass of the G2 arrest.

References

    1. Langerak P & Russell P (2011) Regulatory networks integrating cell cycle control with DNA damage checkpoints and double-strand break repair. Philos. Trans. R. Soc. B Biol. Sci 366, 3562–3571. - PMC - PubMed
    1. Jackson SP & Bartek J (2010) The DNA-damage response in human biology and disease. Nature 461, 1071–1078. - PMC - PubMed
    1. Bartek J & Lukas J (2007) DNA damage checkpoints: from initiation to recovery or adaptation. Curr. Opin. Ceil Biol 19, 238–245. - PubMed
    1. Sandell LL & Zakian VA (1993) Loss of a yeast telomere: Arrest, recovery, and chromosome loss. Ceii 75, 729–739. - PubMed
    1. Toczyski DP, Galgoczy DJ & Hartwell LH (1997) CDC5 and CKII control adaptation to the yeast DNA damage checkpoint. Ceii 90, 1097–1106. - PubMed

Publication types

MeSH terms