

Quantitative MRI Reveals Microstructural Changes in the Upper Leg Muscles After Running a Marathon
- PMID: 32144857
- PMCID: PMC7496541
- DOI: 10.1002/jmri.27106
Quantitative MRI Reveals Microstructural Changes in the Upper Leg Muscles After Running a Marathon
Abstract
Background: The majority of sports-related injuries involve skeletal muscle. Unlike acute trauma, which is often caused by a single traumatic event leading to acute symptoms, exercise-induced microtrauma may remain subclinical and difficult to detect. Therefore, novel methods to detect and localize subclinical exercise-induced muscle microtrauma are desirable.
Purpose: To assess acute and delayed microstructural changes in upper leg muscles with multiparametric quantitative MRI after running a marathon.
Study type: Longitudinal; 1-week prior, 24-48 hours postmarathon and 2-week follow-up POPULATION: Eleven men participants (age: 47-68 years).
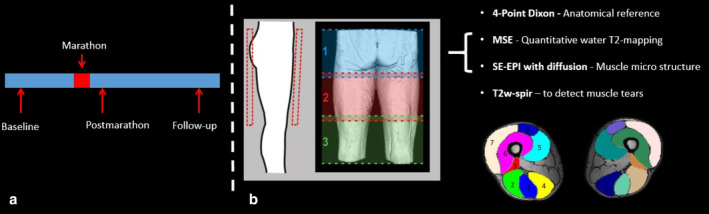
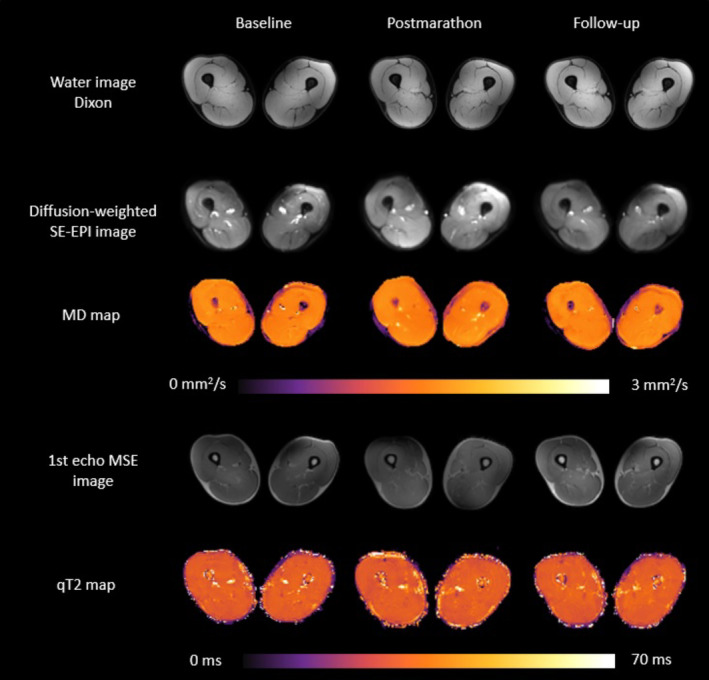
Field strength/sequence: Spin-echo echo planar imaging (SE-EPI) with diffusion weighting, multispin echo, Dixon, and fat-suppressed turbo spin-echo (TSE) sequences at 3T. MR datasets and creatine kinase (CK) concentrations were obtained at three timepoints.
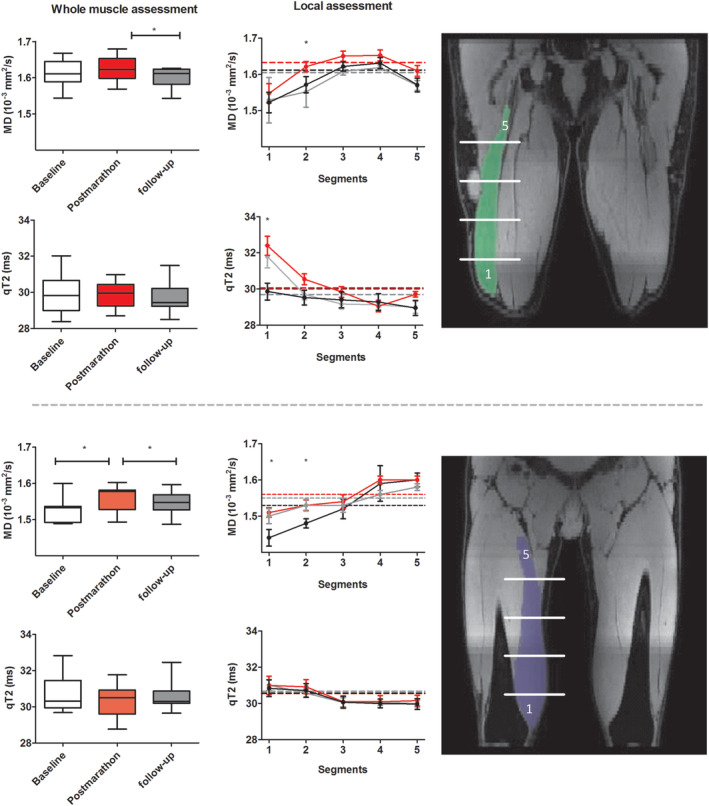
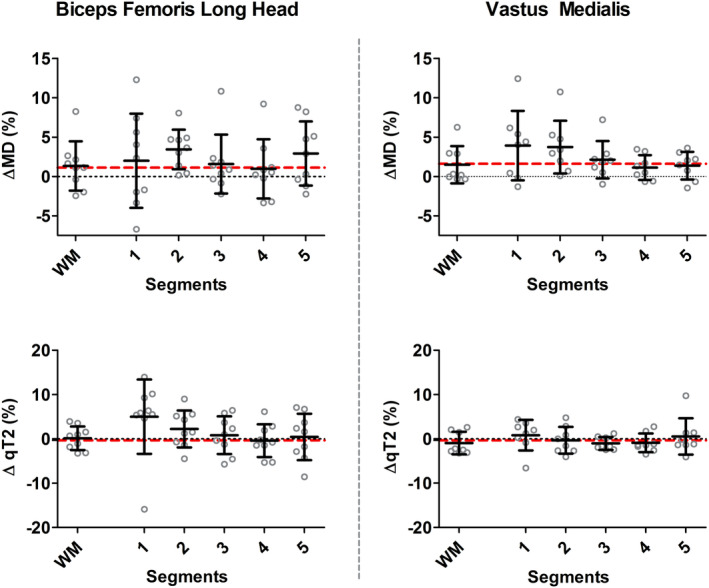
Assessment: Diffusion parameters, perfusion fractions, and quantitative (q)T2 values were determined for hamstring and quadriceps muscles, TSE images were scored for acute injury. The vastus medialis and biceps femoris long head muscles were divided and analyzed in five segments to assess local damage.
Statistical tests: Differences between timepoints in MR parameters were assessed with a multilevel linear mixed model and in CK concentrations with a Friedman test. Mean diffusivity (MD) and qT2 for whole muscle and muscle segments were compared using a multivariate analysis of covariance (MANCOVA).
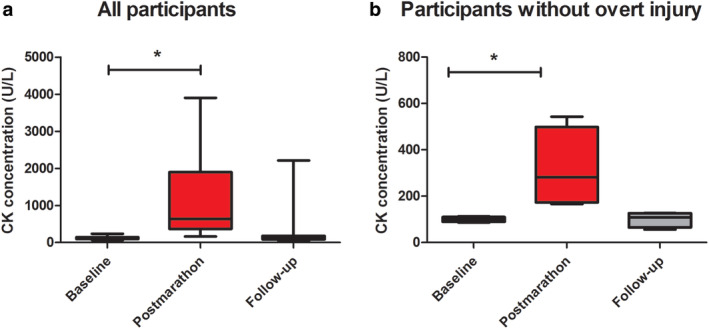
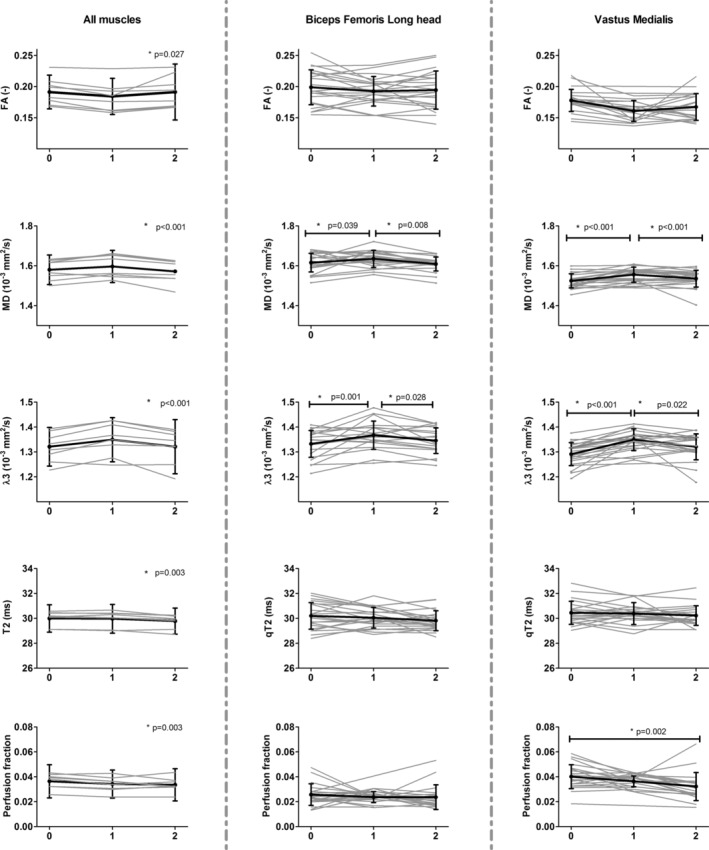
Results: CK concentrations were elevated (1194 U/L [166-3906], P < 0.001) at 24-48 hours postmarathon and returned to premarathon values (323 U/L [56-2216]) at 2-week follow-up. Most of the MRI diffusion indices in muscles without acute injury changed at 24-48 hours postmarathon and returned to premarathon values at follow-up (MD, RD, and λ3; P < 0.006). qT2 values (P = 0.003) and perfusion fractions (P = 0.003) were higher at baseline compared to follow-up. Local assessments of MD and qT2 revealed more pronounced changes than whole muscle assessment (2-3-fold; P < 0.01).
Data conclusion: Marathon running-induced microtrauma was detected with MRI in individual whole upper leg muscles and even more pronounced on local segments.
Level of evidence: 2 TECHNICAL EFFICACY STAGE: 3 J. Magn. Reson. Imaging 2020;52:407-417.
Keywords: DTI; inflammation; microstructure; muscle injury; perfusion.
© 2020 The Authors. Journal of Magnetic Resonance Imaging published by Wiley Periodicals, Inc. on behalf of International Society for Magnetic Resonance in Medicine.
Figures
Comment in
-
Editorial for "Quantitative MRI Reveals Microstructural Changes in the Upper Leg Muscles After Running a Marathon".J Magn Reson Imaging. 2020 Aug;52(2):418-419. doi: 10.1002/jmri.27151. Epub 2020 Mar 24. J Magn Reson Imaging. 2020. PMID: 32207863
References
-
- Faulkner JA, Brooks SV, Opiteck JA. Injury to skeletal muscle fibers during contractions: Conditions of occurrence and prevention. Phys Ther 1993;73(12):911‐921. - PubMed
-
- Armstrong RB. Mechanisms of exercise‐induced delayed onset muscular soreness: A brief review. Med Sci Sports Exerc 1984;16(6):529‐538. - PubMed
-
- Froeling M, Oudeman J, Strijkers GJ, et al. Muscle changes detected with diffusion‐tensor imaging after long‐distance running. Radiology 2014;274(2):548‐562. - PubMed
Publication types
MeSH terms
LinkOut - more resources
Full Text Sources
Research Materials
Miscellaneous
