

Origin and evolution of the Rax homeobox gene by comprehensive evolutionary analysis
- PMID: 32144893
- PMCID: PMC7137802
- DOI: 10.1002/2211-5463.12832
Origin and evolution of the Rax homeobox gene by comprehensive evolutionary analysis
Abstract
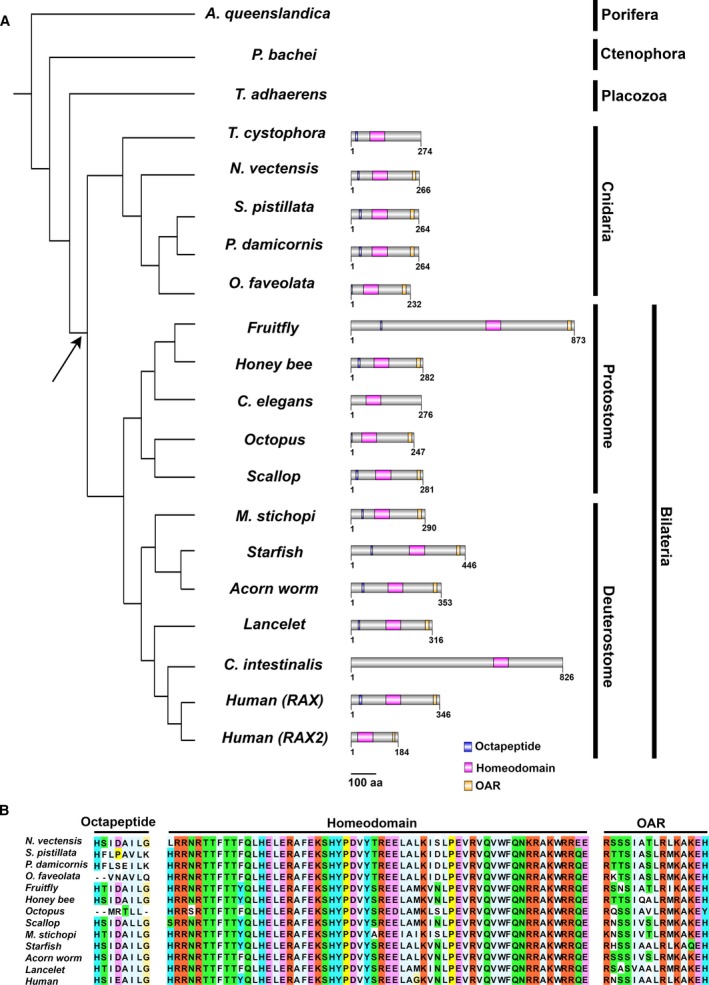
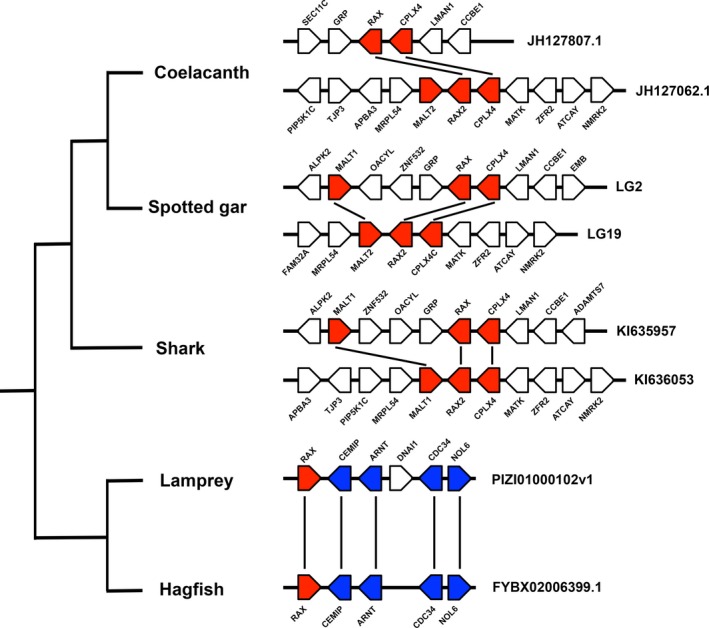
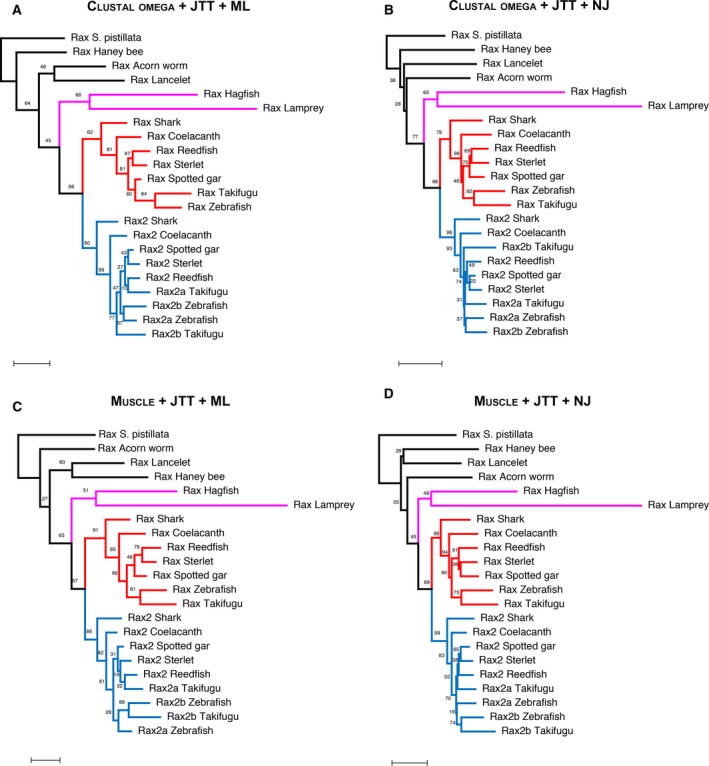
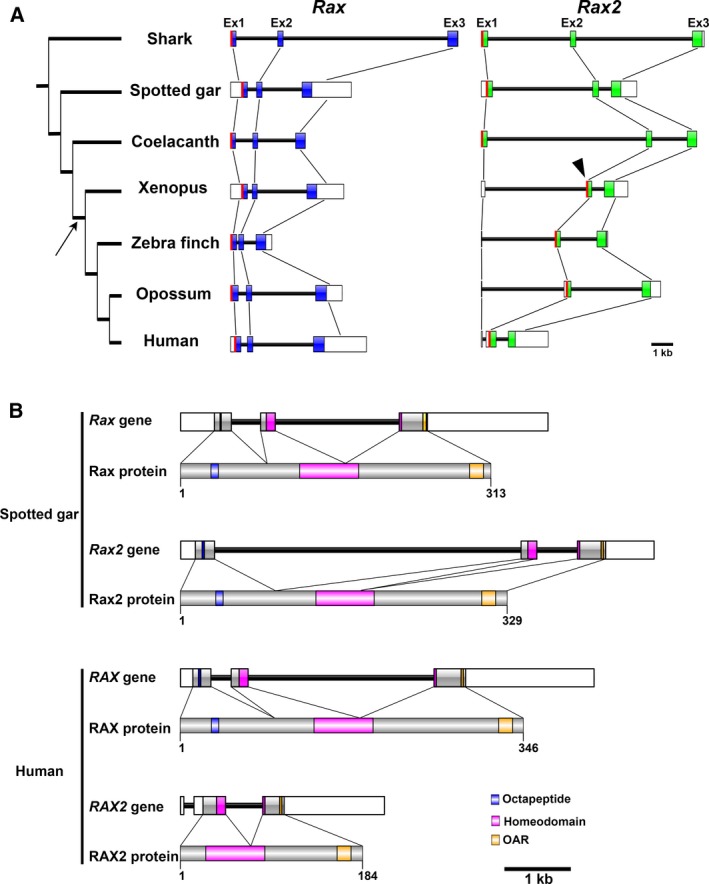
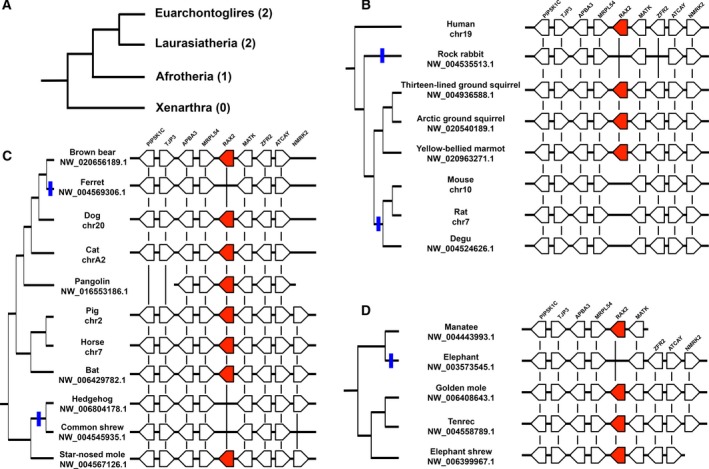
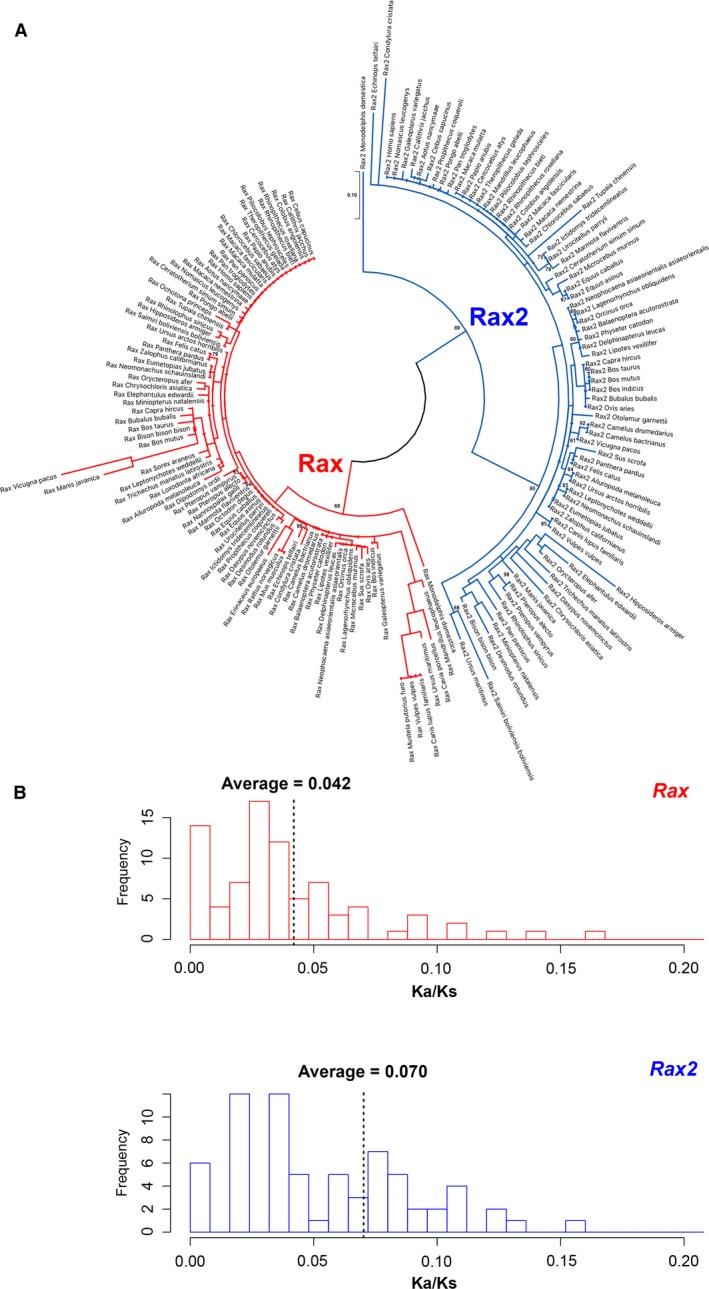
Rax is one of the key transcription factors crucial for vertebrate eye development. In this study, we conducted comprehensive evolutionary analysis of Rax. We found that Bilateria and Cnidaria possess Rax, but Placozoa, Porifera, and Ctenophora do not, implying that the origin of the Rax gene dates back to the common ancestor of Cnidaria and Bilateria. The results of molecular phylogenetic and synteny analyses on Rax loci between jawed and jawless vertebrates indicate that segmental duplication of the Rax locus occurred in an early common ancestor of jawed vertebrates, resulting in two Rax paralogs in jawed vertebrates, Rax and Rax2. By analyzing 86 mammalian genomes from all four major groups of mammals, we found that at least five independent Rax2 gene loss events occurred in mammals. This study may provide novel insights into the evolution of the eye.
Keywords: Pax6; Rax; eye; homeobox gene; molecular evolution; retina.
© 2020 The Authors. Published by FEBS Press and John Wiley & Sons Ltd.
Conflict of interest statement
The authors declare no conflict of interest.
Figures
References
-
- Gehring WJ, Muller M, Affolter M, Percival‐Smith A, Billeter M, Qian YQ, Otting G and Wuthrich K (1990) The structure of the homeodomain and its functional implications. Trends Genet. 6, 323–329. - PubMed
-
- Larroux C, Fahey B, Degnan SM, Adamski M, Rokhsar DS and Degnan BM (2007) The NK homeobox gene cluster predates the origin of Hox genes. Curr Biol 17, 706–710. - PubMed
Publication types
MeSH terms
Substances
Associated data
- Actions
- Actions
- Actions
- Actions
- Actions
- Actions
- Actions
- Actions
- Actions
- Actions
- Actions
- Actions
- Actions
- Actions
- Actions
- Actions
- Actions
- Actions
- Actions
- Actions
- Actions
- Actions
- Actions
- Actions
- Actions
- Actions
- Actions
- Actions
- Actions
- Actions
- Actions
- Actions
- Actions
- Actions
- Actions
- Actions
- Actions
- Actions
- Actions
- Actions
- Actions
- Actions
- Actions
- Actions
- Actions
- Actions
- Actions
- Actions
- Actions
- Actions
- Actions
- Actions
- Actions
- Actions
- Actions
- Actions
- Actions
- Actions
- Actions
- Actions
- Actions
- Actions
- Actions
- Actions
- Actions
- Actions
- Actions
- Actions
- Actions
- Actions
- Actions
- Actions
- Actions
- Actions
- Actions
- Actions
- Actions
- Actions
- Actions
- Actions
- Actions
- Actions
- Actions
- Actions
- Actions
- Actions
- Actions
- Actions
- Actions
- Actions
- Actions
- Actions
- Actions
- Actions
- Actions
- Actions
- Actions
- Actions
- Actions
- Actions
- Actions
- Actions
- Actions
- Actions
- Actions
- Actions
- Actions
- Actions
- Actions
- Actions
- Actions
- Actions
- Actions
- Actions
- Actions
- Actions
- Actions
- Actions
- Actions
- Actions
- Actions
- Actions
- Actions
- Actions
- Actions
- Actions
- Actions
- Actions
- Actions
- Actions
- Actions
- Actions
- Actions
- Actions
- Actions
- Actions
- Actions
- Actions
- Actions
- Actions
- Actions
- Actions
- Actions
- Actions
- Actions
- Actions
- Actions
- Actions
- Actions
- Actions
- Actions
- Actions
- Actions
- Actions
- Actions
- Actions
- Actions
- Actions
- Actions
- Actions
- Actions
- Actions
- Actions
- Actions
- Actions
- Actions
- Actions
- Actions
- Actions
- Actions
- Actions
- Actions
- Actions
- Actions
- Actions
- Actions
- Actions
- Actions
- Actions
- Actions
- Actions
- Actions
- Actions
- Actions
- Actions
- Actions
- Actions
- Actions
- Actions
- Actions
- Actions
- Actions
- Actions
- Actions
- Actions
- Actions
- Actions
- Actions
- Actions
- Actions
- Actions
- Actions
LinkOut - more resources
Full Text Sources
Research Materials
Miscellaneous
