

MiR-1253 exerts tumor-suppressive effects in medulloblastoma via inhibition of CDK6 and CD276 (B7-H3)
- PMID: 32145124
- PMCID: PMC7383594
- DOI: 10.1111/bpa.12829
MiR-1253 exerts tumor-suppressive effects in medulloblastoma via inhibition of CDK6 and CD276 (B7-H3)
Abstract
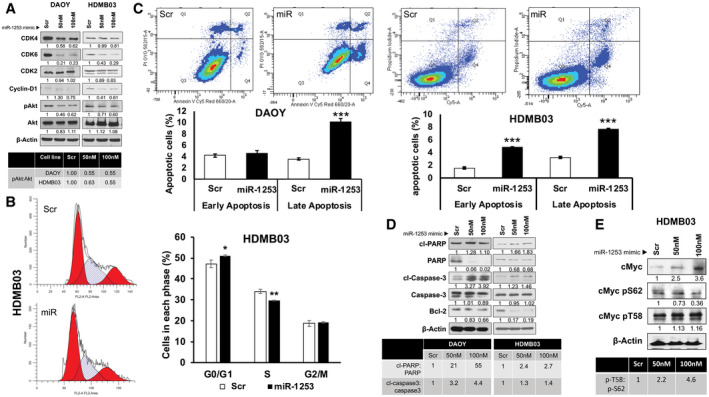
Of the four primary subgroups of medulloblastoma, the most frequent cytogenetic abnormality, i17q, distinguishes Groups 3 and 4 which carry the highest mortality; haploinsufficiency of 17p13.3 is a marker for particularly poor prognosis. At the terminal end of this locus lies miR-1253, a brain-enriched microRNA that regulates bone morphogenic proteins during cerebellar development. We hypothesized miR-1253 confers novel tumor-suppressive properties in medulloblastoma. Using two different cohorts of medulloblastoma samples, we first studied the expression and methylation profiles of miR-1253. We then explored the anti-tumorigenic properties of miR-1253, in parallel with a biochemical analysis of apoptosis and proliferation, and isolated oncogenic targets using high-throughput screening. Deregulation of miR-1253 expression was noted, both in medulloblastoma clinical samples and cell lines, by epigenetic silencing via hypermethylation; specific de-methylation of miR-1253 not only resulted in rapid recovery of expression but also a sharp decline in tumor cell proliferation and target gene expression. Expression restoration also led to a reduction in tumor cell virulence, concomitant with activation of apoptotic pathways, cell cycle arrest and reduction of markers of proliferation. We identified two oncogenic targets of miR-1253, CDK6 and CD276, whose silencing replicated the negative trophic effects of miR-1253. These data reveal novel tumor-suppressive properties for miR-1253, i.e., (i) loss of expression via epigenetic silencing; (ii) negative trophic effects on tumor aggressiveness; and (iii) downregulation of oncogenic targets.
Keywords: CD276; CDK6; chromosome 17p13.3; group 3 medulloblastoma; miR-1253.
© 2020 The Authors. Brain Pathology published by John Wiley & Sons Ltd on behalf of International Society of Neuropathology.
Conflict of interest statement
The authors declare that they have no competing interests.
Figures


Similar articles
-
MicroRNA 218 acts as a tumor suppressor by targeting multiple cancer phenotype-associated genes in medulloblastoma.J Biol Chem. 2013 Jan 18;288(3):1918-28. doi: 10.1074/jbc.M112.396762. Epub 2012 Dec 4. J Biol Chem. 2013. PMID: 23212916 Free PMC article.
-
The Circular RNA circSKA3 Facilitates the Malignant Biological Behaviors of Medulloblastoma via miR-520 h/CDK6 Pathway.Mol Biotechnol. 2022 Sep;64(9):1022-1033. doi: 10.1007/s12033-022-00466-4. Epub 2022 Mar 29. Mol Biotechnol. 2022. PMID: 35352283
-
Regulation of cyclin dependent kinase 6 by microRNA 124 in medulloblastoma.J Neurooncol. 2008 Oct;90(1):1-7. doi: 10.1007/s11060-008-9624-3. Epub 2008 Jul 8. J Neurooncol. 2008. PMID: 18607543
-
miR miR on the wall, who's the most malignant medulloblastoma miR of them all?Neuro Oncol. 2018 Feb 19;20(3):313-323. doi: 10.1093/neuonc/nox106. Neuro Oncol. 2018. PMID: 28575493 Free PMC article. Review.
-
Epigenetic regulation in medulloblastoma.Mol Cell Neurosci. 2018 Mar;87:65-76. doi: 10.1016/j.mcn.2017.09.003. Epub 2017 Dec 18. Mol Cell Neurosci. 2018. PMID: 29269116 Free PMC article. Review.
Cited by
-
Tumor Immunotherapy Targeting B7-H3: From Mechanisms to Clinical Applications.Immunotargets Ther. 2025 Mar 27;14:291-320. doi: 10.2147/ITT.S507522. eCollection 2025. Immunotargets Ther. 2025. PMID: 40171330 Free PMC article. Review.
-
miR-582 Suppresses the Proliferation of B-Cell Precursor Acute Lymphoblastic Leukemia (BCP-ALL) Cells and Protects Them From Natural Killer Cell-Mediated Cytotoxicity.Front Immunol. 2022 Apr 20;13:853094. doi: 10.3389/fimmu.2022.853094. eCollection 2022. Front Immunol. 2022. PMID: 35514986 Free PMC article.
-
Role of MicroRNAs in the Development and Progression of the Four Medulloblastoma Subgroups.Cancers (Basel). 2021 Dec 16;13(24):6323. doi: 10.3390/cancers13246323. Cancers (Basel). 2021. PMID: 34944941 Free PMC article. Review.
-
B7-H3 in acute myeloid leukemia: From prognostic biomarker to immunotherapeutic target.Chin Med J (Engl). 2024 Nov 5;137(21):2540-2551. doi: 10.1097/CM9.0000000000003099. Epub 2024 Apr 9. Chin Med J (Engl). 2024. PMID: 38595093 Free PMC article. Review.
-
Role of B7 family members in glioma: Promising new targets for tumor immunotherapy.Front Oncol. 2023 Jan 18;12:1091383. doi: 10.3389/fonc.2022.1091383. eCollection 2022. Front Oncol. 2023. PMID: 36741734 Free PMC article. Review.
References
-
- Ameres SL, Zamore PD (2013) Diversifying microRNA sequence and function. Nat Rev Mol Cell Biol 14:475–488. - PubMed
-
- Biegel JA, Rorke LB, Packer RJ, Sutton LN, Schut L, Bonner K, Emanuel BS (1989) Isochromosome 17q in primitive neuroectodermal tumors of the central nervous system. Genes Chromosom Cancer 1:139–147. - PubMed
Publication types
MeSH terms
Substances
Grants and funding
- Edna Ittner Pediatric Research Fund, University of Nebraska Medical Center/International
- Pediatric Cancer Research Group, University of Nebraska Medical Center/International
- Friedberg Charitable Foundation, New York University/International
- Fred & Pamela Buffet Cancer Center, University of Nebraska Medical Center/International
- P30 CA036727/CA/NCI NIH HHS/United States
LinkOut - more resources
Full Text Sources
Molecular Biology Databases
Research Materials
