. 2020 Apr 7;118(7):1709-1720.
doi: 10.1016/j.bpj.2020.01.048. Epub 2020 Feb 25.

Predicting Confined 1D Cell Migration from Parameters Calibrated to a 2D Motor-Clutch Model

Affiliations

Predicting Confined 1D Cell Migration from Parameters Calibrated to a 2D Motor-Clutch Model

Louis S Prahl et al. Biophys J. .

Abstract

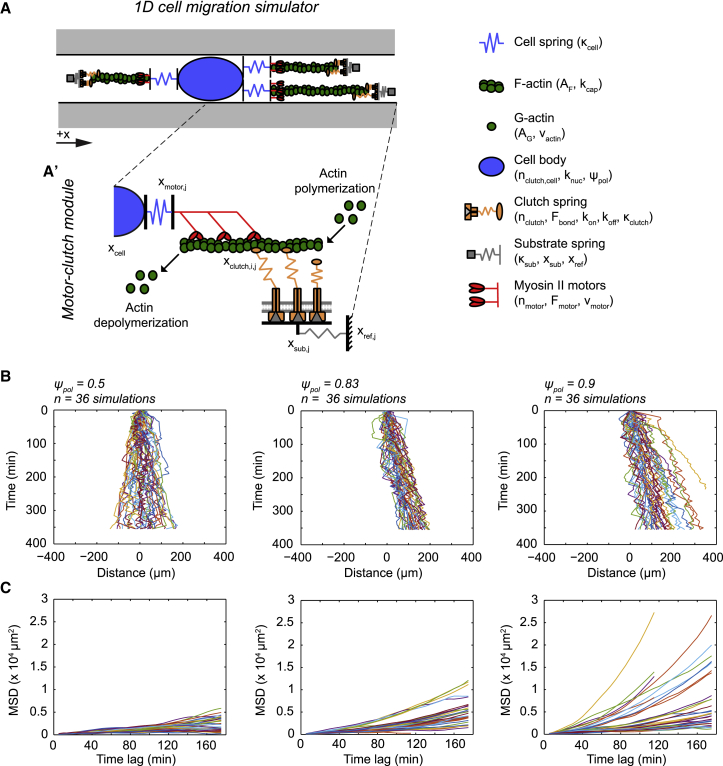
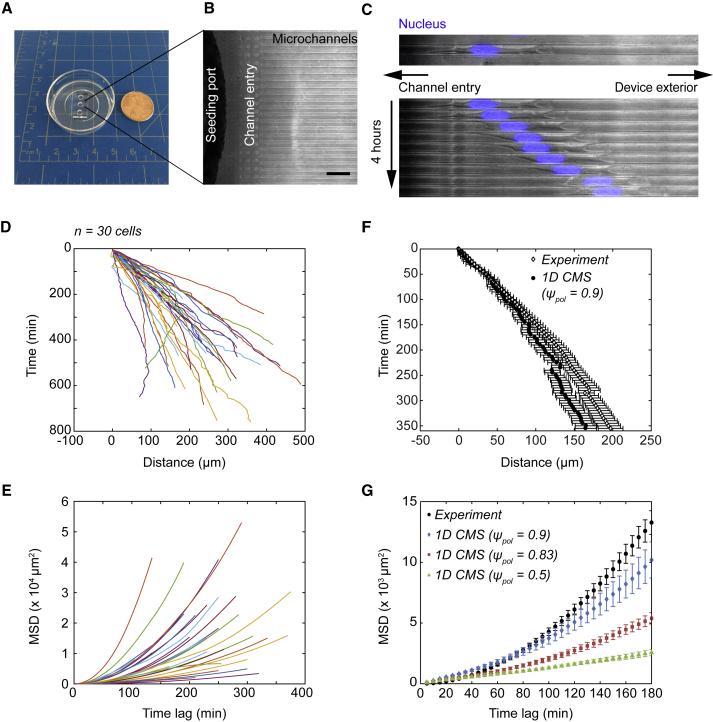
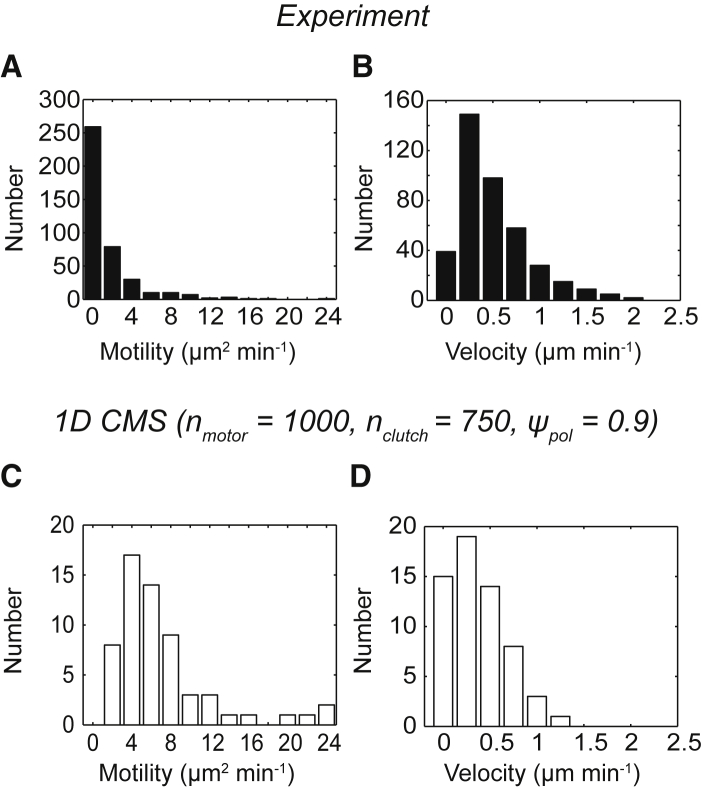
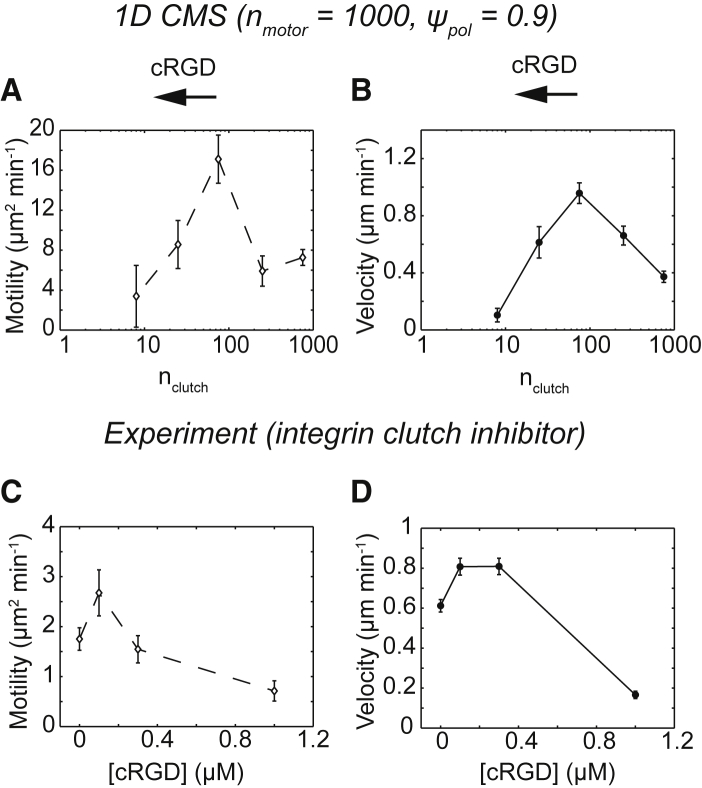
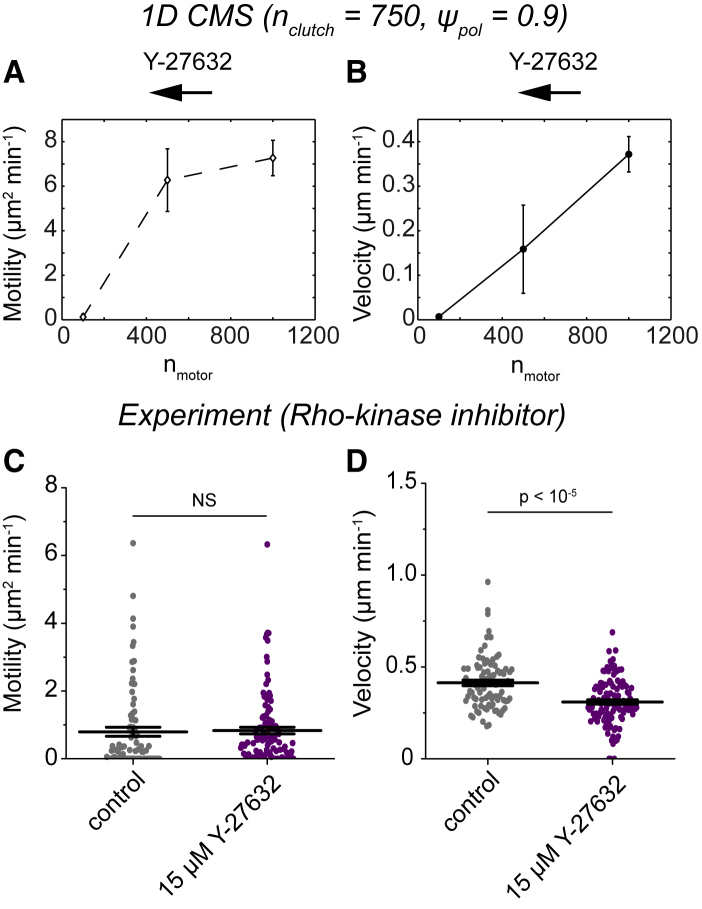
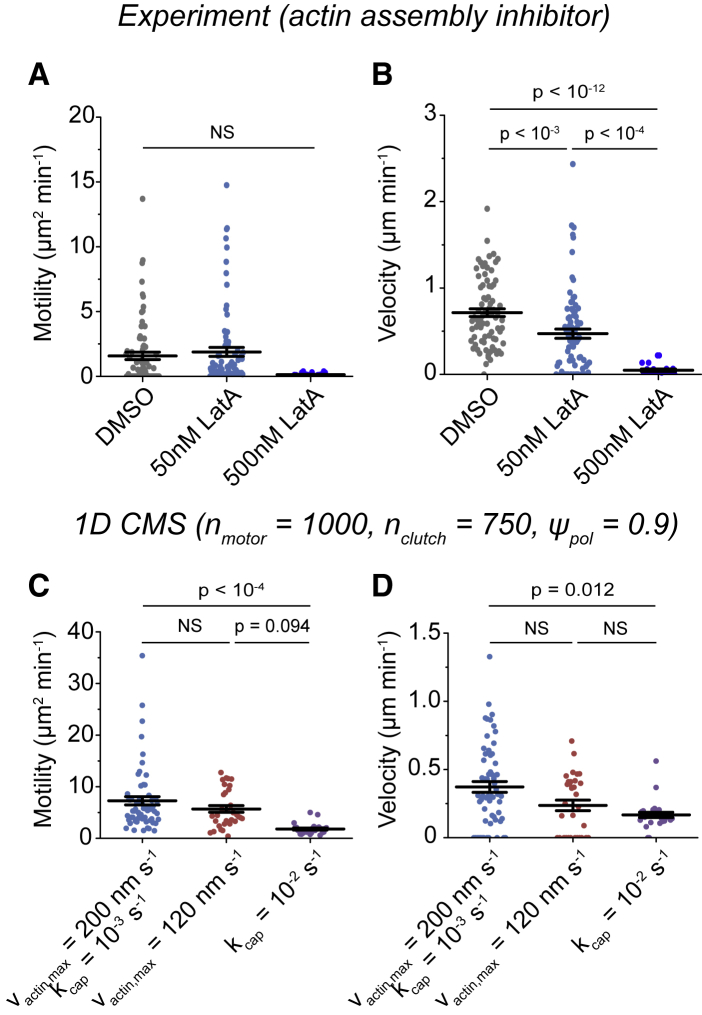
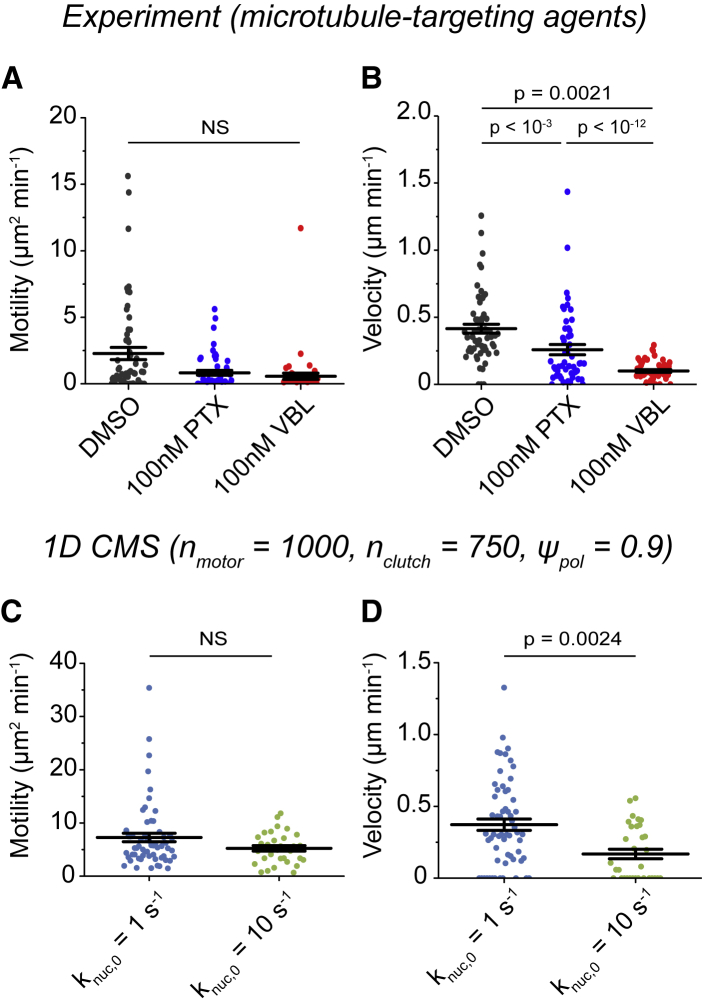
Biological tissues contain micrometer-scale gaps and pores, including those found within extracellular matrix fiber networks, between tightly packed cells, and between blood vessels or nerve bundles and their associated basement membranes. These spaces restrict cell motion to a single-spatial dimension (1D), a feature that is not captured in traditional in vitro cell migration assays performed on flat, unconfined two-dimensional (2D) substrates. Mechanical confinement can variably influence cell migration behaviors, and it is presently unclear whether the mechanisms used for migration in 2D unconfined environments are relevant in 1D confined environments. Here, we assessed whether a cell migration simulator and associated parameters previously measured for cells on 2D unconfined compliant hydrogels could predict 1D confined cell migration in microfluidic channels. We manufactured microfluidic devices with narrow channels (60-μm2 rectangular cross-sectional area) and tracked human glioma cells that spontaneously migrated within channels. Cell velocities (vexp = 0.51 ± 0.02 μm min-1) were comparable to brain tumor expansion rates measured in the clinic. Using motor-clutch model parameters estimated from cells on unconfined 2D planar hydrogel substrates, simulations predicted similar migration velocities (vsim = 0.37 ± 0.04 μm min-1) and also predicted the effects of drugs targeting the motor-clutch system or cytoskeletal assembly. These results are consistent with glioma cells utilizing a motor-clutch system to migrate in confined environments.


Figures

Figure 1
Figure 1
Description and migration dynamics of a 1D CMS. (A) A schematic of a 1D CMS within a confined channel whose axis is denoted by the x axis is given; gray boxes denote channel walls. Modules containing myosin II motors (nmotor) and adhesion clutches (nclutch) attach to a central cell body through compliant springs. F-actin retrograde flow by myosin II motors and adhesion clutches are governed by similar rules to those described for previous iterations of the motor-clutch model (6,40). Cell body clutches (not pictured) associate with the cell center xcell and undergo binding and unbinding as module clutches but are not subject to direct forces by F-actin retrograde flow. Each module contains an F-actin bundle (AF,j for the length of the jth module bundle) to which clutches bind. The total available G-actin in the cell (AG) constrains module nucleation (with base rate constant knuc,0, governed by Eq. S8) and scales actin polymerization speed at the end of modules (maximal speed is vactin,max, governed by Eq. S3). Module capping (kcap) terminates polymerization and facilitates module shortening and turnover, whereas ψpol gives the probability of new protrusions being generated in the +x direction. The number of modules nucleated by a given cell is not constrained, and multiple overlapping modules at the leading or trailing edge of the cell is permitted and denoted by cell springs (κcell) drawn in parallel. (A′) The inset shows a schematic of a single module (i.e., the jth module) within the simulation. Within the jth module, the distal end of the substrate spring is at a reference point xref,j, whereas the other end serves as the anchoring point for the clutch ensemble at xsub,j. The ensemble of nclutch,j clutches within the jth module attaches to the F-actin filament, and xclutch,j represents the average location of the extended clutch springs. Actin polymerizes at the distal end of modules and depolymerizes when it passes the motor ensemble, located at xmotor,j. Movement of the cell body (xcell, pictured as the center of the nucleus) is governed by force balances on each module and the cell body clutches (see, Eqs. S5–S7). (B) The simulation position is shown as a function of time for individual 1D CMS runs in which ψpol = 0.5–0.9 (n = 36 simulated trajectories for each condition). The initial position is marked at x(τ = 0) = 0. (C) The MSD versus time lag is shown for the 1D CMS trajectories in (B). All simulations were run with nmotor = 1000 and nclutch = 750; all other parameter values reported in Table S1.
Figure 2
Figure 2
Tracking individual glioma cell nuclei in channels reveals persistent migration behaviors. (A) A photograph of an assembled device bonded to a 35-mm glass-bottom dish is shown. Note the channels extending from inlet seeding ports drilled into the PDMS block. A US one-cent coin is shown for scale, and the grid spacing is 1 cm. (B) An image of a drilled inlet port in an assembled device showing the entry chamber and 12-μm-wide channels (a height of 5 μm), acquired at 10× magnification using phase contrast optics, is given. Scale bars, 100 μm. (C) (Top) U251 human glioma cell migrating within a confined 12-μm-wide channel imaged using phase contrast and fluorescence is shown. Nucleus counterstain is shown in blue. Images were acquired at 20× magnification. Scale bars, 50 μm. (Bottom) A time-lapse sequence of images acquired for the cell in (B) is given. The images represent 4 h of total time displayed at 30-min intervals. (D) The nucleus x-position versus time as measured for n = 30 individual cells from a representative experiment is shown. Coordinates are plotted relative to the initial tracking position for each cell such that x(τ = 0) = 0. For display purposes, coordinates of cells moving in the −x direction (right to left) were reversed. (E) The mean MSD versus time lag for the individual cells in (E) is shown. For display purposes, error bars are not shown. (F) The mean displacement versus time for a representative experiment (filled circles, mean ± SEM in (D)) and 1D CMS (open diamonds, mean ± SEM for n = 36 simulations with ψpol = 0.9 in Fig. 1B) is shown. (G) The mean MSD versus time lag for a pooled control data set (black circles, n = 403 cells from 12 independent experiments) and 1D CMS with ψpol = 0.9 (blue diamonds, n = 60 simulations), ψpol = 0.83 (red squares, n = 36 simulations), or ψpol = 0.5 (green triangles, n = 40 simulations) is shown. The error bars are mean ± SEM.
Figure 3
Figure 3
Estimates of motility coefficient and velocity from experimental and simulated data. (A) The histogram of the motility coefficients obtained for n = 403 cells, μexp = 1.61 ± 0.14 μm2 min−1 (mean ± standard error (SE)), is shown. (B) The histogram of the velocities obtained for the cells in (A), vexp = 0.51 ± 0.02 μm min−1 (mean ± SE), is shown. (C) The histogram of the motility coefficients obtained for n = 60 individual simulated trajectories with ψpol = 0.9, μsim = 7.27 ± 0.80 μm2 min−1 (mean ± SE) is shown. (D) The histogram of the velocities obtained for n = 60 individual simulated trajectories with ψpol = 0.9, vsim = 0.37 ± 0.04 μm min−1 (mean ± SE) is shown. Individual motility coefficients and velocities were obtained from fits to Eq. 2. All simulations were run with nmotor = 1000, nclutch = 750, and ψpol = 0.9, and all other parameter values reported in Table S1.
Figure 4
Figure 4
Biphasic relationship between velocity and integrin clutch number for simulations and confined glioma cells. (A) The motility coefficients from simulations in which nclutch was varied independently of other parameters are shown (nclutch = 8, 25, 75, 250, and 750 and n = 8, 8, 16, 16, and 60 simulated cells). All simulations were run with nmotor = 1000 and ψpol = 0.9, and all other parameter values were reported in Table S1. (B) The velocities from the simulation conditions in (A) are shown. (C) The motility coefficients for U251 glioma cells treated with complete media (control) or 0.1, 0.3, or 1 μM cRGD (n ≥ 72 cells) are given. (D) The velocities from the experimental conditions in (C) are shown. Individual motility coefficients and velocities were obtained from fits to Eq. 2. The error bars represent mean ± SEM. Pairwise statistics are reported in Table S2.
Figure 5
Figure 5
Monotonic relationship between velocity and myosin II motor number for simulations and confined glioma cells. (A) The motility coefficients from simulations in which nmotor was varied independently of other parameters are shown (nmotor = 100, 500, and 1000 and n = 8, 8, and 60 simulated cells). All simulations were run with nclutch = 750 and ψpol = 0.9, and all other parameter values were reported in Table S1. (B) The velocities from the simulation conditions in (A) are shown. (C) The motility coefficients for U251 glioma cells treated with complete media (control) or 15 μM Y-27632 (n = 87, 112 cells) are given.(D) The velocities from the experimental conditions in (C) are shown. Individual motility coefficients and velocities were obtained from fits to Eq. 2. The error bars represent mean ± SEM, NS denotes no significant difference, and p > 0.01 by one-way Kruskal-Wallis ANOVA. Pairwise statistics for (A and B) are reported in Table S2. To see this figure in color, go online.
Figure 6
Figure 6
Simulated and experimental predictions of the effects of actin polymerization inhibitors on confined glioma cell migration. (A) The motility coefficients for U251 cells expressing eGFP-β-actin and treated with vehicle control (DMSO) or 50 or 500 nM LatA are shown (n = 78, 81, 23 cells). (B) The velocities for the experimental conditions in (A) are shown. (C) The motility coefficients from simulations using a reference parameter set (Table S1; vactin,max = 200 nm s−1, kcap = 0.001 s−1) or simulations in which vactin,max was reduced (vactin,max = 120 nm s−1) or in which kcap was increased (kcap = 0.01 s−1) are shown (n = 60, 28, and 24 simulations). All simulations had nmotor = 1000, nclutch = 750, and ψpol = 0.9, and all other parameter values are reported in Table S1. (D) The velocities from the simulations in (C) are shown. Individual motility coefficients and velocities were obtained from fits to Eq. 2. The error bars represent mean ± SEM, NS denotes no significant difference, and p > 0.01 by one-way Kruskal-Wallis ANOVA. To see this figure in color, go online.
Figure 7
Figure 7
Simulated and experimental predictions of the effects of MTAs on confined glioma cell migration. (A) The motility coefficients for U251 cells treated with vehicle control (DMSO), 100 nM PTX, or 100 nM VBL (n = 58, 52, and 50 cells) are shown. (B) The velocities from the experiments in (A) are shown. (C) The motility coefficients from simulations using a reference parameter set (Table S1; knuc,0 = 1 s−1) or in which knuc,0 was increased (knuc,0 = 10 s−1) are shown (n = 60, 28 simulations). All simulations had nmotor = 1000, nclutch = 750, and ψpol = 0.9, and all other parameter values were reported in Table S1. (D). The velocities from the simulations in (C) are shown. Individual motility coefficients and velocities were obtained from fits to Eq. 2. The error bars represent mean ± SEM, NS denotes no significant difference, and p > 0.01 by Kruskal-Wallis one-way ANOVA. To see this figure in color, go online.

Similar articles

Cited by

References

    1. Lefranc F., Brotchi J., Kiss R. Possible future issues in the treatment of glioblastomas: special emphasis on cell migration and the resistance of migrating glioblastoma cells to apoptosis. J. Clin. Oncol. 2005;23:2411–2422. - PubMed
    1. Lauffenburger D.A., Horwitz A.F. Cell migration: a physically integrated molecular process. Cell. 1996;84:359–369. - PubMed
    1. Prahl L.S., Odde D.J. Modeling cell migration mechanics. Adv. Exp. Med. Biol. 2018;1092:159–187. - PubMed
    1. DiMilla P.A., Barbee K., Lauffenburger D.A. Mathematical model for the effects of adhesion and mechanics on cell migration speed. Biophys. J. 1991;60:15–37. - PMC - PubMed
    1. Danuser G., Allard J., Mogilner A. Mathematical modeling of eukaryotic cell migration: insights beyond experiments. Annu. Rev. Cell Dev. Biol. 2013;29:501–528. - PMC - PubMed

Publication types