. 2020 Mar;13(3):100743.
doi: 10.1016/j.tranon.2020.01.004. Epub 2020 Mar 4.

Gemcitabine Recruits M2-Type Tumor-Associated Macrophages into the Stroma of Pancreatic Cancer

Affiliations

Gemcitabine Recruits M2-Type Tumor-Associated Macrophages into the Stroma of Pancreatic Cancer

Ashenafi Bulle et al. Transl Oncol. 2020 Mar.

Abstract

Background: Pancreatic ductal adenocarcinoma (PDAC) is a very lethal disease that can develop therapy resistance over time. The dense stroma in PDAC plays a critical role in tumor progression and resistance. How this stroma interacts with the tumor cells and how this is influenced by chemotherapy remain poorly understood.

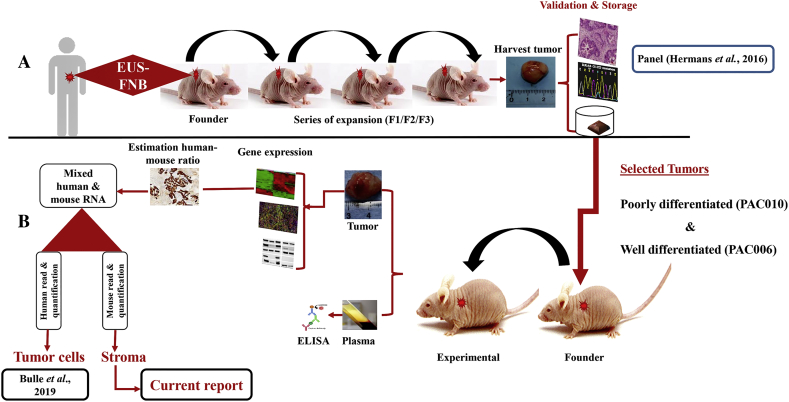
Methods: The backbone of this study is the parallel transcriptome analysis of human tumor and mouse stroma in two molecular and clinical representative patient-derived tumor xenografts models. Mice (8 animals per group) were treated for 4 weeks with gemcitabine or control. We studied tumor growth, RNA expression in the stroma, tumor-associated macrophages (TAMs) with immunofluorescence, and cytokines in the serum.

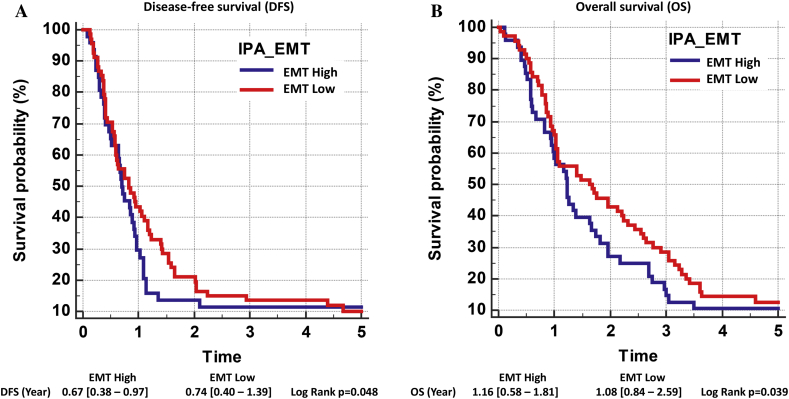
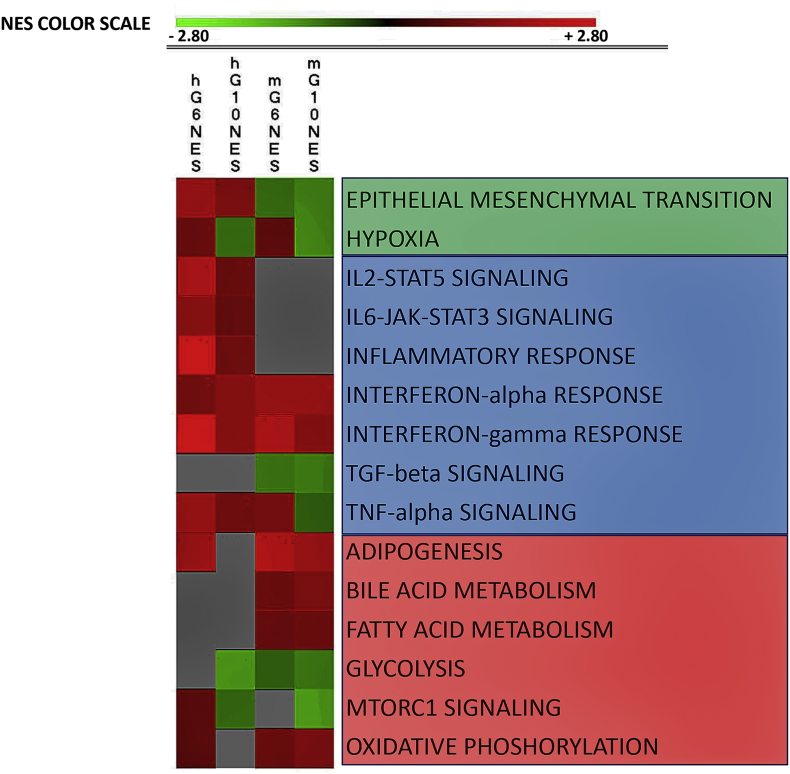
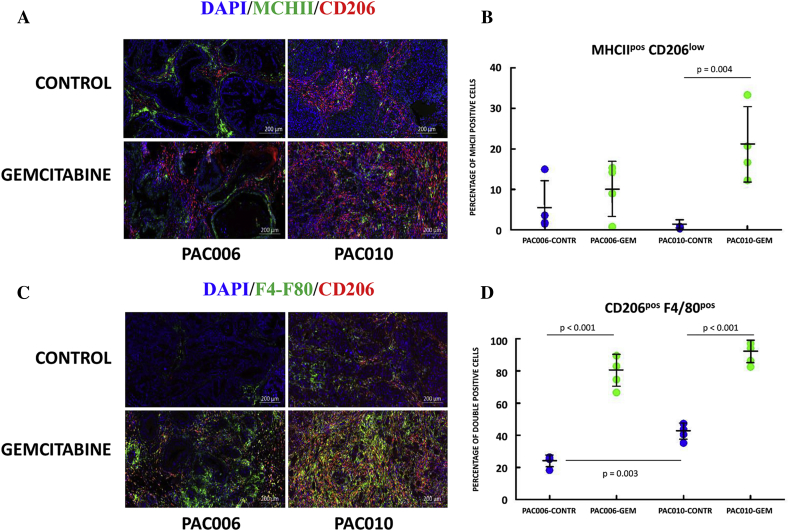
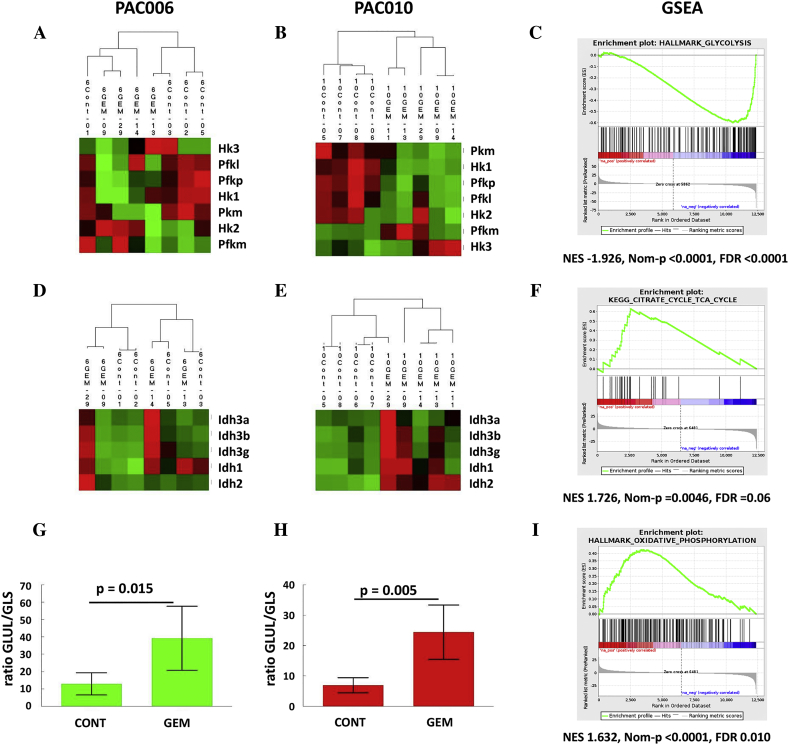
Results: A method for parallel transcriptome analysis was optimized. We found that the tumor (differentiation, gene expression) determines the infiltration of macrophages into the stroma. In aggressive PDAC (epithelial-to-mesenchymal transition high), we find more M2 polarized TAMs and the activation of cytokines and growth factors (TNFα, TGFβ1, and IL6). There are increased stromal glycolysis, reduced fatty acid oxidation, and reduced mitochondrial oxidation (tricarboxylic acid cycle and oxidative phosphorylation). Treatment with gemcitabine results in a shift of innate immune cells, especially additional infiltration of protumoral M2 TAMs (P < .001) and metabolic reprogramming.

Conclusions: Gemcitabine treatment of PDAC xenografts stimulates a protumoral macrophage phenotype, and this, in combination with a shift of the tumor cells to a mesenchymal phenotype that we reported previously, contributes to tumor progression and therapeutic resistance. Targeting M2-polarized TAMs may benefit PDAC patients at risk to become refractory to current anticancer regimens.


Figures

Figure 1
Figure 1
Schematic representation of the study design: generation of patient-derived PDAC xenografts and their molecular characterization. (A) Establishment and validation design of patient-derived PDAC xenograft. (B) Molecular and histochemical characterization of the tumor cells and the stroma in models and in response to treatment.
Figure 2
Figure 2
Survival analysis of human PDAC classified using IPA-EMT gene set. Hierarchical clustering was performed on 118 PDAC patients data retrieved from NCBI (GSE62165) using 55 EMT-associated genes [12]. H -settings: RNA expression = 2log values; dissimilarity = Pearson’s distance, HC = complete linkage, normalized rows = Z-score, seriation = multifragment heuristics. This signature could separate the patients into two groups (EMT-high patients and EMT-low patients). Using corresponding survival data and log-rank test, disease-free survival (DFS) and overall survival (OS) of these 118 patients were analyzed [25].
Figure 3
Figure 3
Graphic presentation of top enriched Hallmark gene sets in tumors and in the corresponding stroma as result of gemcitabine treatment. We analyzed the differential expressed genes for four conditions: (A) hG6NES: tumor PAC006 GEM-treated versus control, (B) hG10NES: tumor PAC010 GEM-treated versus control, (C) mG6NES: stroma PAC006 GEM-treated versus control, and (D) mG10NES: stroma PAC010 GEM-treated versus control. GSEA was used to identify Hallmark gene sets (for full list, see Supplementary Tables 1, A and B, and 2, A and B). The majority of the top gene sets could be functionally grouped into three main groups; they are presented using the normalized enrichment score (NES with P value < .05). The NES is indicated by a color; the intensity is scaled within each row so that the highest enrichment score corresponds to bright red and suppression to bright green. Gray: NES not significant (uncorrected P value > .05).
Figure 4
Figure 4
Immunofluorescence staining of PDTX-PDAC tumor sections. Representative images for (A) DPI/MHCII/CD206 and (C) DPI/F4/80/CD206 from placebo- and gemcitabine-treated PDTX mice. Original magnification of histological images  × 10; scale bar 200  μm. The graphs indicate percentage of cells stained for (B) M1-type MHCIIposCD206low macrophages or (D) double-positive M2-type CD206posF4/80pos macrophages. Sections were stained with DAPI, and percentage was calculated to the total number of cells using QuPath software. Each staining is representative for the analysis of tumor sections of four animals per group.
Figure 5
Figure 5
Changes in metabolic gene expression in PAC006 and PAC010 induced by gemcitabine. Hierarchical clustering of rate-limiting enzymes of glycolysis in (A) PAC006 and (B) PAC010. (C) Downregulation of glycolysis is confirmed by GSEA (e.g., PAC010). Key enzymes of TCA cycle are shown in (D) for PAC006 and (E) for PAC010. GSEA demonstrates enrichment of KEGG-TCA pathway (PAC006). The ratio of GLUL/GLS as marker for the use of glutamine to fuel the TCA cycle; (G) PAC006 and (H) PAC010. GSEA indicates a strong enrichment of (I) oxidative phosphorylation. The heat map shows the relative mRNA expression in glycolysis and TCA cycle of the mouse genes in the stroma in response to treatment of the xenografts. The red (high), black (middle), and green (low) colors indicate the relative expression intensity of each gene within a sample.

References

    1. Luo G, Long J, Zhang B, Liu C, Xu J, Ni Q, Yu X. Stroma and pancreatic ductal adenocarcinoma: an interaction loop. Biochimica Biophysica Acta. 2012;1826:170–178. - PubMed
    1. Feig C, Gopinathan A, Gopinathan A, Neesse A, Chan DS, Cook N, Tuveson DA. The pancreas cancer microenvironment. Clin Cancer Res. 2012;18(16):4266–4276. - PMC - PubMed
    1. Bonde AK, Tischler V, Kumar S, Soltermann A, Schwendener RA. Intratumoral macrophages contribute to epithelial-mesenchymal transition in solid tumors. BMC Cancer. 2012;12 - PMC - PubMed
    1. Hamada S, Masamune A, Shimosegawa T. Alteration of pancreatic cancer cell functions by tumor-stromal cell interaction. Front Physiol. 2013;4:318. - PMC - PubMed
    1. Kota J, Hancock J, Kwon J, Korc M. Pancreatic cancer: stroma and its current and emerging targeted therapies. Cancer Lett. 2017;391:38–49. - PubMed