. 2020 Jul;7(7):e491-e503.
doi: 10.1016/S2352-3018(20)30033-3. Epub 2020 Mar 5.

Ending the HIV epidemic in the USA: an economic modelling study in six cities

Collaborators, Affiliations

Ending the HIV epidemic in the USA: an economic modelling study in six cities

Bohdan Nosyk et al. Lancet HIV. 2020 Jul.

Abstract

Background: The HIV epidemic in the USA is a collection of diverse local microepidemics. We aimed to identify optimal combination implementation strategies of evidence-based interventions to reach 90% reduction of incidence in 10 years, in six US cities that comprise 24·1% of people living with HIV in the USA.

Methods: In this economic modelling study, we used a dynamic HIV transmission model calibrated with the best available evidence on epidemiological and structural conditions for six US cities: Atlanta (GA), Baltimore (MD), Los Angeles (CA), Miami (FL), New York City (NY), and Seattle (WA). We assessed 23 040 combinations of 16 evidence-based interventions (ie, HIV prevention, testing, treatment, engagement, and re-engagement) to identify combination strategies providing the greatest health benefit while remaining cost-effective. Main outcomes included averted HIV infections, quality-adjusted life-years (QALYs), total cost (in 2018 US$), and incremental cost-effectiveness ratio (ICER; from the health-care sector perspective, 3% annual discount rate). Interventions were implemented at previously documented and ideal (90% coverage or adoption) scale-up, and sustained from 2020 to 2030, with outcomes evaluated until 2040.

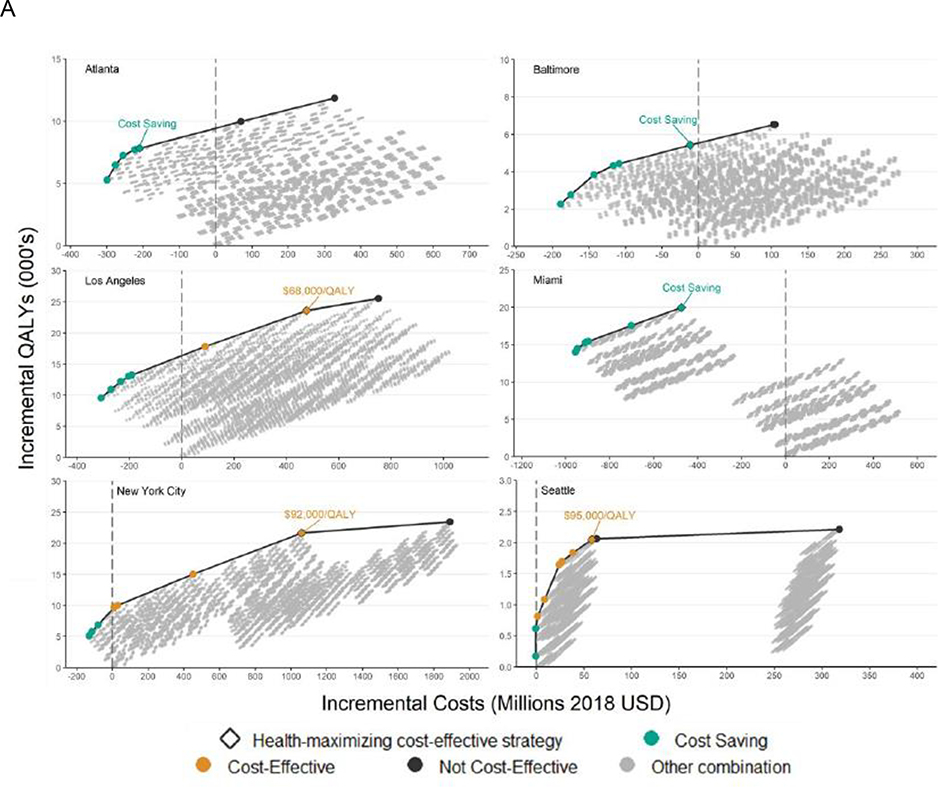
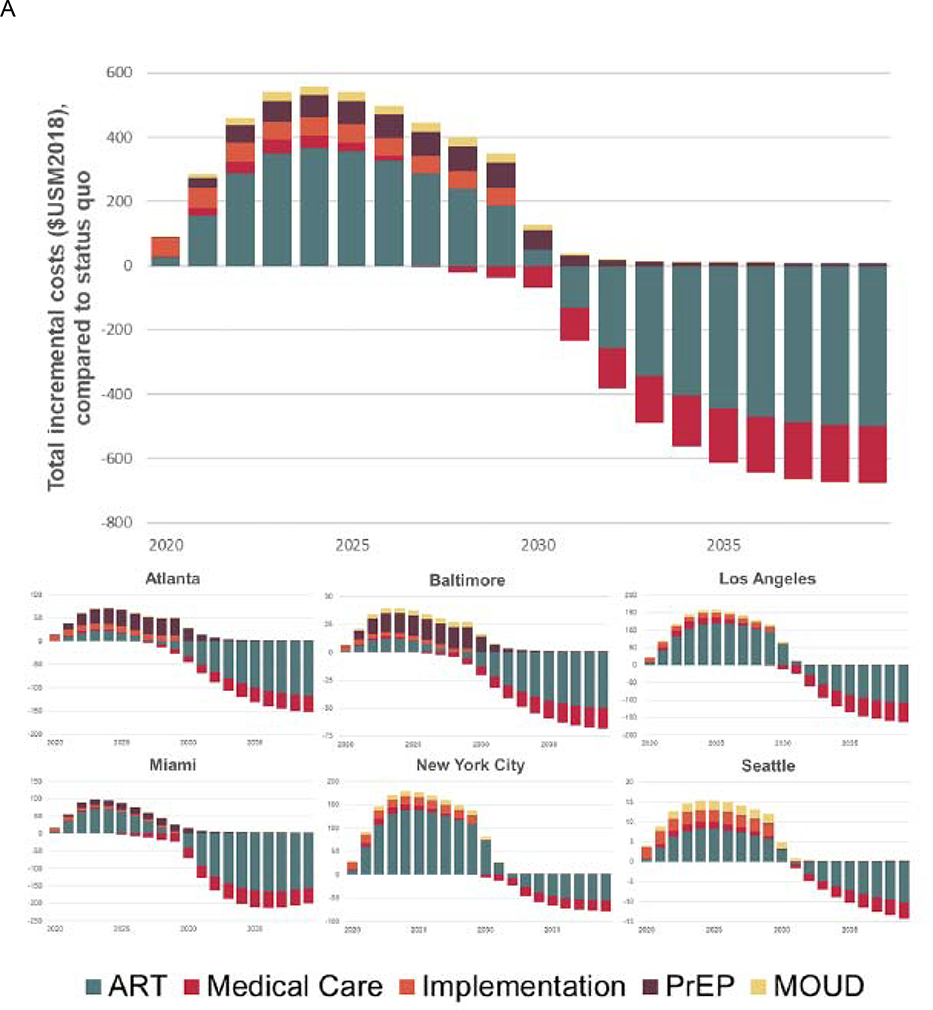
Findings: Optimal combination strategies providing health benefit and cost-effectiveness contained between nine (Seattle) and 13 (Miami) individual interventions. If implemented at previously documented scale-up, these strategies could reduce incidence by between 30·7% (95% credible interval 19·1-43·7; Seattle) and 50·1% (41·5-58·0; New York City) by 2030, at ICERs ranging from cost-saving in Atlanta, Baltimore, and Miami, to $95 416 per QALY in Seattle. Incidence reductions reached between 39·5% (26·3-53·8) in Seattle and 83·6% (70·8-87·0) in Baltimore at ideal implementation. Total costs of implementing strategies across the cities at previously documented scale-up reached $559 million per year in 2024; however, costs were offset by long-term reductions in new infections and delayed disease progression, with Atlanta, Baltimore, and Miami projecting cost savings over the 20 year study period.

Interpretation: Evidence-based interventions can deliver substantial public health and economic value; however, complementary strategies to overcome social and structural barriers to HIV care will be required to reach national targets of the ending the HIV epidemic initiative by 2030.

Funding: National Institutes of Health.


Figures

Figure 1.
Figure 1.. Panel A: City-level health production functions comprising optimal combinations of interventions for different investment levels; Panel B: Composition of optimal combination implementation strategies delivered at previously-documented scale-up
Panel A) ICER – Incremental cost-effectiveness ratio; CS – Cost-saving; QALY – Quality adjusted life year. All costs and benefits in present value and accrued over a 20-year study time horizon with interventions implemented for a 10-year period. Health production functions were created by plotting the cost and effects of all combinations of interventions, with each curve displaying the maximum possible health benefits (number of QALYs gained, 2020–2040) at a given cost, for each city. The incremental cost-effectiveness of each strategy along the curve was compared to the next-most costly strategy on the health production function, and ICERs were categorized as: cost-saving (greater health benefits and lower costs versus comparator); cost-effective (ICER < $100,000 per QALY gained; or not cost-effective (ICER > $100,000 per QALY gained). See supplementary material for full details. Panel B) MOUD – Medication for opioid use disorder; PrEP – Pre-exposure prophylaxis; MSM – Men who have sex with men; ER – Emergency room; EMR – Electronic medical records; ARTAS – Antiretroviral treatment and access to services; ART – Antiretroviral therapy; RAPID – Rapid ART Program for Individuals with an HIV Diagnosis. Each row represents one intervention and each column represents a city. The shading indicates whether an intervention was selected for a given city. Green indicates an intervention should be implemented or scaled up, yellow indicates it should not be implemented or increased beyond existing service levels.
Figure 2.
Figure 2.. Projected reductions in HIV incidence at status quo service levels compared to implementation of optimal strategies at previously-documented scale-up and ideal implementation
The 5- and 10-year targets correspond to 75% and 90% reductions in the number of new HIV infections in each city in 2025 and 2030, compared to 2020. The 2020 projections were constructed by holding all health services at their 2015 levels except for PrEP which was held at 2017 levels while accounting for externally reported population growth and demographic shifts in each city. More details regarding the construction of status quo scenarios can be found in a previous study. The blue shaded band surrounding the ideal implementation scenario incidence estimates represented the 95% credible interval on the optimal combination implementation scenario, derived from probabilistic sensitivity analysis. Credible intervals on the status quo and previously-documented scale-up estimates are suppressed for clarity, and presented in the supplementary appendix.
Figure 3.
Figure 3.. Panel A: Estimated annual incremental costs of implementing optimal combination implementation strategies, delivered at previously-documented scale-up, by source: 2020–2040; Panel B: Total incremental costs of implementing optimal combination implementation strategies, delivered at previously-documented scale-up, by source over the 10-year sustainment period*
ART – Antiretroviral therapy; PrEP – Pre-exposure prophylaxis; MOUD – Medication for opioid use disorder. Costs are shown incrementally for each year, relative to projected status quo spending levels in a given year. * We note that the impact on medical care costs of the highest-value combination implementation strategies in Atlanta, Baltimore and Miami was cost-saving and offset medical care costs in other cities. Total discounted costs are presented in present value using a 3% annual discount rate.

Comment in

  • Ending the HIV epidemic in the USA.
    Nichols BE, Kissler SM. Nichols BE, et al. Lancet HIV. 2020 Jul;7(7):e454-e455. doi: 10.1016/S2352-3018(20)30051-5. Epub 2020 Mar 5. Lancet HIV. 2020. PMID: 32145761 No abstract available.

References

    1. Centers for Disease Control and Prevention (CDC). HIV surveillance--United States, 1981–2008. MMWR Morbidity and mortality weekly report 2011; 60(21): 689. - PubMed
    1. Centers for Disease Control and Prevention (CDC). HIV Surveillance Report, 2017; vol. 29 Atlanta, GA: U.S. Department of Health and Human Services, 2018.
    1. El-Sadr WM, Mayer KH, Rabkin M, Hodder SL. AIDS in America - Back in the Headlines at Long Last. N Engl J Med 2019; 380(21): 1985–7. - PMC - PubMed
    1. Hess KL, Hu X, Lansky A, Mermin J, Hall HI. Lifetime risk of a diagnosis of HIV infection in the United States. Ann Epidemiol 2017; 27(4): 238–43. - PMC - PubMed
    1. Fauci AS, Redfield RR, Sigounas G, Weahkee MD, Giroir BP. Ending the HIV epidemic: a plan for the United States. Journal of the American Medical Association 2019; 321(9): 844–5. - PubMed

Publication types