. 2020 Apr:120:164-178.
doi: 10.1016/j.molimm.2020.02.002. Epub 2020 Mar 6.

Aryl hydrocarbon receptor-induced activation of the human IGH hs1.2 enhancer: Mutational analysis of putative regulatory binding motifs

Affiliations

Aryl hydrocarbon receptor-induced activation of the human IGH hs1.2 enhancer: Mutational analysis of putative regulatory binding motifs

Andrew D Snyder et al. Mol Immunol. 2020 Apr.

Abstract

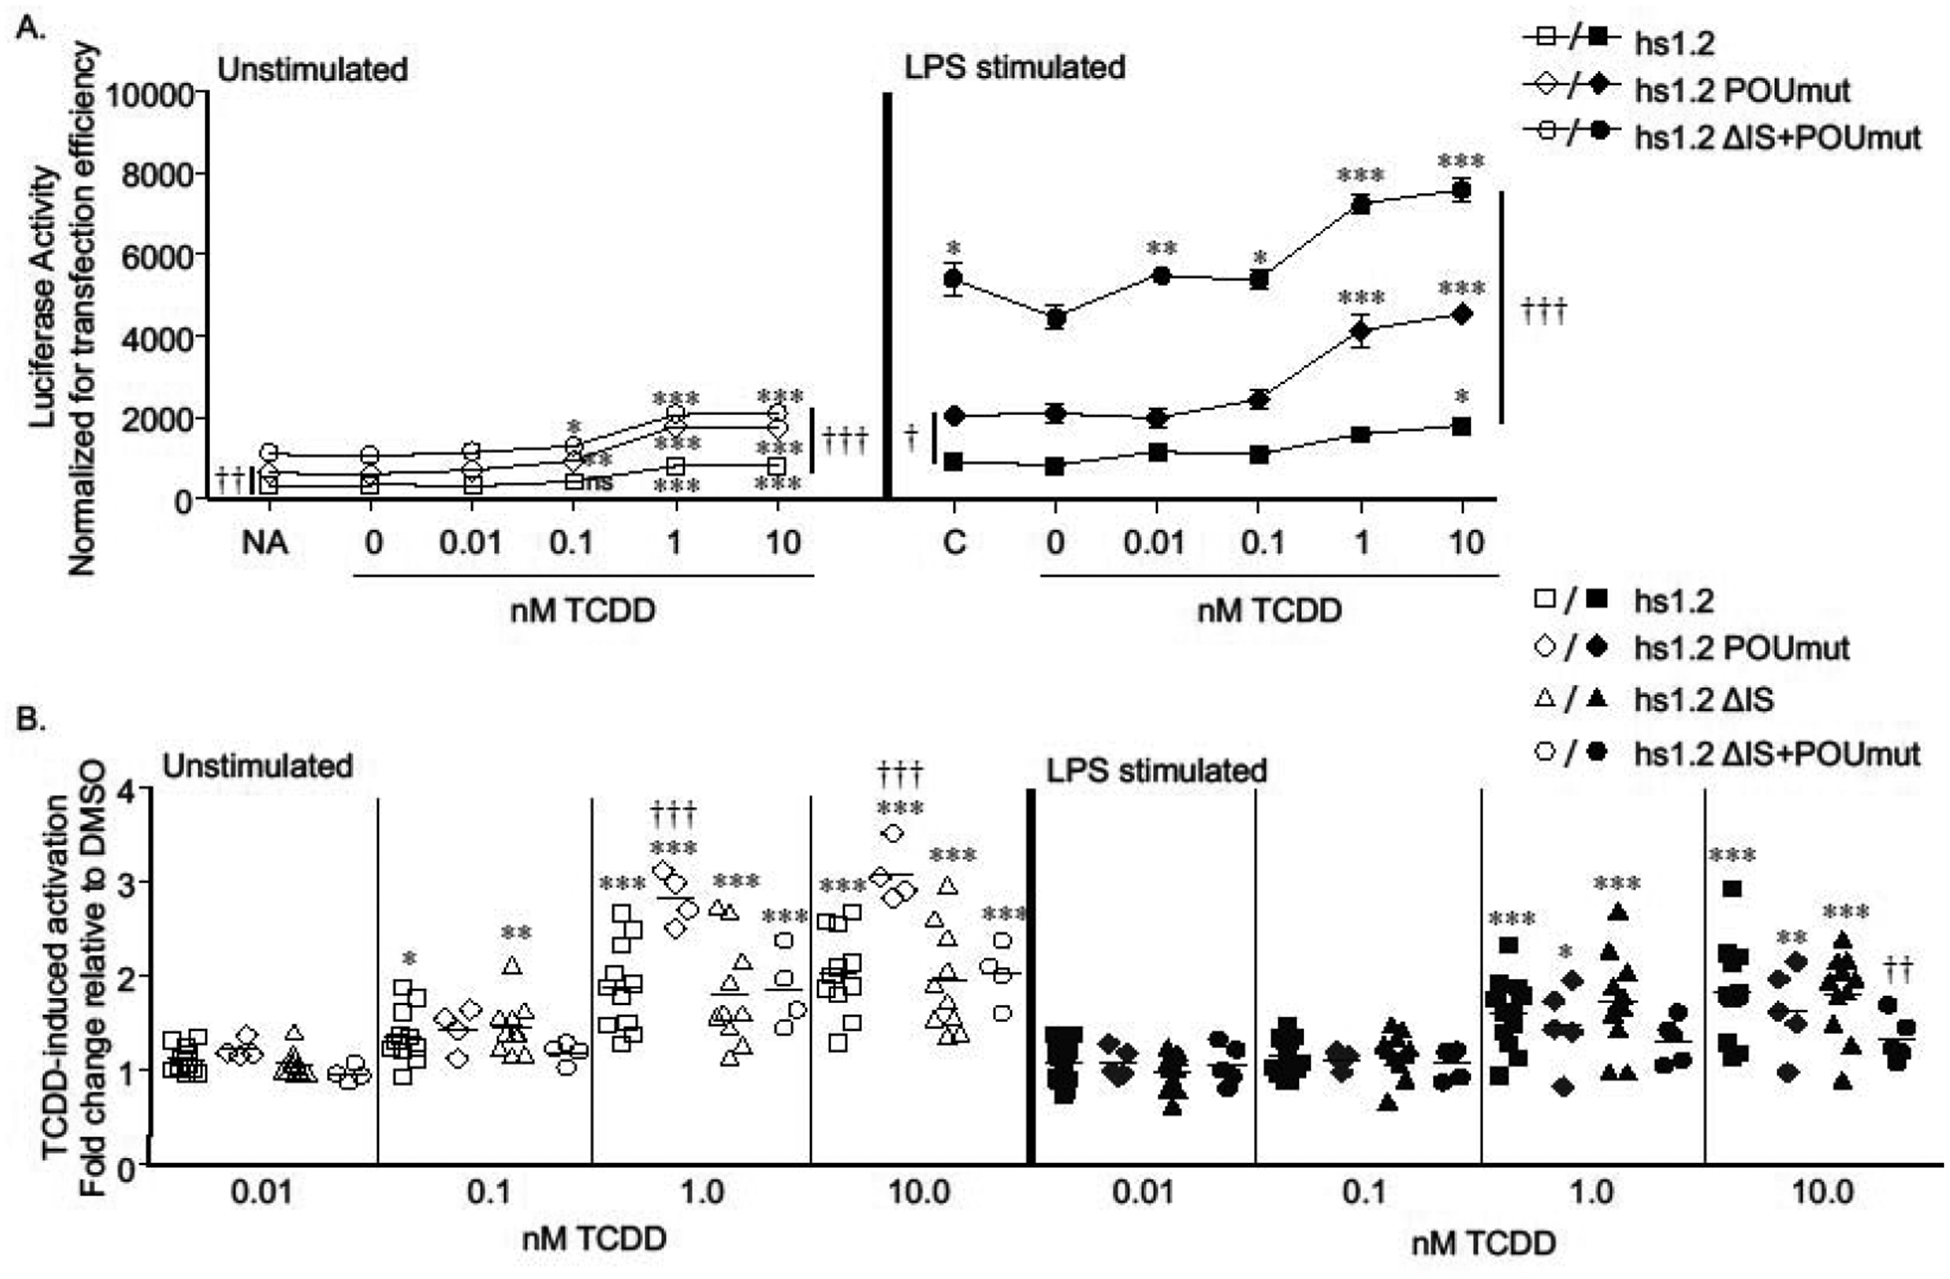
The human hs1.2 enhancer within the Ig heavy chain gene (IGH) is polymorphic and associated with a number of autoimmune diseases. The polymorphic region is characterized by tandem repeats of an ∼53-bp invariant sequence containing possible binding sites for several transcription factors. Our previous studies suggest the human hs1.2 enhancer is sensitive to 2,3,7,8-tetrachlorodibenzo-p-dioxin (TCDD), an environmental toxicant and high affinity ligand of the aryl hydrocarbon receptor (AhR). TCDD induced hs1.2 enhancer activity in an AhR-dependent manner and the number of invariant sequences influenced the magnitude of activity. To better understand the regulation of human hs1.2 enhancer activity, the objective of the current study was to utilize mutational analysis and luciferase reporter constructs to evaluate the contribution of putative transcription factor binding sites to overall hs1.2 enhancer activity and modulation by TCDD. Basal and LPS-induced activity of the hs1.2 enhancer appeared to be most affected by mutation of sites outside of the invariant sequence or deletion of the entire invariant sequence; whereas sites influencing the effect of TCDD were dependent on the cellular activation state (i.e. unstimulated vs. LPS stimulation) and relatively independent of the putative AhR binding site within the invariant sequence. These results suggest that AhR activation affects human hs1.2 activity through an as yet undetermined non-canonical pathway. A better understanding regarding the role of the hs1.2 enhancer in human Ig expression and how AhR ligands modulate its activity may lead to insights into overall Ig regulation and mechanisms of dysfunction.

Keywords: 3′IGH regulatory region; Aryl hydrocarbon receptor; Gene regulation; Immunoglobulin; TCDD; Transcription factors.


Figures

Figure 1.
Figure 1.. Comparison of the mouse and human Ig heavy chain genes.
A) Mouse Ig heavy chain gene and B) human Ig heavy chain gene with the possible hs1.2 enhancer alleles found in the human population. The hs1.2 enhancer (underlined) is sensitive to AhR ligands and the human hs1.2 enhancer is polymorphic with 1 to 4 ~53 bp invariant sequence repeats (denoted by asterisks), which represent the different alleles (i.e. A, B, C, or D). VH, variable heavy chain promoter; VDJ, variable region; Eμ, intronic or μ enhancer; Greek letters, constant regions (IGHC) encoding different heavy chain isotypes (e.g. α encodes the heavy chain protein for IgA); open rectangles, germline promoters upstream of each constant region; 3′IghRR, mouse 3′Igh regulatory region (A); 3 ′IGHRR, human 3′IGH regulatory region (B). C) Human and mouse hs1.2 enhancers with predicted binding sites (Michaelson et al. 1996, Mills et al. 1997, Chen and Birshtein 1997, Denizot et al. 2001, Kim et al. 2004, Sepulveda et al. 2005, Giambra et al. 2005, Fernando et al. 2012). Adjacent transcription factor binding sites are italicized and underlined with nucleotides overlapping two binding sites in smaller case.
Figure 2.
Figure 2.. Mutation of the core DRE binding motif within the invariant sequence has little effect on overall transcriptional activity of the human hs1.2 enhancer.
CH12.LX cells were transiently transfected with a luciferase reporter regulated by the wildtype hs1.2 enhancer (hs1.2) or the hs1.2 enhancer with a mutated core DRE binding site. Transfected cells were either cultured in the absence of any additional treatment (naïve, NA) or treated for 24 hr with 0.01% DMSO vehicle (0 nM TCDD) or TCDD (0.01–10 nM) in the absence or presence of LPS (0.1 μg/ml) stimulation. C represents the LPS alone control. A) Luciferase activity (mean ± SEM, n≥3) is represented as the relative light units (RLU) normalized to transfection efficiency. Results are representative of at least 4 separate experiments. B) TCDD-induced activation is represented on the y-axis as fold change relative to the DMSO vehicle. Results (mean ± SEM) were generated from separate experiments (N≥4); a horizontal line represents the overall fold-change mean. Comparisons between treatment groups of the same reporter plasmid were analyzed using a 1-way ANOVA followed by a Dunnett’s Multiple Comparison post-test. Significant differences in luciferase activity or TCDD-induced fold change compared to the corresponding vehicle control are represented by “*”, “**”, or “***” denoting significance at p<0.05, p<0.01 or p<0.001, respectively. Comparisons between reporter plasmids were analyzed using a 2-way ANOVA with a Bonferroni post-test. “†”, “††”, or “†††” denotes a significant difference compared to hs1.2 at p<0.05, p<0.01 or p<0.001, respectively. A vertical bar represents a significant difference for all treatment groups.
Figure 3.
Figure 3.. Mutation of the NF1 binding site within the invariant sequence has little effect on overall transcriptional activity but decreases LPS- and TCDD-induced activation of the human hs1.2 enhancer.
CH12.LX cells were transiently transfected with a luciferase reporter regulated by the wildtype hs1.2 enhancer (hs1.2) or the hs1.2 enhancer with a mutated NF1 binding site. Transfected cells were either cultured in the absence of any additional treatment (naïve, NA) or treated for 24 hr with 0.01% DMSO vehicle (0 nM TCDD) or TCDD (0.01–10 nM) in the absence or presence of LPS (0.1 μg/ml) stimulation. C represents the LPS alone control. A) Luciferase activity (mean ± SEM, n≥3) is represented as the relative light units (RLU) normalized to transfection efficiency. Results are representative of at least 4 separate experiments. B) TCDD-induced activation is represented on the y-axis as fold change relative to the DMSO vehicle. Results (mean ± SEM) were generated from separate experiments (N≥4); a horizontal line represents the overall fold-change mean. Comparisons between treatment groups of the same reporter plasmid were analyzed using a 1-way ANOVA followed by a Dunnett’s Multiple Comparison post-test. Significant differences in luciferase activity or TCDD-induced fold change compared to the corresponding vehicle control are represented by “*”, “**”, or “***” denoting significance at p<0.05, p<0.01 or p<0.001, respectively. Comparisons between reporter plasmids were analyzed using a 2-way ANOVA with a Bonferroni post-test. “†”, “††”, or “†††” denotes a significant difference compared to hs1.2 at p<0.05, p<0.01 or p<0.001, respectively. A vertical bar represents a significant difference for all treatment groups.
Figure 4.
Figure 4.. Mutation of the Sp-1.1 binding sites increases overall transcriptional activity of the human hs1.2 enhancer.
CH12.LX cells were transiently transfected with a luciferase reporter regulated by the wildtype hs1.2 enhancer (hs1.2) or the hs1.2 enhancer with the Sp-1.1 site mutated (Sp-1.1mut). Transfected cells were either cultured in the absence of any additional treatment (naïve, NA) or treated for 24 hr with 0.01% DMSO vehicle (0 nM TCDD) or TCDD (0.01–10 nM) in the absence or presence of LPS (0.1 μg/ml) stimulation. C represents the LPS alone control. A) Luciferase activity (mean ± SEM, n≥3) is represented as the relative light units (RLU) normalized to transfection efficiency. Results are representative of at least 5 separate experiments. B) TCDD-induced activation is represented on the y-axis as fold change relative to the DMSO vehicle. Results (mean ± SEM) were generated from separate experiments (N=5); a horizontal line represents the overall fold-change mean. Comparisons between treatment groups of the same reporter plasmid were analyzed using a 1-way ANOVA followed by a Dunnett’s Multiple Comparison post-test. Significant differences in luciferase activity or TCDD-induced fold change compared to the corresponding vehicle control are represented by “*”, “**”, or “***” denoting significance at p<0.05, p<0.01 or p<0.001, respectively. Comparisons between reporter plasmids were analyzed using a 2-way ANOVA with a Bonferroni post-test. “†”, “††”, or “†††” denotes a significant difference compared to hs1.2 at p<0.05, p<0.01 or p<0.001, respectively. A vertical bar represents a significant difference for all treatment groups.
Figure 5.
Figure 5.. Mutation of the POU site increases overall transcriptional activity and TCDD-induced activation of the human hs1.2 enhancer.
CH12.LX cells were transiently transfected with a luciferase reporter regulated by the wildtype hs1.2 enhancer (hs1.2) or the hs1.2 enhancer with either a mutated POU binding site (POUmut), deletion of the invariant sequence (ΔIS), or a combined POU mutation and IS deletion (ΔIS+POUmut). Transfected cells were either cultured in the absence of any additional treatment (naïve, NA) or treated for 24 hr with 0.01% DMSO vehicle (0 nM TCDD) or TCDD (0.01–10 nM) in the absence or presence of LPS (0.1 μg/ml) stimulation. C represents the LPS alone control. A) Luciferase activity (mean ± SEM, n≥3) is represented as the relative light units (RLU) normalized to transfection efficiency. Results are representative of at least 4 separate experiments. B) TCDD-induced activation is represented on the y-axis as fold change relative to the DMSO vehicle. Results (mean ± SEM) were generated from separate experiments (N≥4); a horizontal line represents the overall fold-change mean. Comparisons between treatment groups of the same reporter plasmid were analyzed using a 1-way ANOVA followed by a Dunnett’s Multiple Comparison post-test. Significant differences in luciferase activity or TCDD-induced fold change compared to the corresponding vehicle control are represented by “*”, “**”, or “***” denoting significance at p<0.05, p<0.01 or p<0.001, respectively. Comparisons between reporter plasmids were analyzed using a 2-way ANOVA with a Bonferroni post-test. “†”, “††”, or “†††” denotes a significant difference compared to hs1.2 at p<0.05, p<0.01 or p<0.001, respectively. A vertical bar represents a significant difference for all treatment groups for the two reporter plasmids indicated by the ends of the bar.
Figure 6.
Figure 6.. Mutational analysis summary and proposed transcriptional regulation for TCDD-induced hs1.2 enhancer activity.
A) Schematic summarizing the specific mutations/deletions and the resulting effect on TCDD-induced hs1.2 enhancer activity in unstimulated (Unstim) or LPS-stimulated (LPS) CH12.LX cells. Boxes represent putative transcription factor binding sites; mutations or deletions are indicated by gray or black filled boxes, respectively. The number of arrows indicates the degree of effect. Downward or upward arrows indicate decreased or increased TCDD-induced fold change compared to the wildtype hs1.2 enhancer, respectively; NC indicates no change from the wildtype hs1.2 enhancer. B) Proposed transcriptional regulation of TCDD-induced hs1.2 enhancer activity. Bolded text within thick-outlined boxes indicate transcription factor binding sites we propose to regulate hs1.2 enhancer activity under TCDD-treatment in the absence (TCDD alone) or presence of LPS-stimulation (TCDD + LPS). The plus or minus indicate whether the transcription factor binding site is an activator (+) or suppressor (−) of hs1.2 enhancer activity. Parenthesis enclosing the plus or minus sign indicate a weak effect. We propose that the putative POU, NF1 and to a lesser extent DRE and Sp1.1 binding sites are transcriptional regulators. The NF-1 site is the primary transcriptional mediator of TCDD-induced hs1.2 activation but this is limited to LPS stimulation. The DRE-like site appears to be a weak mediator of TCDD-induced hs1.2 activation in unstimulated cells but does not adequately account for the effect of TCDD in unstimulated cells.
Figure 7.
Figure 7.. Mutation of the AP-1.ETS site decreases overall transcriptional activity of the human hs1.2 enhancer.
CH12.LX cells were transiently transfected with a luciferase reporter regulated by the wildtype hs1.2 enhancer (hs1.2) or the hs1.2 enhancer with a mutated AP-1.ETS binding site (AP-1.ETSmut). Transfected cells were either cultured in the absence of any additional treatment (naïve, NA) or treated for 24 hr with 0.01% DMSO vehicle (0 nM TCDD) or TCDD (0.01–10 nM) in the absence or presence of LPS (0.1 μg/ml) stimulation. C represents the LPS alone control. A) Luciferase activity (mean ± SEM, n≥3) is represented as the relative light units (RLU) normalized to transfection efficiency. Results are representative of at least 3 separate experiments. B) TCDD-induced activation is represented on the y-axis as fold change relative to the DMSO vehicle. Results (mean ± SEM) were generated from separate experiments (N≥3); a horizontal line represents the overall fold-change mean. Comparisons between treatment groups of the same reporter plasmid were analyzed using a 1-way ANOVA followed by a Dunnett’s Multiple Comparison post-test. Significant differences in luciferase activity or TCDD-induced fold change compared to the corresponding vehicle control is represented by “*”, “**”, or “***” denoting significance at p<0.05, p<0.01 or p<0.001, respectively. Comparisons between reporter plasmids were analyzed using a 2-way ANOVA with a Bonferroni post-test. “†††” denotes a significant difference between hs1.2 and hs1.2 AP-1.ETSmut at p<0.001. A vertical bar represents a significant difference for all treatment groups.
Figure 8.
Figure 8.. Transcriptional activity of the hs1.2 enhancer is modulated by the AP-1.ETS and POU binding sites and the invariant sequence.
Box and whisker plots of several independent experiments comparing the fold-change in transcriptional activity in unstimulated and LPS-stimulated CH12.LX cells relative to the basal (unstimulated) activity of the wildtype hs1.2 enhancer for the AP-1.ETSmut, POUmut, ΔIS, or ΔIS+POUmut. The box represents the upper and lower quartile and the horizontal line the median. The whiskers represent the lowest and highest observations. Individual data points are shown and represent the mean fold change from an independent transient transfection experiment of the mutant plasmid compared to the control plasmid (wildtype hs1.2 enhancer). VH alone, variable heavy chain promoter without the hs1.2 enhancer. Dashed line, basal wildtype hs1.2 enhancer activity set to 1. Significant differences in transcriptional activity relative to the basal wildtype hs1.2 enhancer was determined using a 1-way ANOVA followed by a Dunnett’s Multiple Comparison post-test and represented by “†” or “†††”, denoting significance at p<0.05 or p<0.001, respectively.
Figure 9.
Figure 9.. Mutational analysis summary and proposed transcriptional regulation for basal and LPS-stimulated hs1.2 enhancer activity.
A) Schematic summarizing the specific mutations/deletions and the resulting effect on transcriptional activity compared to the wildtype hs1.2 enhancer. Boxes represent putative transcription factor binding sites; mutations or deletions are indicated by gray or black filled boxes, respectively. The number of arrows indicates the degree of effect. Downward arrow indicates decreased transcriptional activity compared to the wildtype hs1.2 enhancer; upward arrow indicates increased activity. For the mutated NF1 binding site, NC/↓ indicates no change in basal activity and a decrease in LPS-stimulated activity. B) Proposed transcriptional regulation of the hs1.2 enhancer. Bolded text within thick-outlined boxes indicate transcription factor binding sites we propose to regulate basal and LPS-stimulated hs1.2 enhancer activity. The plus or minus indicate whether the transcription factor binding site is an activator (+) or suppressor (−) of hs1.2 enhancer activity. Parenthesis enclosing the plus or minus sign indicate a weak effect. Line joining the DRE and κB sites indicates that mutation of both sites was more suppressive then a single mutation of either site alone. The current mutational analysis supports the AP-1.ETS site as a primary activator and the POU site as a major suppressor of basal and LPS-stimulated hs1.2 enhancer activity, while the invariant sequence negatively modulates both the stimulatory effect of AP-1.ETS and the suppressor effect of POU perhaps through the DRE and κB sites and the NF1 site, respectively. We propose that the invariant sequence functions as a fine regulator of hs1.2 enhancer activity.

Similar articles

Cited by

References

    1. Arnold LW, LoCascio NJ, Lutz PM, Pennell CA, Klapper D and Haughton G (1983). “Antigen-induced lymphomagenesis: identification of a murine B cell lymphoma with known antigen specificity.” J Immunol 131(4): 2064–2068. - PubMed
    1. Aupetit C, Drouet M, Pinaud E, Denizot Y, Aldigier JC, Bridoux F and Cogne M (2000). “Alleles of the alpha1 immunoglobulin gene 3′ enhancer control evolution of IgA nephropathy toward renal failure.” Kidney Int 58(3): 966–971. - PubMed
    1. Baccarelli A, Mocarelli P, Patterson DG, Bonzini M, Pesatori AC, Caporaso N, Landi MT (2002). “ Immunologic effects of dioxin: new results from Seveso and comparison with other studies.” Environ Health Perspect 110(12): 1169–73. - PMC - PubMed
    1. Bailey TL, Boden M, Buske FA, Frith M, Grant CE, Clementi L, Ren J, Li WW and Noble WS (2009). “MEME SUITE: tools for motif discovery and searching.” Nucleic Acids Res 37(Web Server issue): W202–208. - PMC - PubMed
    1. Bishop GA (1992). “Signaling to a CD5+ B-cell clone through surface Ig and MHC class II molecules.” Ann N Y Acad Sci 651: 228–240. - PubMed

Publication types

MeSH terms

Substances