

Standardizing Proteomics Workflow for Liquid Chromatography-Mass Spectrometry: Technical and Statistical Considerations
- PMID: 32148359
- PMCID: PMC7059694
- DOI: 10.35248/0974-276x.19.12.496
Standardizing Proteomics Workflow for Liquid Chromatography-Mass Spectrometry: Technical and Statistical Considerations
Abstract
Introduction: The quantitative measurements based on liquid chromatography (LC) coupled with mass spectrometry (MS) often suffer from the problem of missing values and data heterogeneity from technical variability. We considered a proteomics data set generated from human kidney biopsy material to investigate the technical effects of sample preparation and the quantitative MS.
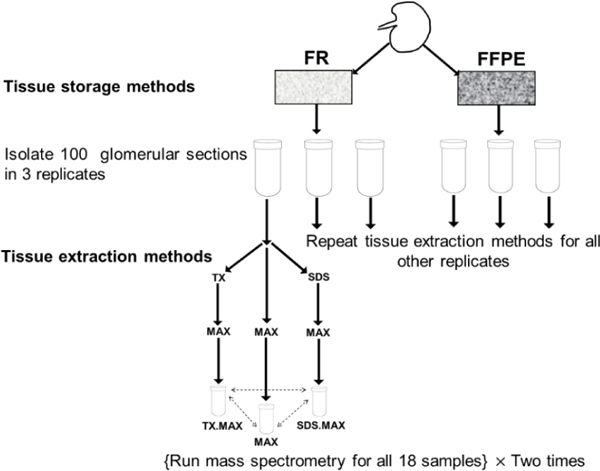
Methods: We studied the effect of tissue storage methods (TSMs) and tissue extraction methods (TEMs) on data analysis. There are two TSMs: frozen (FR) and FFPE (formalin-fixed paraffin embedded); and three TEMs: MAX, TX followed by MAX and SDS followed by MAX. We assessed the impact of different strategies to analyze the data while considering heterogeneity and MVs. We have used analysis of variance (ANOVA) model to study the effects due to various sources of variability.
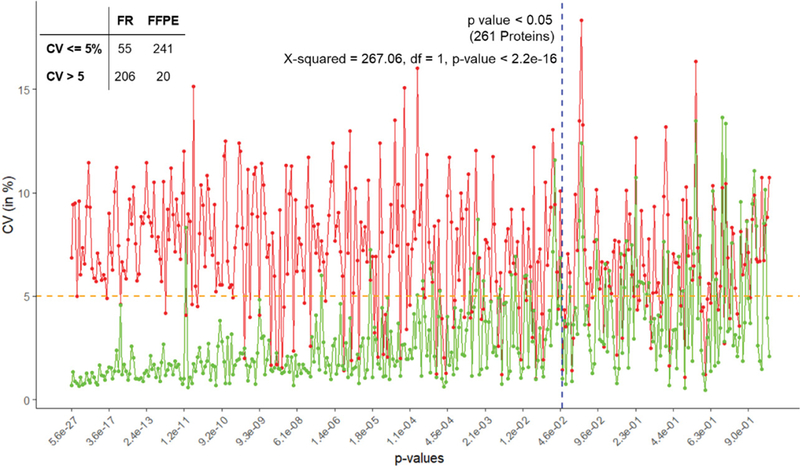
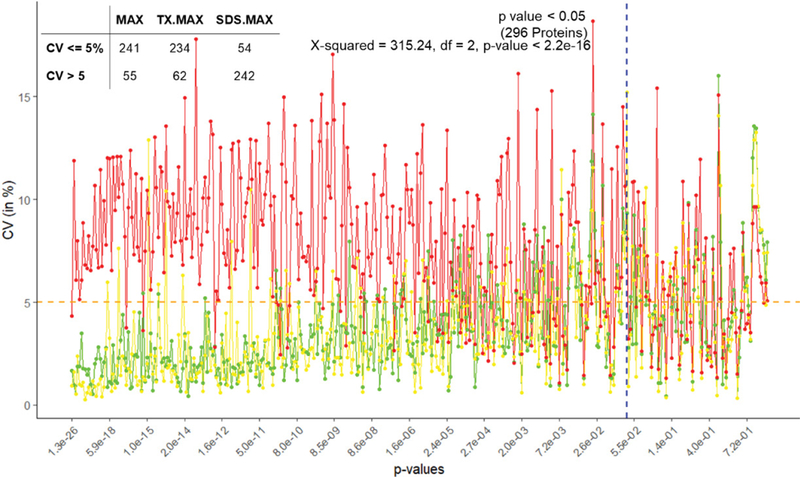
Results and conclusion: We found that the FFPE TSM is better than the FR TSM. We also found that the one-step TEM (MAX) is better than those of two-steps TEMs. Furthermore, we found the imputation method is a better approach than excluding the proteins with MVs or using unbalanced design.
Keywords: ANOVA; Imputation; Proteins; Technical variability; Tissue extraction; Tissue storage.
Conflict of interest statement
Consent for publication All authors have no conflict or disclosures and provide consent for publication.
Figures
References
-
- Anderson NL, Anderson NG (1998) Proteome and proteomics: new technologies, new concepts, and new words. Electrophoresis 19: 1853–1861. - PubMed
-
- Wilkins MR (2009) Hares and tortoises: the high- versus low-throughput proteomic race. Electrophoresis 30: S150–S155. - PubMed
-
- Fliser D, Novak J, Thongboonkerd V, Argiles A, Jankowski V, et al. (2007) Advances in urinary proteome analysis and biomarker discovery. J Am Soc Nephrol 18: 1057–1071. - PubMed
-
- Hanash S (2003) Disease proteomics. Nature 422: 226–232. - PubMed
Grants and funding
LinkOut - more resources
Full Text Sources