. 2020 Jan 16;7(Pt 2):184-192.
doi: 10.1107/S2052252519016695. eCollection 2020 Mar 1.

Cascading transitions toward unconventional charge density wave states in the quasi-two-dimensional monophosphate tungsten bronze P4W16O56

Affiliations

Cascading transitions toward unconventional charge density wave states in the quasi-two-dimensional monophosphate tungsten bronze P4W16O56

Elen Duverger-Nédellec et al. IUCrJ. .

Abstract

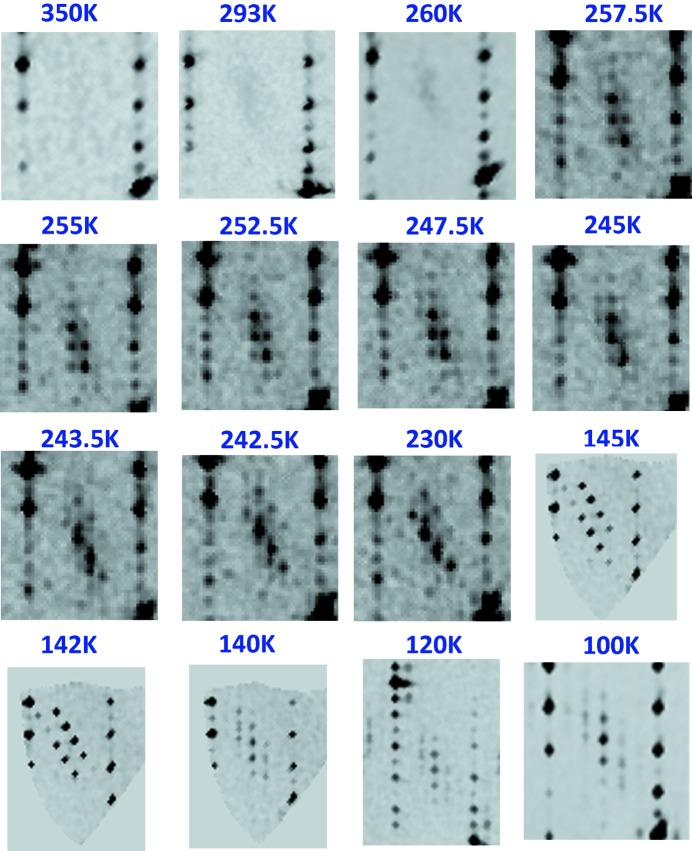
Single crystals of the m = 8 member of the low-dimensional monophosphate tungsten bronzes (PO2)4(WO3)2m family were grown by chemical vapour transport technique and the high crystalline quality obtained allowed a reinvestigation of the physical and structural properties. Resistivity measurements revealed three anomalies at T C1 = 258 K, T C2 = 245 K and T C3 = 140 K, never observed until now. Parallel X-ray diffraction investigations showed a specific signature associated with three structural transitions, i.e. the appearance of different sets of satellite reflections below T C1, T C2 and T C3. Several harmonics of intense satellite reflections were observed, reflecting the non-sinusoidal nature of the structural modulations and a strong electron-phonon coupling in the material. These transitions could be associated with the formation of three successive unconventional charge density wave states.

Keywords: X-ray diffraction; aperiodic structures; charge density waves; inorganic materials; modulated structures; phase transitions; resistivity.


Figures

Figure 1
Figure 1
Previous studies for P4W16O56: XRD pattern obtained by Ottolenghi et al. (1995 ▸) at 37 K and resistivity measurements published by Dumas et al. (2000 ▸). Changes have been applied to the original figure; red circles show the positions of the main reflections and some satellite reflections and axes are highlighted with more contrast.
Figure 2
Figure 2
Resistance temperature dependence for crystals of P4W16O56 for categories SR (a), DS (b) and NO (c).
Figure 3
Figure 3
Resistivity versus temperature for P4W16O56. Red and black curves represent the evolution of the resistivity on heating and on cooling, respectively. Two enlargements of the regions around the temperature of the abrupt resistivity changes are shown (top left and top right). The (0), (1), (2) and (3) notations are associated with the states identified in Section 3.2.
Figure 4
Figure 4
Thermal XRD: the same region of the (h0l)* planes has been measured at different temperatures on cooling.
Figure 5
Figure 5
(h0l)* plane observed in state (1) at 247 K with a scheme explaining the indexing; the unit cell is drawn in red. The measurement was performed on the Bruker–Nonius diffractometer described in the Experimental Section.
Figure 6
Figure 6
(h0l)* plane observed in state (2) at 200 K with a scheme explaining the indexing; the unit cell is drawn in red, q 2 and q2 are the modulation vectors related to the twin domains (a, b, c) and (a′, b′, c′), respectively. Cyan circles show the split second-order satellite reflections. The measurement was performed on the Synergy-S Rigaku diffractometer described in the Experimental Section.
Figure 7
Figure 7
(h0l)* plane observed in state (3) at 100 K with a scheme explaining the indexing; the average unit cell is drawn in red, (q 3 and q3) and (qs 3 and qs3) are the modulation vectors proposed in the discussion of state (3) (see Table 1 ▸). The drawing was carried out using a radius, for each type of reflection, proportional to the structure factors. The measurement was performed on the Synergy-S Rigaku diffractometer described in the Experimental Section.
Figure 8
Figure 8
Resistivity versus temperature for Er5Ir4Si10 for current i // a and i // c. Blue and red curves represent the resistivity on cooling and heating, respectively. More details are provided in the references (Galli et al., 2002; Ramakrishnan & Smaalen, 2017 ▸).

References

    1. Agilent (2014). CrysAlisPro. Agilent Technologies Ltd, Yarnton, Oxfordshire, England.
    1. Bruker (2012). APEX2, SAINT and SADABS. Bruker AXS Inc., Madison, Wisconsin, USA.
    1. Domengès, B., Hervieu, M., Raveau, B. & Tilley, R. J. D. (1984). J. Solid State Chem. 54, 10–28.
    1. Dumas, J., Beierlein, U., Drouard, S., Hess, C., Groult, D., Labbé, Ph., Roussel, P., Bonfait, G., Marin, E. G. & Schlenker, C. (1999). J. Solid State Chem. 147, 320–327.
    1. Dumas, J., Hess, C., Schlenker, C., Bonfait, G., Gomez Marin, E., Groult, D. & Marcus, J. (2000). Eur. Phys. J. B, 14, 73–82.