. 2020 Jan 25;7(Pt 2):220-227.
doi: 10.1107/S2052252519017366. eCollection 2020 Mar 1.

The resolution revolution in cryoEM requires high-quality sample preparation: a rapid pipeline to a high-resolution map of yeast fatty acid synthase

Affiliations

The resolution revolution in cryoEM requires high-quality sample preparation: a rapid pipeline to a high-resolution map of yeast fatty acid synthase

Mirko Joppe et al. IUCrJ. .

Abstract

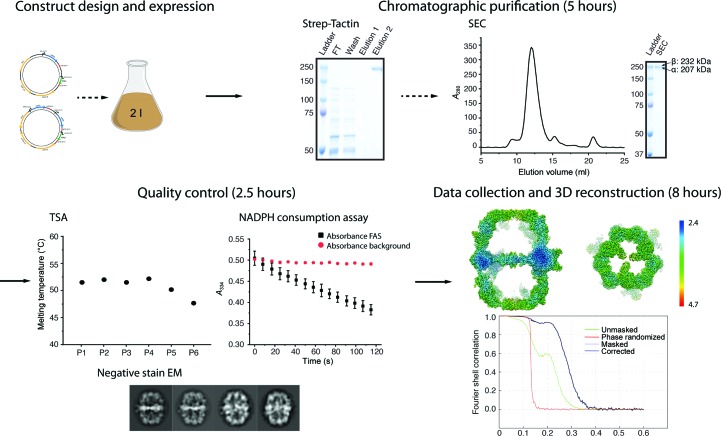
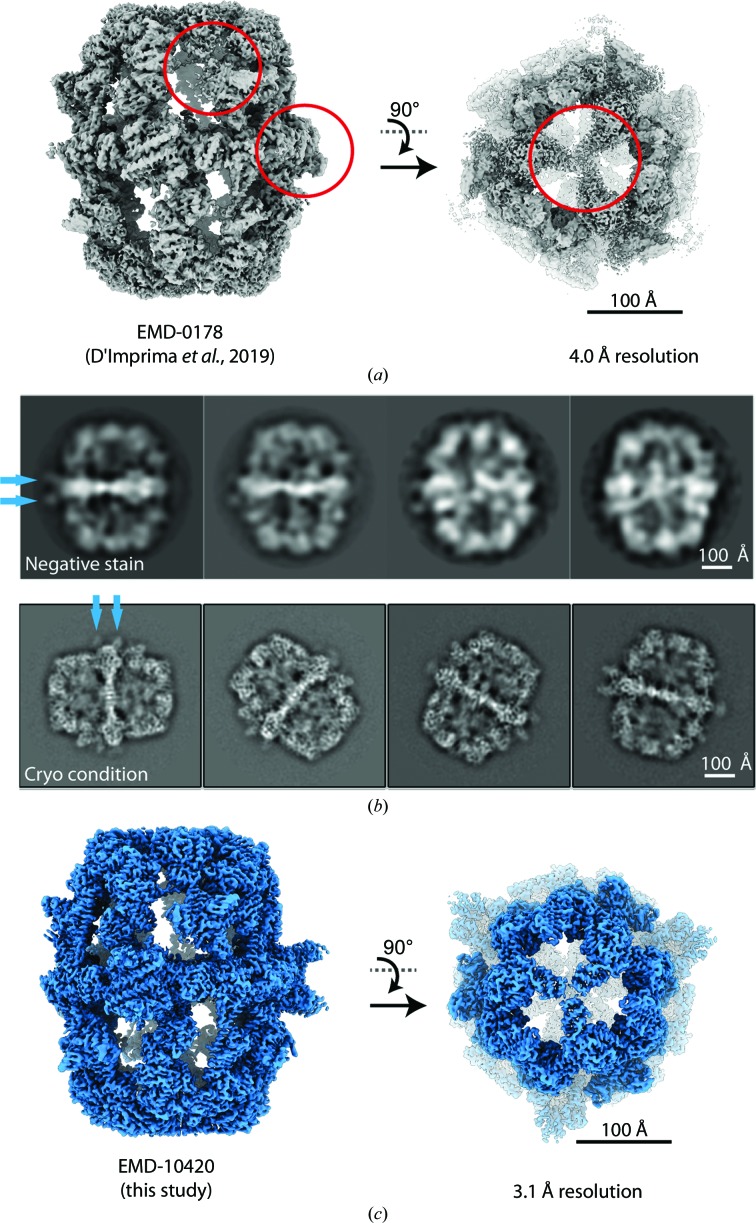
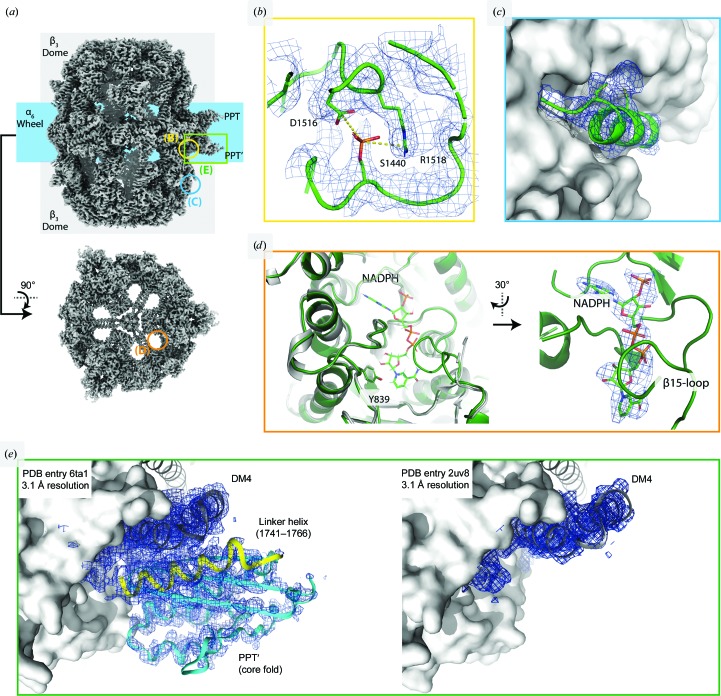
Single-particle electron cryo-microscopy (cryoEM) has undergone a 'resolution revolution' that makes it possible to characterize megadalton (MDa) complexes at atomic resolution without crystals. To fully exploit the new opportunities in molecular microscopy, new procedures for the cloning, expression and purification of macromolecular complexes need to be explored. Macromolecular assemblies are often unstable, and invasive construct design or inadequate purification conditions and sample-preparation methods can result in disassembly or denaturation. The structure of the 2.6 MDa yeast fatty acid synthase (FAS) has been studied by electron microscopy since the 1960s. Here, a new, streamlined protocol for the rapid production of purified yeast FAS for structure determination by high-resolution cryoEM is reported. Together with a companion protocol for preparing cryoEM specimens on a hydrophilized graphene layer, the new protocol yielded a 3.1 Å resolution map of yeast FAS from 15 000 automatically picked particles within a day. The high map quality enabled a complete atomic model of an intact fungal FAS to be built.

Keywords: 3D reconstruction and image processing; cryo-electron microscopy; macromolecular machines; protein structure; purification of protein complexes; single-particle cryoEM; yeast fatty acid synthase.


Figures

Figure 1
Figure 1
Structural analysis of yeast FAS. Yeast FAS was expressed overnight from pRS vector-encoded FAS1 and FAS2 genes. Gravity flow of the cleared lysate over a Strep-Tactin column and subsequent size-exclusion chromatography (SEC) delivered pure protein within 5 h. Protein quality was monitored by NADPH consumption, thermal shift assays (TSA) and negative-stain transmission EM within 2.5 h. Thermal stability was tested for a set of conditions (P1, 100 mM sodium phosphate pH 6.5; P2, 100 mM sodium phosphate pH 7.4; P3, 100 mM sodium phosphate pH 8; P4, 100 mM sodium phosphate, 100 mM NaCl pH 7.4; P5, 100 mM Tris–HCl pH 7.4; P6, distilled water). The activity of the preparation was 2310 ± 48 mU mg−1 and the error in the melting point varied by less than 0.5°C; both values were within technical replication. Protein integrity was assessed further by negative-stain EM and 2D single-particle image analysis (within 1.5 h). CryoEM images were collected in movie mode in 4.5 h. 20 000 particles were picked automatically, of which 15 000 were selected by 2D and 3D classification, to yield a map at 3.1 Å resolution in 3.5 h of image processing.
Figure 2
Figure 2
Comparison of FAS preparations. (a) The published map (D’Imprima et al., 2019 ▸) lacks the PPT domain and parts of the β-domes are poorly resolved (red circles). (b) Data collected using protein prepared by the optimized protocol described here. The 2D class averages show structured PPT domains (blue arrows) and resolved secondary-structure features at the β-domes. (c) CryoEM map from 15 000 particles at 3.1 Å resolution.
Figure 3
Figure 3
3.1 Å resolution map of FAS. (a) Overview of the EM map. The square and circles labelled (B), (C), (D) and (E) indicate the map regions that are enlarged in (b), (c), (d) and (e), respectively. (b) Density at Ser1440 suggesting phosphorylation. (c) Density at residues Cys820 and Cys824 (subunit β) not accounted for by the atomic model. (d) NADPH cofactor density in mesh representation, bound to the active site of the KR domain. Left: the KR active site in the apo form as in the X-ray structure (PDB entry 2uv8; gray) superimposed on our cryoEM structure (green). NADPH and the catalytically active Tyr839 are shown in stick representation. (e) The PPT domain and the dimerization module DM4, which acts as an adaptor to anchor the PPT domain at the perimeter of the FAS barrel (PPT domain in cyan, DM4 in gray and linker helix in yellow; both densities are shown at 1.0σ). Left: the PPT domain traced in the 3.1 Å resolution cryoEM density. Right: the 3.1 Å resolution X-ray map (data from PDB entry 2uv8; Leibundgut et al., 2007 ▸) shows that DM4 is well resolved, whereas there is no density for the PPT domain or linker helix.

References

    1. Bai, X.-C., Yan, C., Yang, G., Lu, P., Ma, D., Sun, L., Zhou, R., Scheres, S. H. W. & Shi, Y. (2015). Nature, 525, 212–217. - PMC - PubMed
    1. Chari, A., Haselbach, D., Kirves, J.-M., Ohmer, J., Paknia, E., Fischer, N., Ganichkin, O., Möller, V., Frye, J. J., Petzold, G., Jarvis, M., Tietzel, M., Grimm, C., Peters, J.-M., Schulman, B. A., Tittmann, K., Markl, J., Fischer, U. & Stark, H. (2015). Nat. Methods, 12, 859–865. - PMC - PubMed
    1. Chen, S., McMullan, G., Faruqi, A. R., Murshudov, G. N., Short, J. M., Scheres, S. H. W. & Henderson, R. (2013). Ultramicroscopy, 135, 24–35. - PMC - PubMed
    1. Chen, V. B., Arendall, W. B., Headd, J. J., Keedy, D. A., Immormino, R. M., Kapral, G. J., Murray, L. W., Richardson, J. S. & Richardson, D. C. (2010). Acta Cryst. D66, 12–21. - PMC - PubMed
    1. Cheng, Y., Grigorieff, N., Penczek, P. A. & Walz, T. (2015). Cell, 161, 438–449. - PMC - PubMed