. 2020 Feb 21:2020:4951692.
doi: 10.1155/2020/4951692. eCollection 2020.

Comprehensive Analysis of lncRNA-Mediated ceRNA Crosstalk and Identification of Prognostic Biomarkers in Wilms' Tumor

Affiliations

Comprehensive Analysis of lncRNA-Mediated ceRNA Crosstalk and Identification of Prognostic Biomarkers in Wilms' Tumor

Hong Zheng et al. Biomed Res Int. .

Abstract

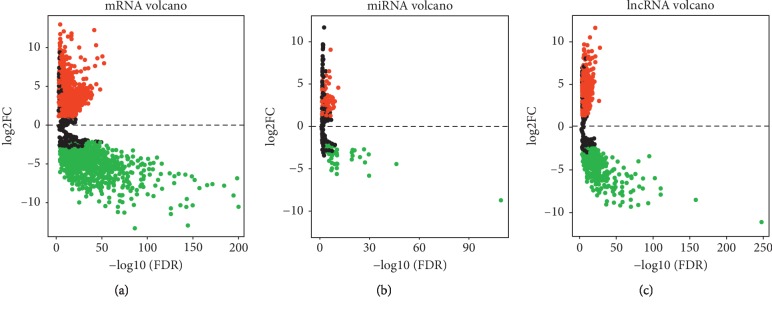
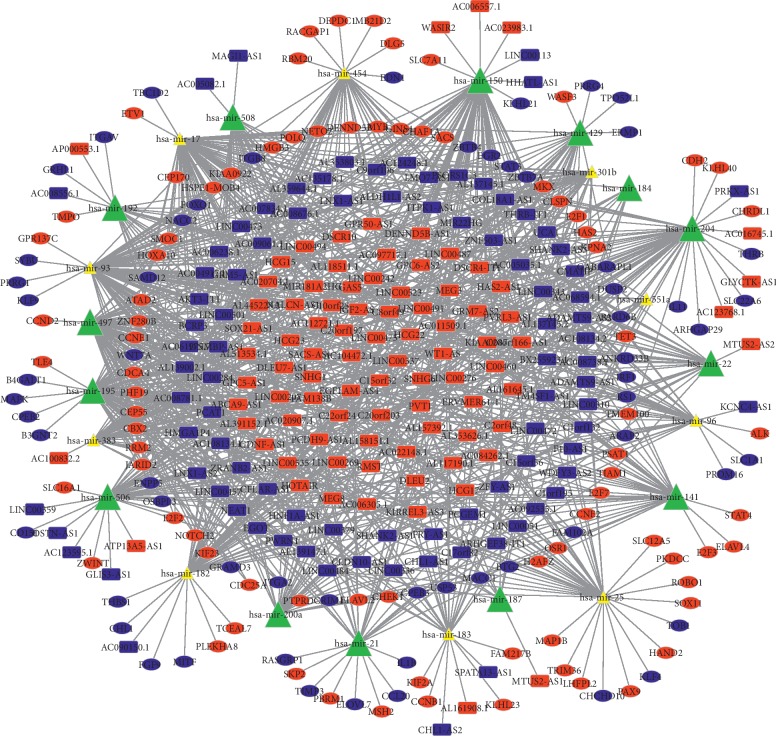
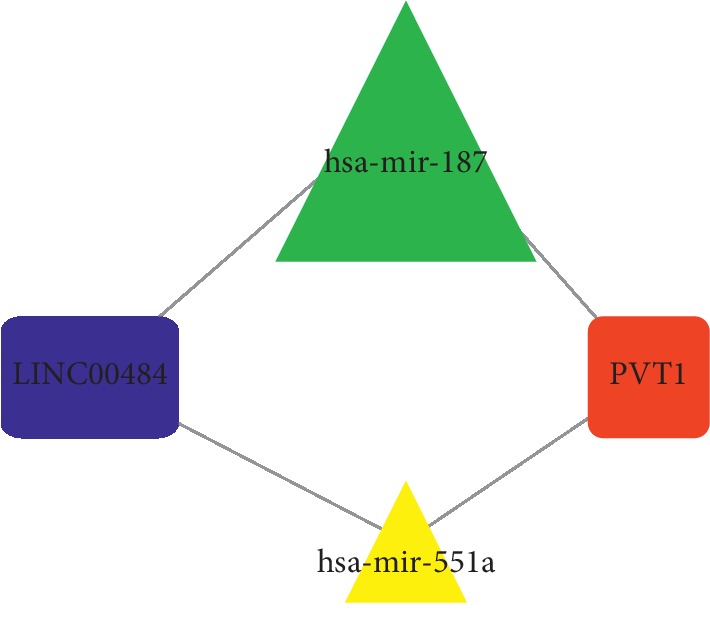
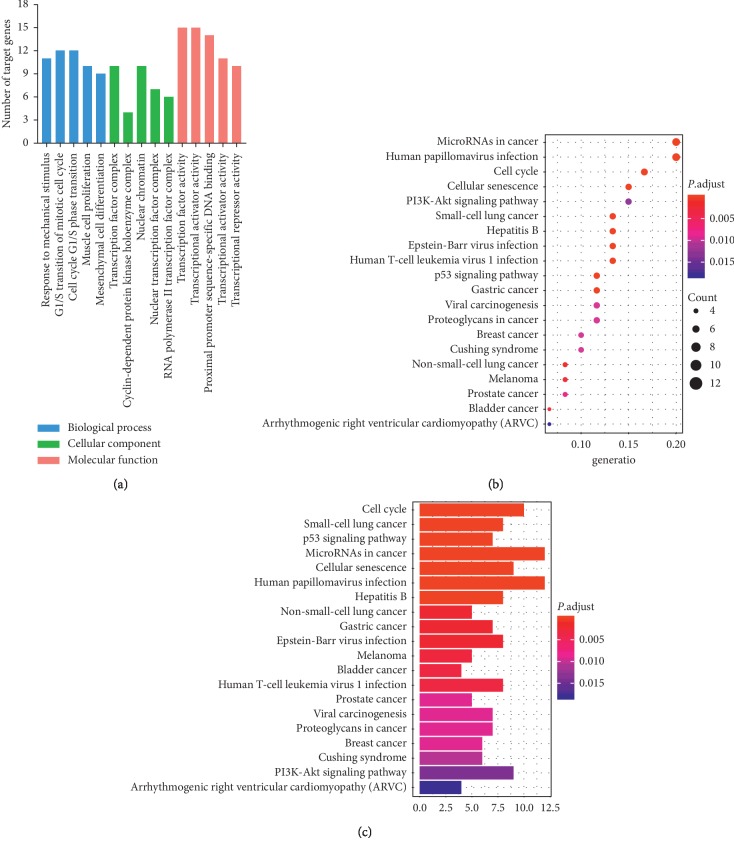
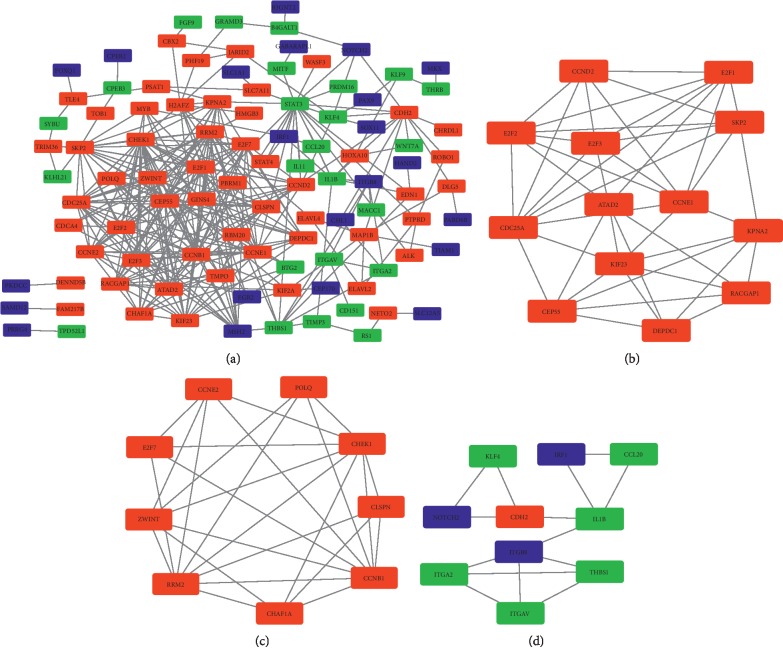
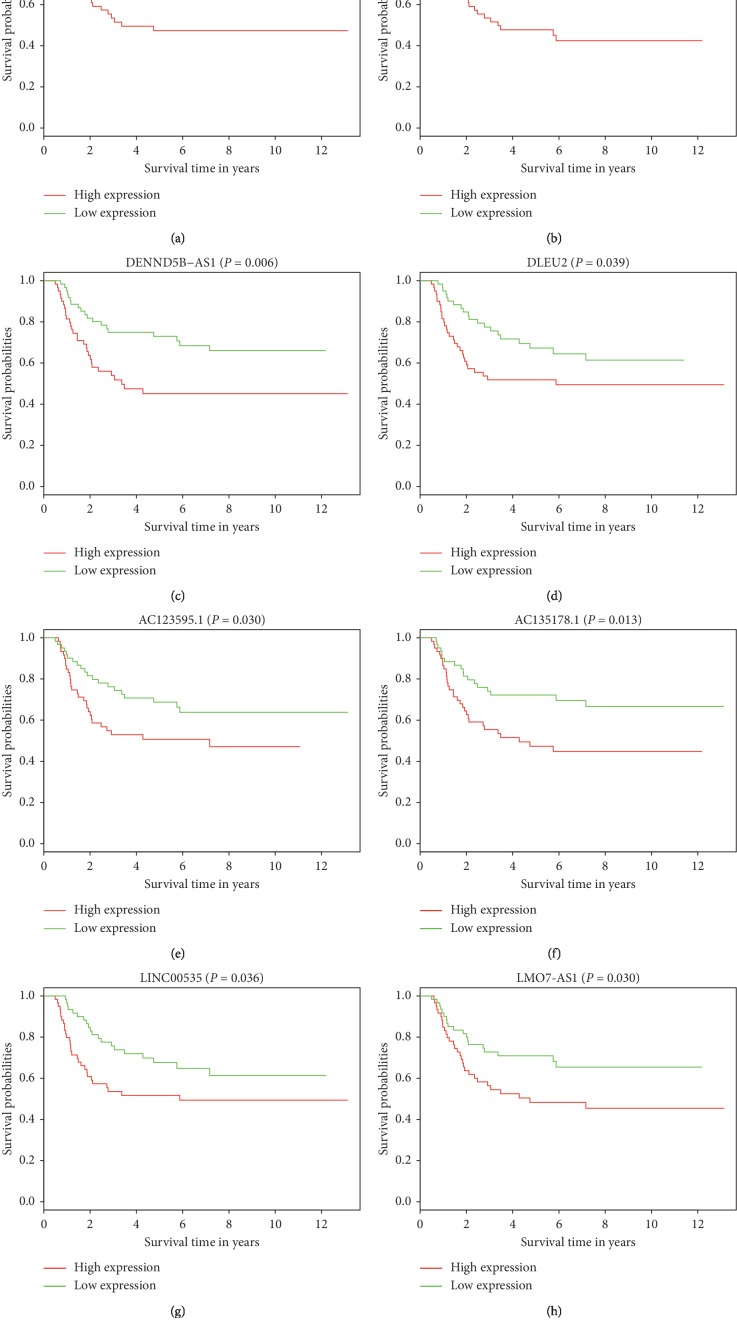
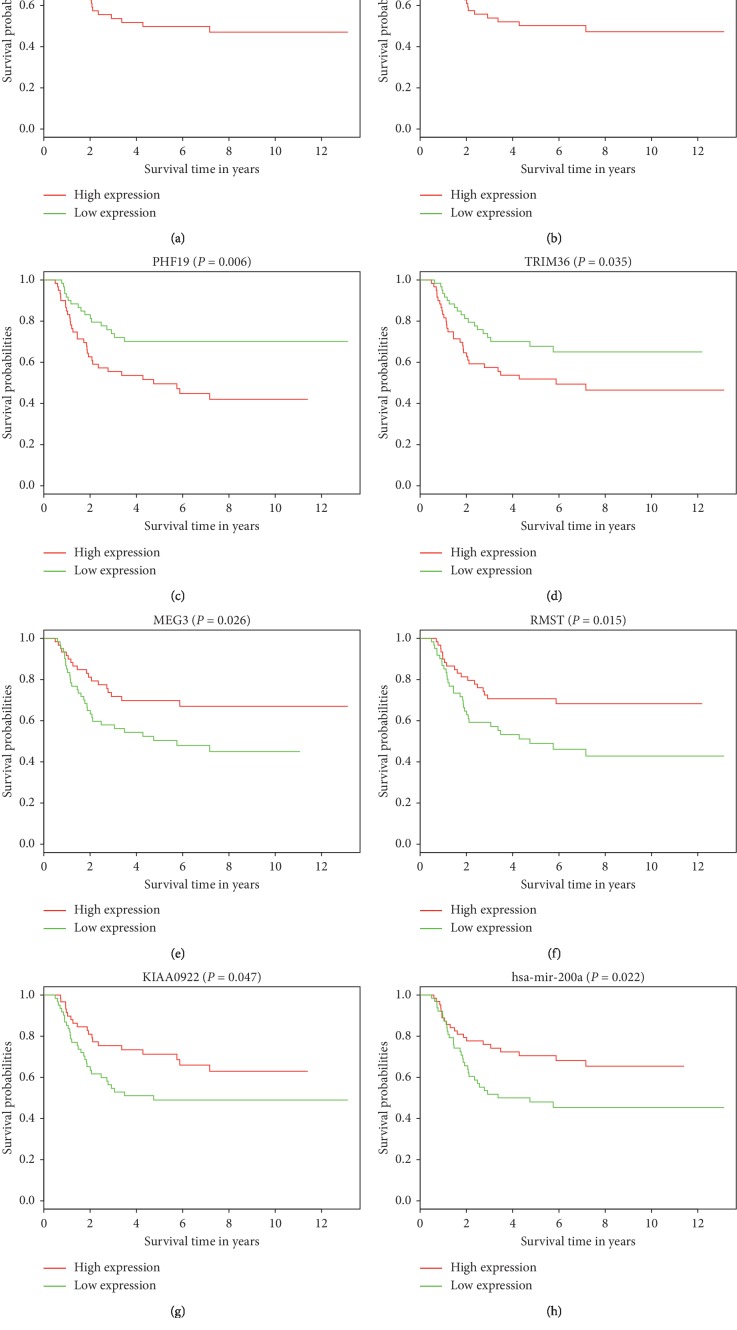
Wilms' tumor (WT) is the most common type of childhood kidney cancer, and most cases present with favorable histology and respond well to standard treatment. However, a subset of patients with WT is diagnosed with bilateral, relapsed, and high-risk tumors which remain the leading cause of cancer-related death in children. Long noncoding RNAs (lncRNAs) and their aberrant expression have currently been attracting great attention as oncogenes or tumor suppressors during tumor initiation and progression. So far, their roles and related competitive endogenous RNA (ceRNA) network remain unelucidated in nephroblastoma pathogenesis. We comprehensively integrated lncRNA, microRNA (miRNA), and messenger RNA (mRNA) expression profiles from the Therapeutically Applicable Research to Generate Effective Treatment (TARGET) database and screened out differentially expressed mRNAs (DEMs), lncRNAs (DELs), and miRNAs (DEMis) to construct a ceRNA network based on the information generated from miRcode, miRTarBase, TargetScan, and miRDB. Gene ontology (GO) and Kyoto Encyclopedia of Genes and Genomes (KEGG) pathway enrichment analyses were performed to analyze the functional characteristics of DEMs in the ceRNA network. The interaction between protein molecules was also analyzed by establishing a protein-protein interaction network. Finally, prognosis-related biomarkers were identified via survival analysis. Initially, 1647 DELs, 115 DEMis, and 3280 DEMs (|log FC| > 2; FDR < 0.01) were obtained using the R package. Next, we constructed a lncRNA-miRNA-mRNA network (ceRNA network), in which 176 DELs, 24 DEMis, and 141 DEMs were identified. Furthermore, 148 functional enrichment terms from GO were identified and 29 KEGG pathways were found to be significantly enriched. We also integrated patient clinical information to analyze the association between DERNAs and patient prognosis. We found that high expression of 8 DELs (LINC00473, AL445228.2, DENND5B-AS1, DLEU2, AC123595.1, AC135178.1, LINC00535, and LMO7-AS1) and 4 DEMs (CEP55, DEPDC1, PHF19, and TRIM36) correlated with poor survival in a patient with WT, whereas high expression of 2 DELs (MEG3 and RMST), 1 DEM (KIAA0922), and 1 DEMi (hsa-mir-200a) could possibly lead to better clinical outcomes. For the first time, the present study provided a novel insight into lncRNA-related ceRNA networks and identified potential prognostic biomarkers in Wilms' tumor.


Conflict of interest statement

The authors declare that they have no conflicts of interests.

Figures

Figure 1
Figure 1
Volcano plots of differentially expressed RNAs. (a) Volcano plots of differentially expressed mRNAs (DEMs). The red dot represents upregulated DEMs, and green dot represents downregulated DEMs. (b) Volcano plots of differentially expressed miRNAs (DEMis). The red dot represents upregulated DEMis, and green dot represents downregulated DEMis. (c) Volcano plots of differentially expressed lncRNAs (DELs).
Figure 2
Figure 2
CeRNA network in WT. Red dots indicate upregulated mRNAs, blue dots indicate downregulated mRNAs, yellow triangles represent upregulated miRNAs, green triangles represent downregulated miRNAs, red rectangles indicate increased expression of lncRNAs, and blue rectangles indicate decreased expression of lncRNAs.
Figure 3
Figure 3
Densely connected region of ceRNA network. The red rectangle indicates increased expression of lncRNA, blue rectangle indicates decreased expression of lncRNA, green triangle represents downregulated miRNA, and yellow triangle represents upregulated miRNA.
Figure 4
Figure 4
GO and KEGG functional enrichment analysis of target genes involved in the ceRNA regulation network of WT. (a) GO functional enrichment analysis. The bar graphs show GO functional enrichment analysis with horizontal axis for GO items and vertical axis for number of target genes enriched in GO terms. The color blue represents the biological process, green represents the cellular component, and red represents the molecule function. (b, c) KEGG functional enrichment analysis. The bar and bubble plots show KEGG pathway enrichment data.
Figure 5
Figure 5
Protein-protein interaction network of target genes in the ceRNA network. (a) PPI network in WT. The red rectangles represent upregulated DEMs, green rectangle represent downregulated DEMs, and blue rectangles represent DEMs that are not in the ceRNA but are associated with the target genes. (b–d) Densely connected regions of the PPI network. The red rectangles represent upregulated DEMs, green rectangle represent downregulated DEMs, and blue rectangles represent DEMs that are not in the ceRNA but are associated with the target genes.
Figure 6
Figure 6
Survival analysis for DELs, DEMs, and DEMis in WT. (a–h) Survival analysis for 8 differentially expressed RNAs in WT. X-axis and Y-axis represent survival time in years and survival probability.
Figure 7
Figure 7
Survival analysis for DELs, DEMs, and DEMis in WT. (a–h) survival analysis for 8 differentially expressed RNAs in WT. X-axis and Y-axis represent survival time in years and survival probability.

Similar articles

Cited by

References

    1. Treger T. D., Chowdhury T., Pritchard-Jones K., Behjati S. The genetic changes of Wilms tumour. Nature Reviews Nephrology. 2019;15(4):240–251. doi: 10.1038/s41581-019-0112-0. - DOI - PubMed
    1. Anvar Z., Acurzio B., Roma J., Cerrato F., Verde G. Origins of DNA methylation defects in Wilms tumors. Cancer Letters. 2019;457:119–128. doi: 10.1016/j.canlet.2019.05.013. - DOI - PubMed
    1. Dome J. S., Graf N., Geller J. I., et al. Advances in wilms tumor treatment and biology: progress through international collaboration. Journal of Clinical Oncology. 2015;33(27):2999–3007. doi: 10.1200/jco.2015.62.1888. - DOI - PMC - PubMed
    1. Kim J., Yao F., Xiao Z., Sun Y., Ma L. MicroRNAs and metastasis: small RNAs play big roles. Cancer and Metastasis Reviews. 2018;37(1):5–15. doi: 10.1007/s10555-017-9712-y. - DOI - PMC - PubMed
    1. Yu X., Li Z., Chan M. T. V., Wu W. K. K. The roles of microRNAs in Wilms’ tumors. Tumor Biology. 2016;37(2):1445–1450. doi: 10.1007/s13277-015-4514-8. - DOI - PubMed

MeSH terms