. 2020 Feb 18;5(8):4024-4031.
doi: 10.1021/acsomega.9b03589. eCollection 2020 Mar 3.

Measuring Cellular Ion Transport by Magnetoencephalography

Affiliations

Measuring Cellular Ion Transport by Magnetoencephalography

Sudhir Kumar Sharma et al. ACS Omega. .

Abstract

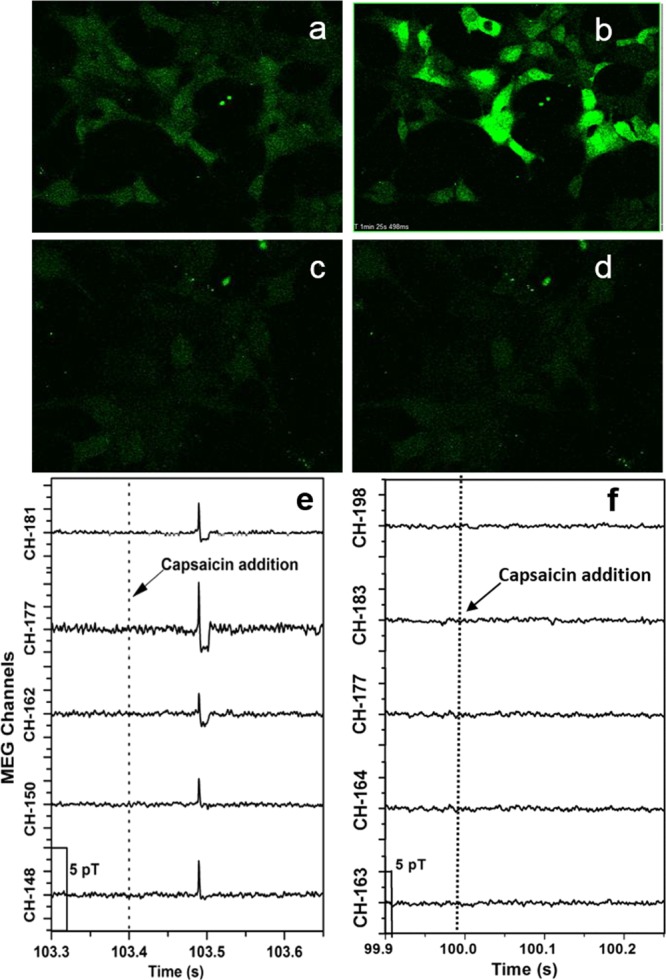
The cellular-level process of ion transport is known to generate a magnetic field. A noninvasive magnetoencephalography (MEG) technique was used to measure the magnetic field emanating from HeLa, HEK293, and H9c2(2-1) rat cardiac cells. The addition of a nonlethal dose of ionomycin to HeLa and capsaicin to TRPV1-expressing HEK293 cells resulted in a sudden change in the magnetic field signal consistent with Ca2+ influx, which was also observed by confocal fluorescence microscopy under the same conditions. In contrast, addition of capsaicin to TRPV1-expressing HEK293 cells containing an optimum amount of a TRPV1 antagonist (ruthenium red), resulted in no detectable magnetic or fluorescent signals. These signals confirmed that the measured MEG signals are due to cellular ion transport through the cell membrane. In general, there is evidence that ion channel/transporter activation and ionic flux are linked to cancer. Therefore, our work suggests that MEG could represent a noninvasive method for detecting cancer.


Conflict of interest statement

The authors declare no competing financial interest.

Figures

Figure 1
Figure 1
Concept diagram of the MEG system used in the study. (a) Sketch of the system with the MEG head where the sensor array is located. (b) Magnified sketch of the MEG head with the cavity where the cell culture flask is placed. (c) Actual schematic of the sensor array located within the MEG head.
Figure 2
Figure 2
Effect of ionomycin addition on cytosolic Ca2+, cell death, and the MEG data. (a) Normalized fluorescent signal from Fluo-4 upon exposure to 0.5, 1.0, 1.5, and 2.0 μM ionomycin to establish the minimum ionomycin concentration to observe a response from the calcium indicator. (b) Percentage of cell death from 5, 10, and 30 min exposure to 1, 2, and 5 μM ionomycin observed in a trypan blue assay. Error bars represent the standard deviation of the measurement. (c, d) Confocal images of HeLa cells loaded with Fluo-4 (c) before and (d) after addition of ionomycin (2 μM). (e) MEG data for 1 × 10⁶ cells detected by channels 121, 127, 131, 137, and 142 when ionomycin (2 μM) is added to the flask as indicated by the dashed line.
Figure 3
Figure 3
Effect of capsaicin addition on cytosolic Ca2+ on HEK293 cells stably transfected with TRPV1 with and without the TRPV1 antagonist ruthenium red using confocal florescence imaging and MEG: (a) images of HEK293 cells stably transfected with TRPV1 channels loaded with Fluo-4 before addition of capsaicin. (b) Images of HEK293 cells stably transfected with TRPV1 channels loaded with Fluo-4 after addition of capsaicin (10 μM). (c) Images of HEK293 cells stably transfected with TRPV1 channels containing the TRPV1 antagonist ruthenium red, (10 μM) loaded with Fluo-4 before addition of capsaicin (10 μM). (d) Images of HEK293 cells stably transfected with TRPV1 channels, containing ruthenium red (10 μM) loaded with Fluo-4 after addition of capsaicin (10 μM). (e) MEG data for 0.05 × 10⁶ HEK293 cells stably transfected with TRPV1 channels detected by channels 148, 150, 162, 177, and 181 when capsaicin in the culture media (10 μM final concentration) was added to the flask at the time point marked by the dotted line. (f) MEG data for 0.05 × 10⁶ HEK293 cells stably transfected with TRPV1 channels, containing ruthenium red (10 μm), detected by channels 163, 164, 177, 183, and 198 when capsaicin in the culture media (10 μM final concentration) was added to the flask at the time point marked by the dotted line.
Figure 4
Figure 4
MEG detection of magnetic fields from HeLa cells in culture. (a) Typical data for 1 × 10⁶ cells detected by channels 3, 21, 35, 45, and 175. (b) MEG data from a flask containing only culture but no cells.

Similar articles

Cited by

References

    1. Garzon R.; Marcucci G.; Croce C. M. Targeting MicroRNAs in Cancer: Rationale, Strategies and Challenges. Nat. Rev. Drug Discovery 2010, 9, 775–789. 10.1038/nrd3179. - DOI - PMC - PubMed
    1. Kalinich M.; Haber D. A. Cancer Detection: Seeking Signals in Blood. Science 2018, 359, 866–867. 10.1126/science.aas9102. - DOI - PMC - PubMed
    1. Frangioni J. V. New Technologies for Human Cancer Imaging. J. Clin. Oncol. 2008, 26, 4012–4021. 10.1200/JCO.2007.14.3065. - DOI - PMC - PubMed
    1. Schmick M.; Vartak N.; Papke B.; Kovacevic M.; Truxius D. C.; Rossmannek L.; Bastiaens P. I. H. KRas Localizes to the Plasma Membrane by Spatial Cycles of Solubilization, Trapping and Vesicular Transport. Cell 2014, 157, 459–471. 10.1016/j.cell.2014.02.051. - DOI - PubMed
    1. Prevarskaya N.; Skryma R.; Shuba Y. Ion Channels and the Hallmarks of Cancer. Trends Mol. Med. 2010, 16, 107–121. 10.1016/j.molmed.2010.01.005. - DOI - PubMed

LinkOut - more resources