Bone Mineral Is More Heterogeneously Distributed in the Femoral Heads of Osteoporotic and Diabetic Patients: A Pilot Study
- PMID: 32149268
- PMCID: PMC7017882
- DOI: 10.1002/jbm4.10253
Bone Mineral Is More Heterogeneously Distributed in the Femoral Heads of Osteoporotic and Diabetic Patients: A Pilot Study
Abstract
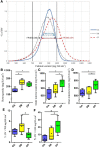
Osteoporosis is associated with systemic bone loss, leading to a significant deterioration of bone microarchitecture and an increased fracture risk. Although recent studies have shown that the distribution of bone mineral becomes more heterogeneous because of estrogen deficiency in animal models of osteoporosis, it is not known whether osteoporosis alters mineral distribution in human bone. Type 2 diabetes mellitus (T2DM) can also increase bone fracture risk and is associated with impaired bone cell function, compromised collagen structure, and reduced mechanical properties. However, it is not known whether alterations in mineral distribution arise in diabetic (DB) patients' bone. In this study, we quantify mineral content distribution and tissue microarchitecture (by μCT) and mechanical properties (by compression testing) of cancellous bone from femoral heads of osteoporotic (OP; n = 10), DB (n = 7), and osteoarthritic (OA; n = 7) patients. We report that though OP cancellous bone has significantly deteriorated compressive mechanical properties and significantly compromised microarchitecture compared with OA controls, there is also a significant increase in the mean mineral content. Moreover, the heterogeneity of the mineral content in OP bone is significantly higher than controls (+25%) and is explained by a significant increase in bone volume at high mineral levels. We propose that these mineral alterations act to exacerbate the already reduced bone quality caused by reduced cancellous bone volume during osteoporosis. We show for the first time that cancellous bone mineralization is significantly more heterogeneous (+26%) in patients presenting with T2DM compared with OA (non-DB) controls, and that this heterogeneity is characterized by a significant increase in bone volume at low mineral levels. Despite these mineralization changes, bone microarchitecture and mechanical properties are not significantly different between OA groups with and without T2DM. Nonetheless, the observed alterations in mineral heterogeneity may play an important tissue-level role in bone fragility associated with OP and DB bone. © 2019 The Authors. JBMR Plus published by Wiley Periodicals, Inc. on behalf of American Society for Bone and Mineral Research.
Keywords: DIABETES; MECHANICAL PROPERTIES; MICROARCHITECTURE; MINERAL HETEROGENEITY; OSTEOARTHRITIS; OSTEOPOROSIS.
© 2019 The Authors. JBMR Plus published by Wiley Periodicals, Inc. on behalf of American Society for Bone and Mineral Research.
Figures


Similar articles
-
Difference in subchondral cancellous bone between postmenopausal women with hip osteoarthritis and osteoporotic fracture: implication for fatigue microdamage, bone microarchitecture, and biomechanical properties.Arthritis Rheum. 2012 Dec;64(12):3955-62. doi: 10.1002/art.34670. Arthritis Rheum. 2012. PMID: 23124609
-
Altered Tissue Composition, Microarchitecture, and Mechanical Performance in Cancellous Bone From Men With Type 2 Diabetes Mellitus.J Bone Miner Res. 2019 Jul;34(7):1191-1206. doi: 10.1002/jbmr.3711. Epub 2019 May 17. J Bone Miner Res. 2019. PMID: 30866111 Free PMC article.
-
3-D microarchitectural properties and rod- and plate-like trabecular morphometric properties of femur head cancellous bones in patients with rheumatoid arthritis, osteoarthritis, and osteoporosis.J Orthop Translat. 2021 Apr 20;28:159-168. doi: 10.1016/j.jot.2021.02.002. eCollection 2021 May. J Orthop Translat. 2021. PMID: 33996461 Free PMC article.
-
The mineralization of bone tissue: a forgotten dimension in osteoporosis research.Osteoporos Int. 2003;14 Suppl 3:S19-24. doi: 10.1007/s00198-002-1347-2. Epub 2003 Mar 18. Osteoporos Int. 2003. PMID: 12730799 Review.
-
Osteoarthritis and osteoporosis: clinical and research evidence of inverse relationship.Aging Clin Exp Res. 2003 Oct;15(5):426-39. doi: 10.1007/BF03327364. Aging Clin Exp Res. 2003. PMID: 14703009 Review.
Cited by
-
A Novel 3D Osteoblast and Osteocyte Model Revealing Changes in Mineralization and Pro-osteoclastogenic Paracrine Signaling During Estrogen Deficiency.Front Bioeng Biotechnol. 2020 Jun 10;8:601. doi: 10.3389/fbioe.2020.00601. eCollection 2020. Front Bioeng Biotechnol. 2020. PMID: 32656194 Free PMC article.
-
Characterization of Bone Matrix Mineralization and Osteocyte Lacunar Density Unveils Microstructural Impairment at the Main Femoral Fracture-Initiating Site in Type 2 Diabetes Mellitus.Calcif Tissue Int. 2025 Jun 13;116(1):84. doi: 10.1007/s00223-025-01396-4. Calcif Tissue Int. 2025. PMID: 40512394
-
Distributions of Microdamage Are Altered Between Trabecular Rods and Plates in Cancellous Bone From Men With Type 2 Diabetes Mellitus.J Bone Miner Res. 2022 Apr;37(4):740-752. doi: 10.1002/jbmr.4509. Epub 2022 Feb 15. J Bone Miner Res. 2022. PMID: 35064941 Free PMC article.
-
Osteocytes and Diabetes: Altered Function of Diabetic Osteocytes.Curr Osteoporos Rep. 2020 Dec;18(6):796-802. doi: 10.1007/s11914-020-00641-z. Epub 2020 Nov 13. Curr Osteoporos Rep. 2020. PMID: 33184775 Review.
-
Increased Advanced Glycation Endproducts, Stiffness, and Hardness in Iliac Crest Bone From Postmenopausal Women With Type 2 Diabetes Mellitus on Insulin.J Bone Miner Res. 2023 Feb;38(2):261-277. doi: 10.1002/jbmr.4757. Epub 2022 Dec 28. J Bone Miner Res. 2023. PMID: 36478472 Free PMC article.
References
-
- Reginster JY, Burlet N. Osteoporosis: a still increasing prevalence. Bone. 2006;38(2 Suppl 1):1998–2003. - PubMed
-
- Kanis JA, Johnell O. Requirements for DXA for the management of osteoporosis in Europe. Osteoporos Int. 2005;16(3):229–38. - PubMed
-
- Parfitt AM. The cellular basis of bone remodeling: the quantum concept reexamined in light of recent advances in the cell biology of bone. Calcif Tissue Int. 1984;36(Suppl 1):S37–45. - PubMed
-
- Braidman IP, Hainey L, Batra G, Selby PL, Saunders PT, Hoyland JA. Localization of estrogen receptor beta protein expression in adult human bone. J Bone Miner Res. 2001;16(2):214–20. - PubMed
-
- Knothe Tate ML, Tami A, Bauer TW, Knothe U. Micropathoanatomy of osteoporosis—indications for a cellular basis of bone disease. Adv Osteoporotic Fract Manag. 2002;2(1):9–14.
LinkOut - more resources
Full Text Sources
Miscellaneous
