

Translational efficiency across healthy and tumor tissues is proliferation-related
- PMID: 32149479
- PMCID: PMC7061310
- DOI: 10.15252/msb.20199275
Translational efficiency across healthy and tumor tissues is proliferation-related
Erratum in
-
Translational efficiency across healthy and tumor tissues is proliferation-related.Mol Syst Biol. 2021 Mar;17(3):e10097. doi: 10.15252/msb.202010097. Mol Syst Biol. 2021. PMID: 33759329 Free PMC article.
Abstract
Different tissues express genes with particular codon usage and anticodon tRNA repertoires. However, the codon-anticodon co-adaptation in humans is not completely understood, nor is its effect on tissue-specific protein levels. Here, we first validated the accuracy of small RNA-seq for tRNA quantification across five human cell lines. We then analyzed the tRNA abundance of more than 8,000 tumor samples from TCGA, together with their paired mRNA-seq and proteomics data, to determine the Supply-to-Demand Adaptation. We thereby elucidate that the dynamic adaptation of the tRNA pool is largely related to the proliferative state across tissues. The distribution of such tRNA pools over the whole cellular translatome affects the subsequent translational efficiency, which functionally determines a condition-specific expression program both in healthy and tumor states. Furthermore, the aberrant translational efficiency of some codons in cancer, exemplified by ProCCA and GlyGGT, is associated with poor patient survival. The regulation of these tRNA profiles is partly explained by the tRNA gene copy numbers and their promoter DNA methylation.
Keywords: tRNA; The Cancer Genome Atlas; codon usage; tissue; translation.
© 2020 The Authors. Published under the terms of the CC BY 4.0 license.
Conflict of interest statement
The authors declare that they have no conflict of interest.
Figures
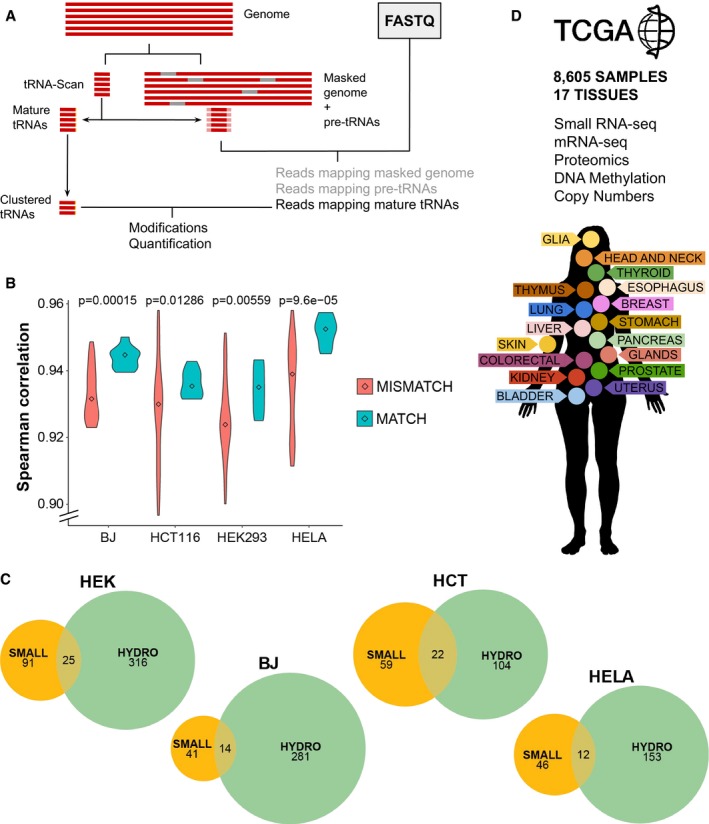
Schematic pipeline for accurate mapping of tRNA reads.
Correlations between tRNA quantifications by small RNA‐seq and Hydro‐tRNAseq of matching (correlations within the same cell line) versus non‐matching (different cell lines) samples. Center values represent the median. The P‐value corresponds to a one‐tailed Wilcoxon rank‐sum test, with n matching = 9 and n non‐matching = 63.
Overlap of the detected tRNA modifications upon variant calling by both methods.
The TCGA network contains small RNA‐seq data alongside mRNA‐seq, DNA methylation arrays, non‐targeted proteomics, and copy number alteration quantification comprising 17 tissues.
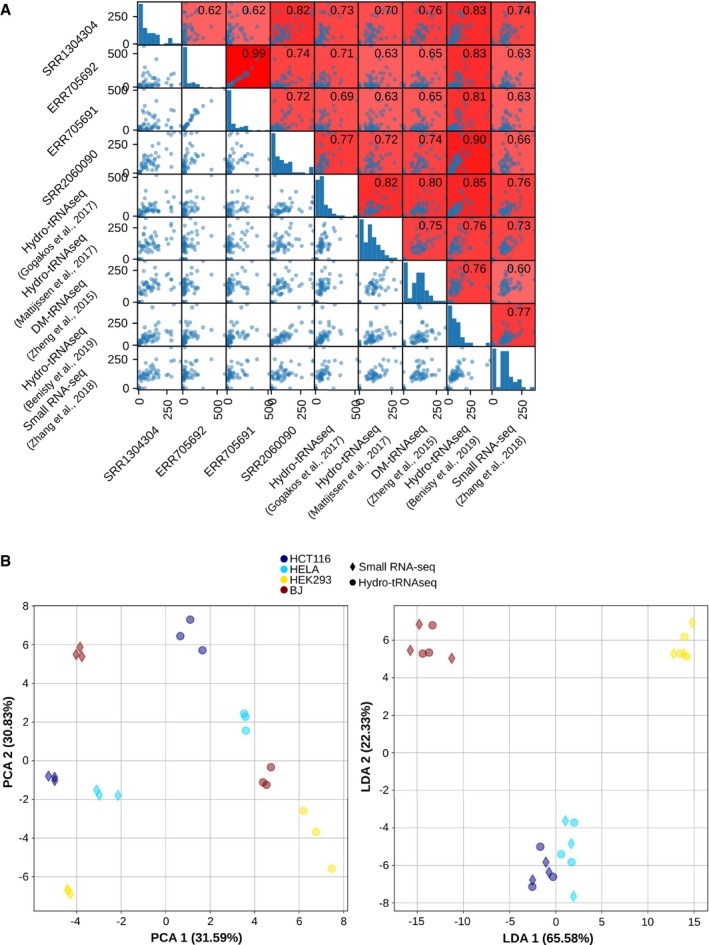
The Spearman correlations between all HEK293 tRNA quantifications, including four small RNA‐seq datasets (Data ref: Flores et al, 2014b; Data ref: Mefferd et al, 2015b; Data ref: Torres et al, 2015b,c), four well‐established tRNAseq datasets using Hydro‐tRNAseq and DM‐tRNAseq (Data ref: Zheng et al, 2015b; Data ref: Gogakos et al, 2017b; Data ref: Mattijssen et al, 2017b; Data ref: Benisty et al, 2019b), and one previously published quantification from small RNA‐seq data by Zhang et al (2018). The scatter plots are square‐root‐normalized for better visualization.
Principal component analysis (PCA) and linear discriminant analysis (LDA) of all absolute tRNA quantifications of HCT116, HELA, HEK293, and BJ fibroblasts, both from small RNA‐seq and from Hydro‐tRNAseq data. On the left, the first component of the PCA (method‐related) explains 31.59% variance and the second component (cell‐line‐related) explains 30.83% variance. On the right, the first component of the LDA separates completely all four cell lines, regardless of the method.
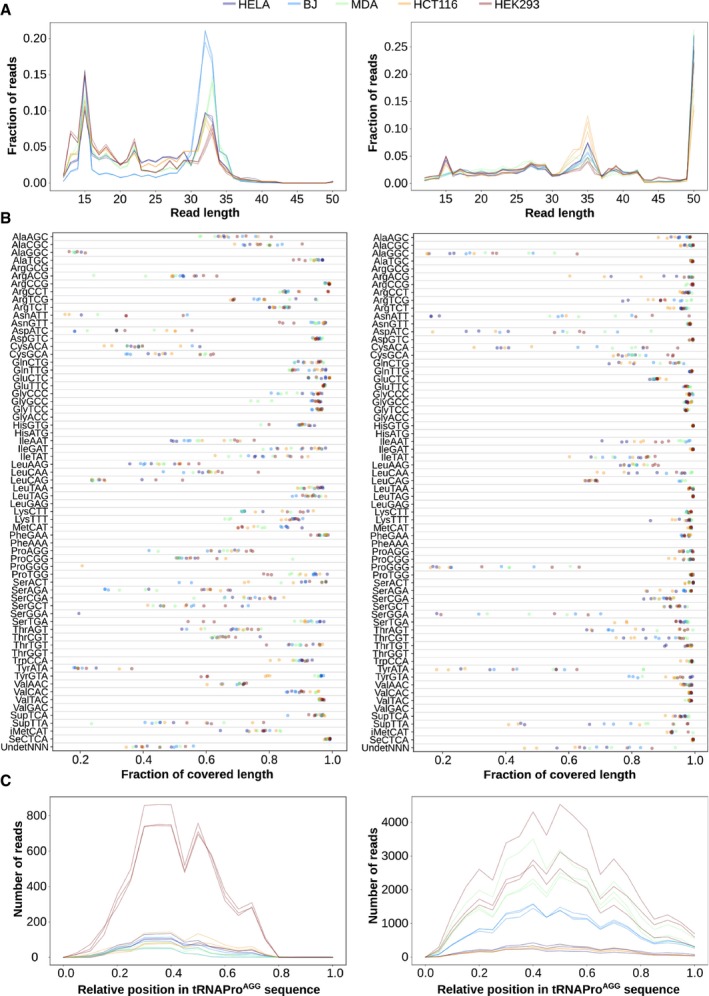
Length distribution of all reads mapping to tRNA genes.
Fraction of the tRNA sequence that is covered by 1 or more reads, for each of the tRNA isoacceptors.
Absolute number of reads mapping along the sequence of tRNAProAGG. The relative abundance between cell lines is not comparable given their different sequencing depths.
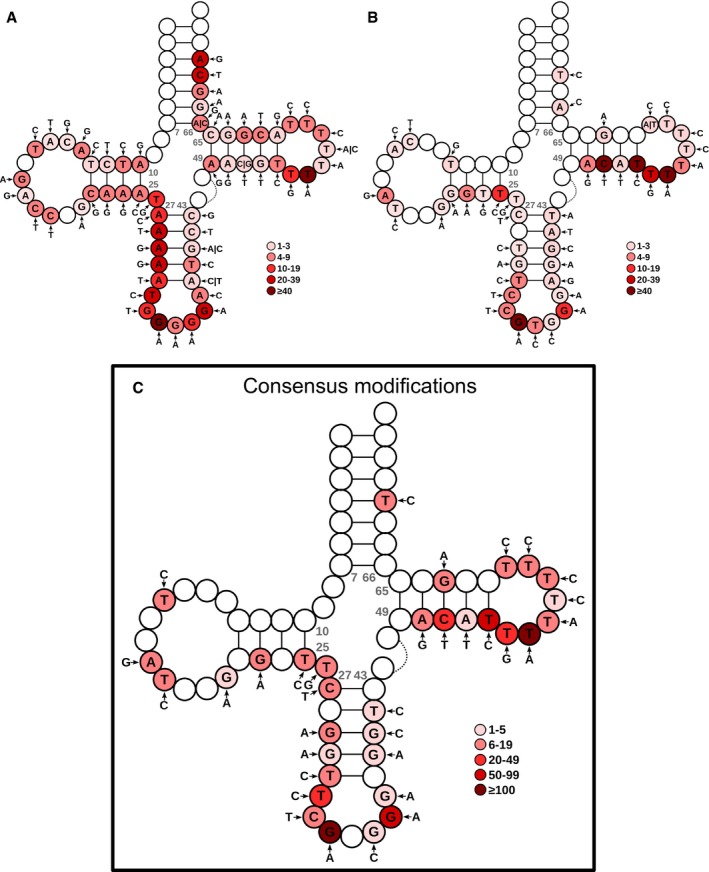
- A, B
Over the consensus mature tRNA structure of tRNAdb (Jühling et al, 2009), the most frequent detected variants are depicted for both Hydro‐tRNAseq (A) and small RNA‐seq (B). The color code represents the number of tRNAs showing the modification at each specific position of the tRNA model.
- C
Consensus modifications detected by both methods. The color intensity refers to the sum of mismatch calls of the two methods altogether. Refer to Table EV3 for a detailed list of modifications for all cell lines.
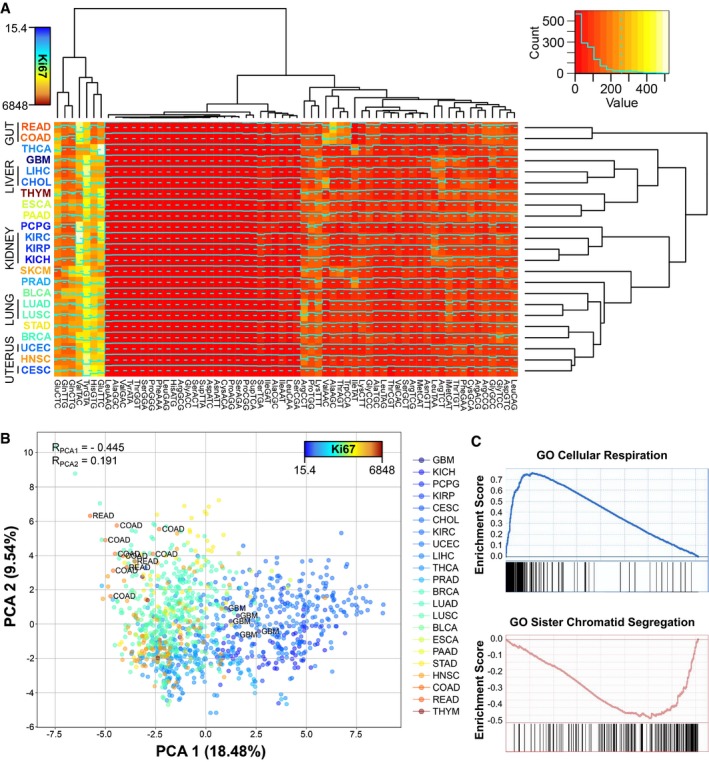
Medians of square‐root‐normalized tRNA abundances across all TCGA tissues. The color of the tissue labels corresponds to the average Ki67 expression. Refer to Table EV4 for full cancer type names and number of samples.
Principal component analysis (PCA) of the relative anticodon abundances (RAA, see Materials and Methods) of all healthy samples of TCGA, where the color scale corresponds to the mean tissue expression of Ki67. The Spearman correlations of Ki67 with the components are shown, as well as the samples of most extreme tissues.
Top positive and negative GO terms upon gene set enrichment analysis (GSEA) of the correlations of the first PCA component against all genes.
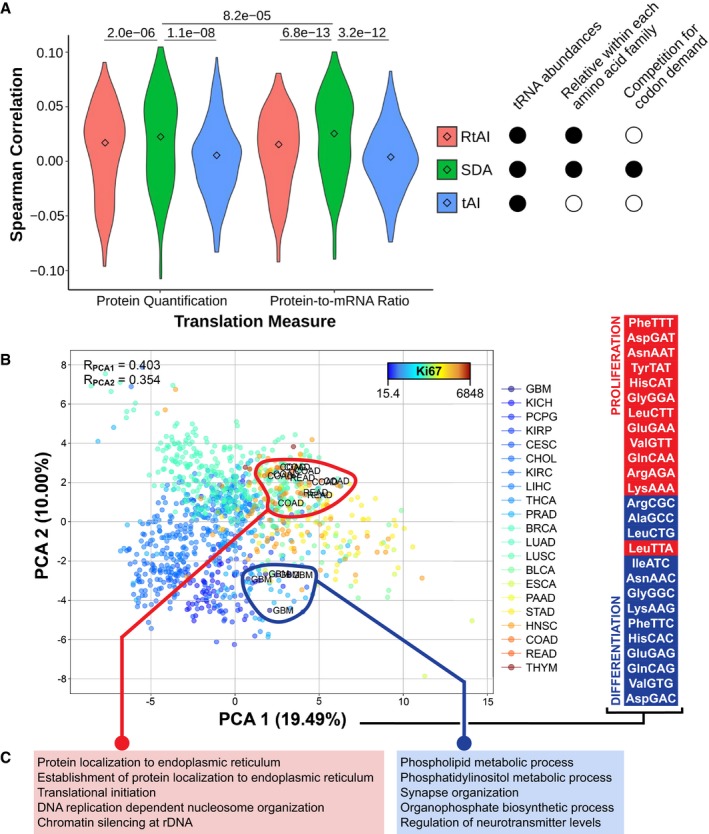
Three metrics of translational efficiency (the classical tAI, a relative tAI with normalized weights within each amino acid family, and the Supply‐to‐Demand Adaptation described in this article) are Spearman correlated against two proxies of translation (protein abundance and protein‐to‐mRNA ratio) for all samples for which proteomics data are available (BRCA, COAD and READ). Center values represent the median. Statistical differences are determined by sample‐paired two‐tailed Wilcoxon rank‐sum test (n = 219).
Principal component analysis (PCA) of the SDAw of TCGA, where the color scale corresponds to the mean tissue expression of Ki67. The Spearman correlations of Ki67 with the components are shown, as well as the samples of most extreme tissues. On the right, the top and bottom proliferation‐ and differentiation‐related codons, as defined by Gingold et al (2014), ordered by their contribution to the first PCA component. Refer to Table EV4 for full cancer type names and number of samples.
GSEA of the differential SDA between extreme tissues (ΔSDA = SDAColorectal ‐ SDABrain), showing the top five GO terms with high (left) and low (right) SDA in colorectal versus glial tissues.
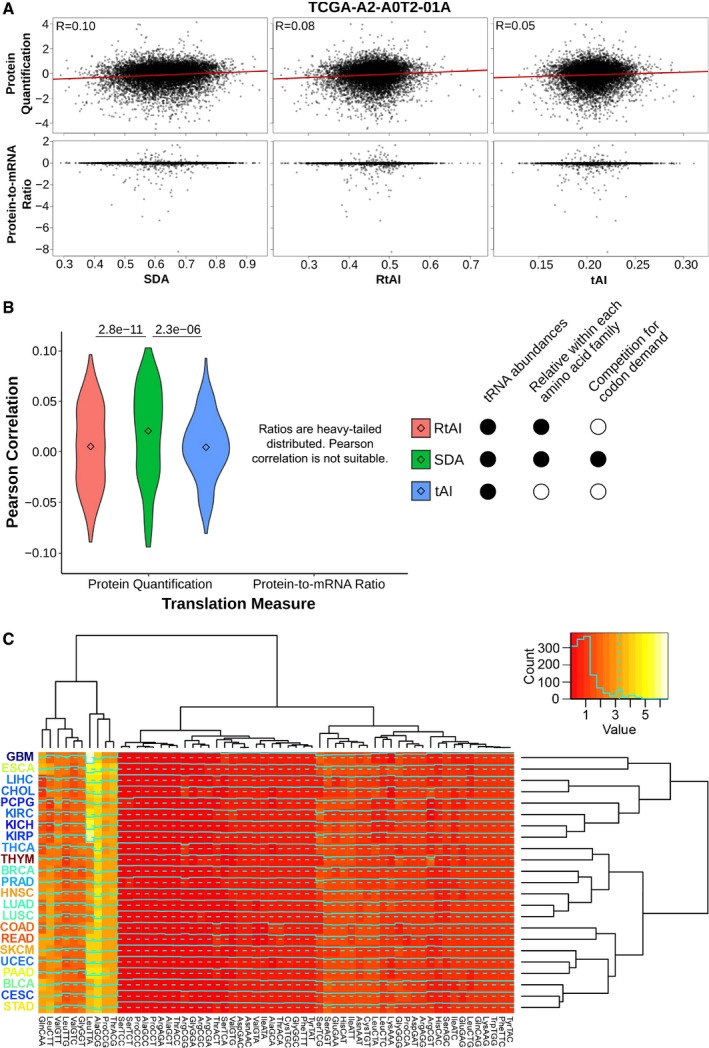
Scatter plots against the proteome of the breast cancer sample TCGA‐A2‐A0T2‐01A. Three metrics of translational efficiency (the classical tAI, a relative tAI with normalized weights within each amino acid family, and the Supply‐to‐Demand Adaptation described in this article) are plotted against two proxies of translation (protein abundance and protein‐to‐mRNA ratio). Pearson's correlation is only determined for protein abundance, since the assumption of normality is not fulfilled by the ratios.
Pearson's correlations of all samples for which proteomics data are available (BRCA, COAD and READ). Center values represent the median. Statistical differences are determined by sample‐paired two‐tailed Wilcoxon rank‐sum test (n = 219).
Medians of Supply‐to‐Demand Adaptation weights (SDAw) across all TCGA tissues. The dendrograms show a hierarchical clustering among tissues (right) and among SDAw (top). The tissue labels correspond to the average Ki67 expression. Refer to Table EV4 for full cancer type names and number of samples.
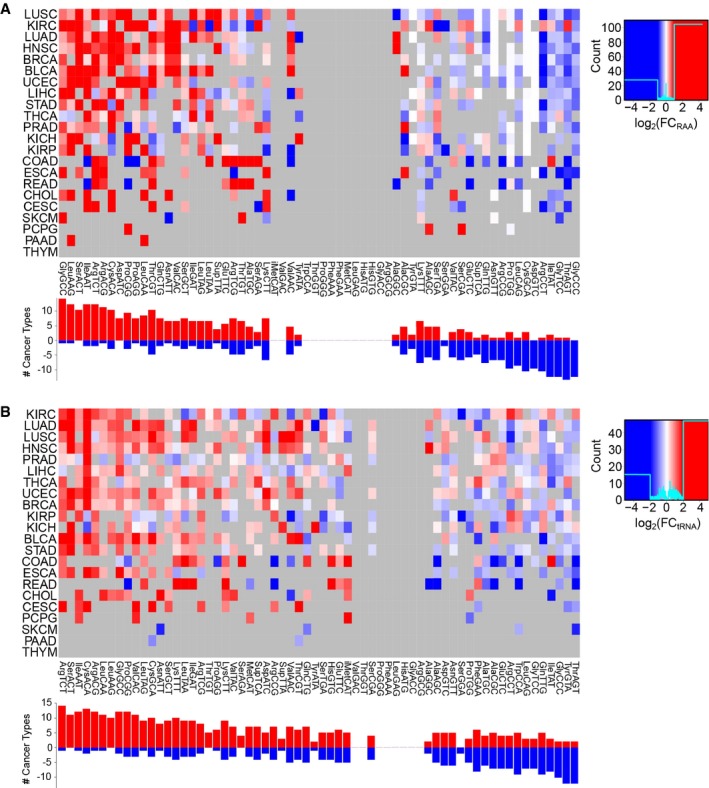
tRNA abundance is measured as relative anticodon abundance, and the fold change is log2(RAATumor/RAAHealthy). Refer to Table EV4 for full cancer type names and number of samples.
Absolute tRNA differential abundance by log2(tRNATumor/tRNAHealthy). Only significant differences are colored, which are determined using a two‐tailed Wilcoxon rank‐sum test and corrected for multiple testing by FDR.
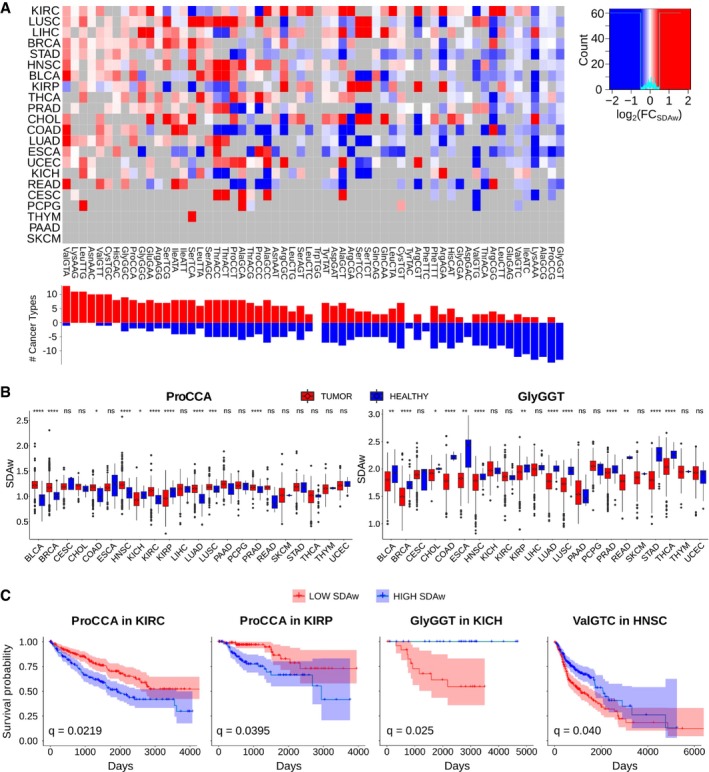
Differential SDAw between healthy and tumor samples across 22 cancer types, as measured by log2(SDAwTumor/SDAwHealthy). Only significant differences are colored, which are determined using a two‐tailed Wilcoxon rank‐sum test and corrected for multiple testing by FDR. Refer to Table EV4 for full cancer type names and number of samples.
Boxplot of the SDAw of ProCAA and AlaGCG codons across TCGA cancer types. Boxes expand from the first to the third quartile, with the center values indicating the median. The whiskers define a confidence interval of median ± 1.58*IQR/sqrt(n). Statistical differences are determined using a FDR‐corrected two‐tailed Wilcoxon rank‐sum test ns (P > 0.05), * (P ≤ 0.05), ** (P ≤ 0.01), *** (P ≤ 0.001), **** (P ≤ 0.0001).
Survival curves for the previous codons in KIRC, KIRP, and BLCA patients. The survival analysis was performed for all codons whose SDAw were significantly different in more than 5 cancer types in the one direction with respect to the other [Abs(UP‐DOWN) > 5] and correspondingly corrected for multiple comparisons using FDR.
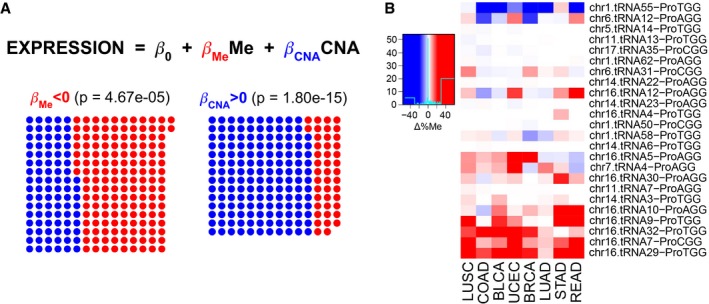
A multiple linear regression (MLR) between square‐root‐normalized tRNA abundance and the average promoter methylation (450K BeadChip array) and gene copy number at the isoacceptor level. Among all MLRs for each isoacceptor and each cancer type separately, the dots show the FDR‐normalized significant coefficients based on their corresponding t‐statistic P‐value, and red/blue shows whether they are negative/positive, respectively. The P‐value corresponds to a two‐tailed binomial test between npos and nneg.
Differential promoter methylation (bisulfite sequencing) between healthy and tumor samples of genes expressing proline tRNAs, as measured by Δ%Me = (%MeTumor‐%MeHealthy). Refer to Table EV4 for full cancer type names and number of samples.
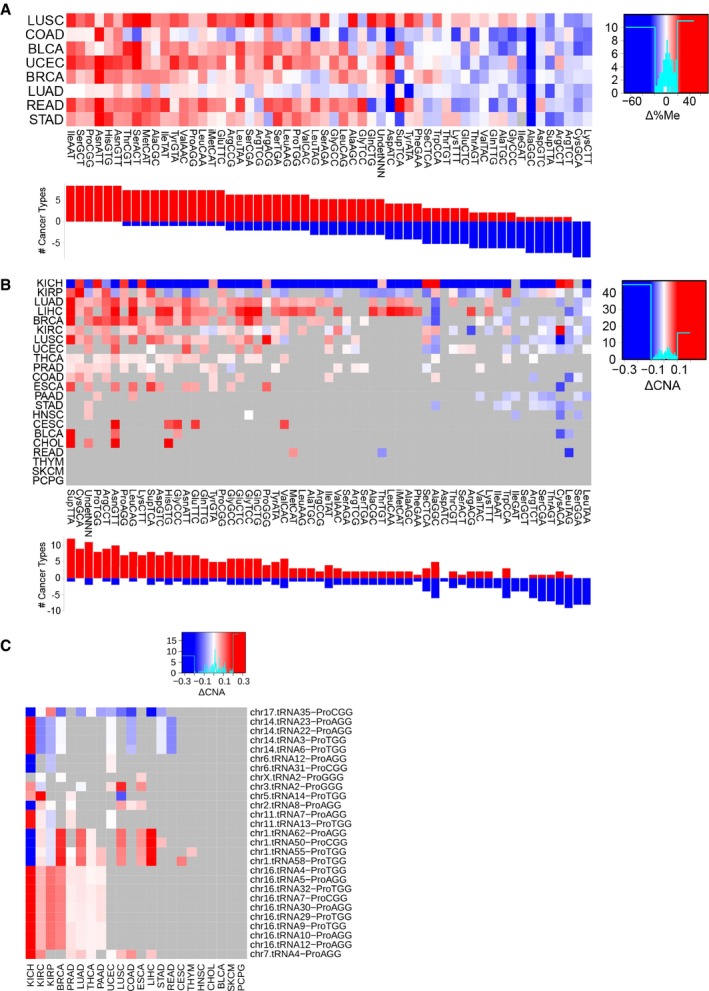
Differential average methylation (bisulfite sequencing) for the isoacceptors, averaged over all genes that have a certain anticodon. The difference is measured by Δ%Me = (%MeTumor‐%MeHealthy). Refer to Table EV4 for full cancer type names and number of samples.
Differential average gene copy number for the isoacceptors, averaged over all genes that have a certain anticodon. The difference is measured by ΔCNA = (CNATumor‐CNAHealthy). Only significant differences are colored, which are determined using a two‐tailed Wilcoxon rank‐sum test and corrected for multiple testing by FDR.
Differential gene copy number between healthy and tumor samples of genes expressing proline tRNAs, as measured by ΔCNA. Only significant differences are colored, which are determined using a two‐tailed Wilcoxon rank‐sum test and corrected for multiple testing by FDR.
References
-
- Alexaki A, Kames J, Holcomb DD, Athey J, Santana‐Quintero LV, Lam PVN, Hamasaki‐Katagiri N, Osipova E, Simonyan V, Bar H et al (2019) Codon and codon‐pair usage tables (CoCoPUTs): facilitating genetic variation analyses and recombinant gene design. J Mol Biol 431: 2434–2441 - PubMed
-
- Altschul SF, Gish W, Miller W, Myers EW, Lipman DJ (1990) Basic local alignment search tool. J Mol Biol 215: 403–410 - PubMed
-
- Benisty H, Weber M, Hernandez‐Alias X, Schaefer MH, Serrano L (2019b) ArrayExpress E‐MTAB‐8144 https://www.ebi.ac.uk/arrayexpress/experiments/E-MTAB-8144/ [DATASET]
Publication types
MeSH terms
Substances
Associated data
- Actions
- Actions
- Actions
- SRA/SRR1304304
- SRA/SRR2060090
- SRA/ERR705691
- SRA/ERR705692
LinkOut - more resources
Full Text Sources
Medical
Molecular Biology Databases
