. 2020 Apr 1;130(4):1863-1878.
doi: 10.1172/JCI126567.

TYK2 inhibition reduces type 3 immunity and modifies disease progression in murine spondyloarthritis

Affiliations

TYK2 inhibition reduces type 3 immunity and modifies disease progression in murine spondyloarthritis

Eric Gracey et al. J Clin Invest. .

Abstract

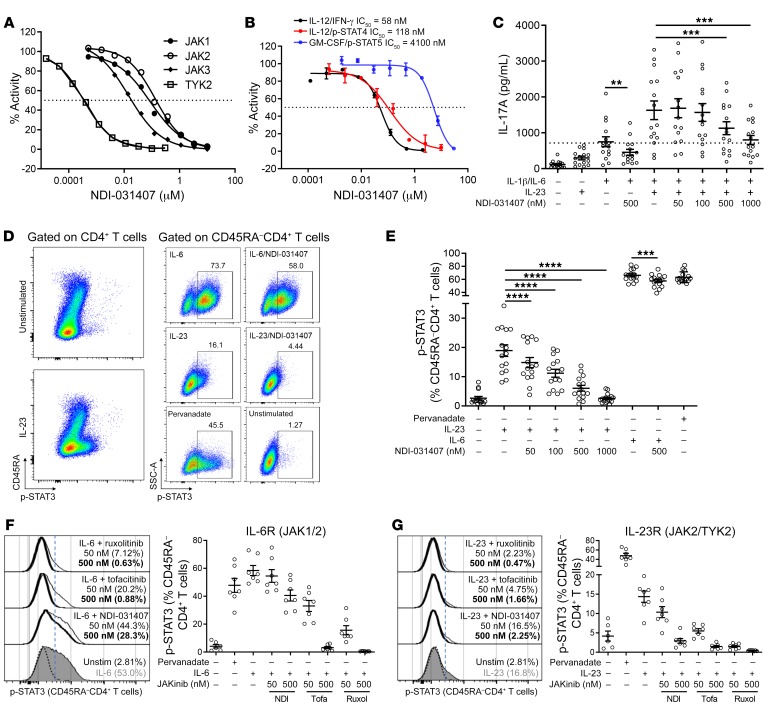
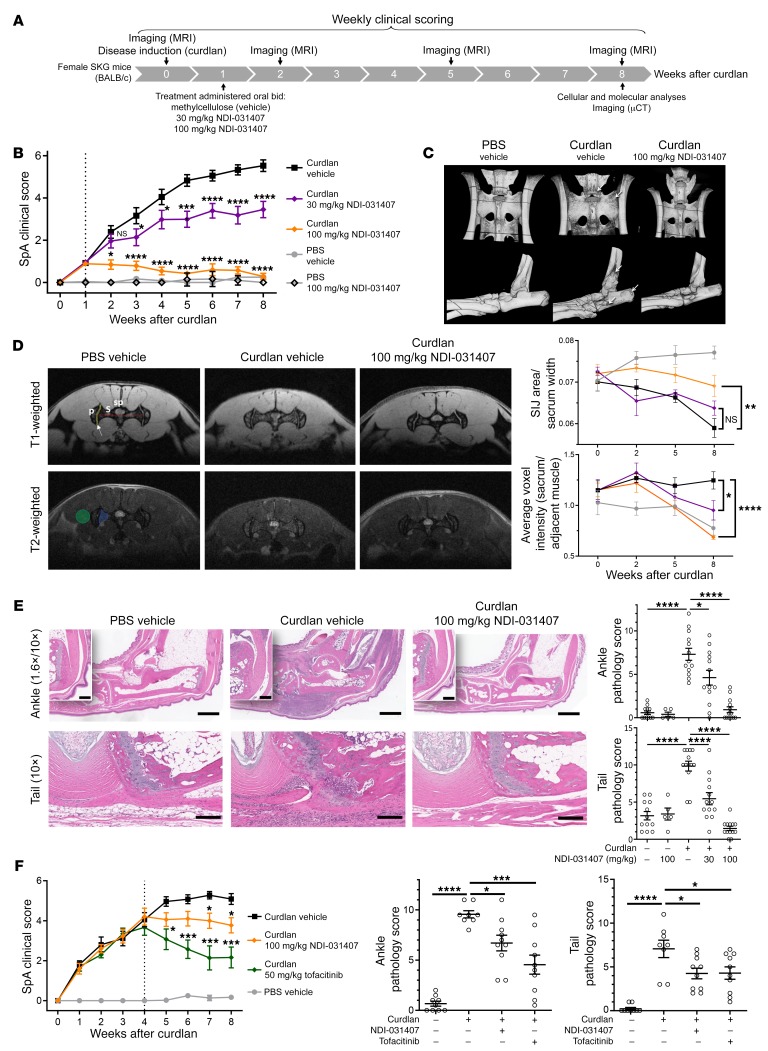
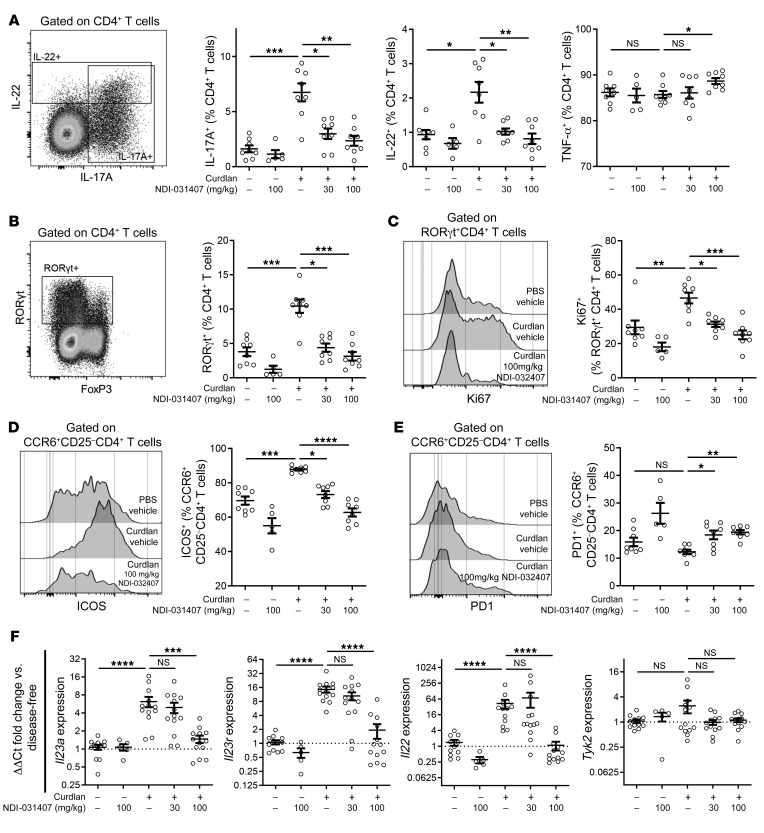
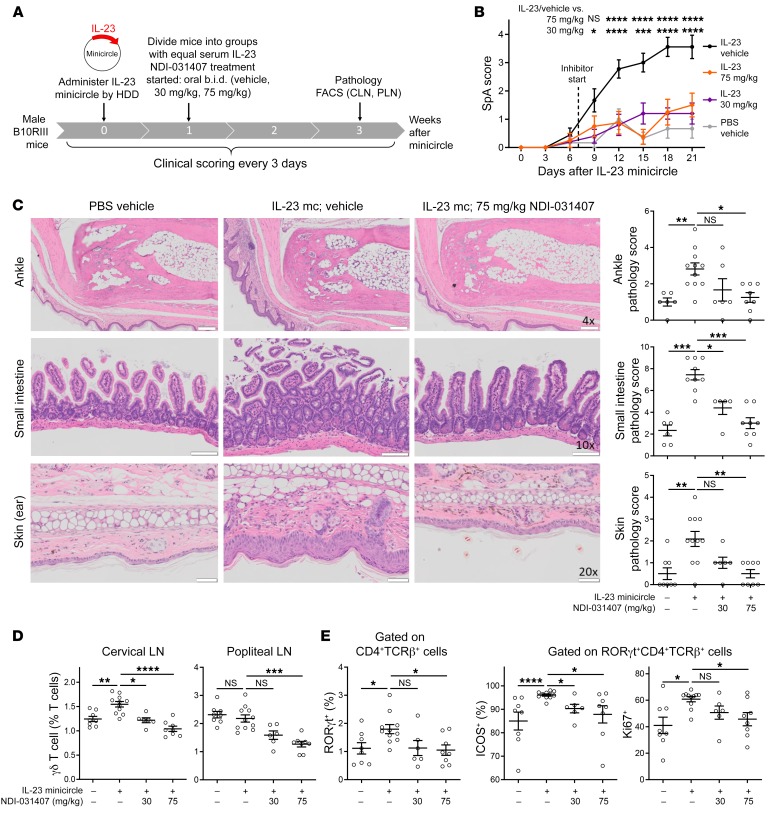
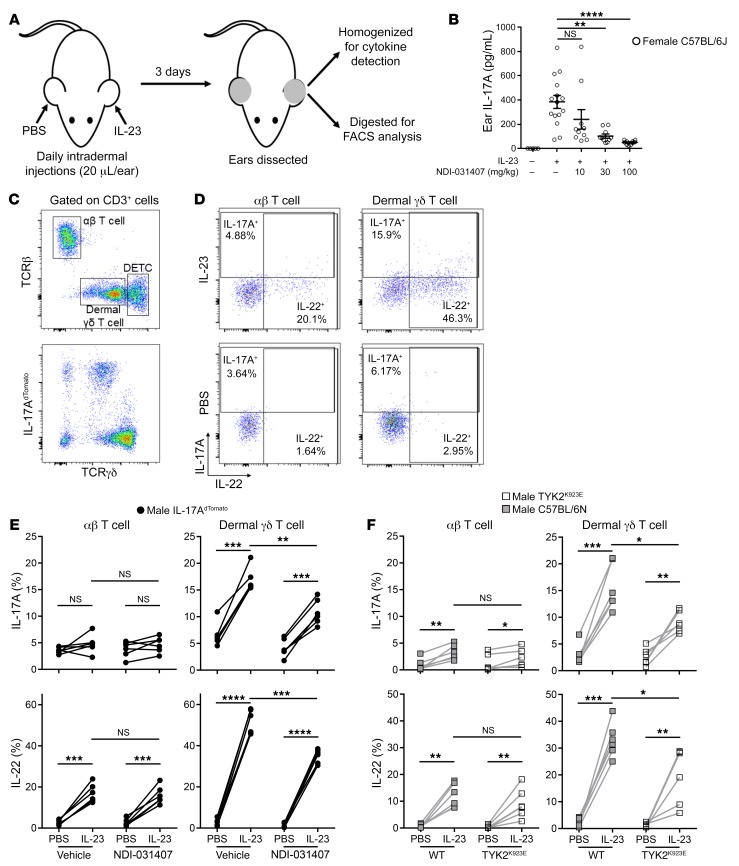
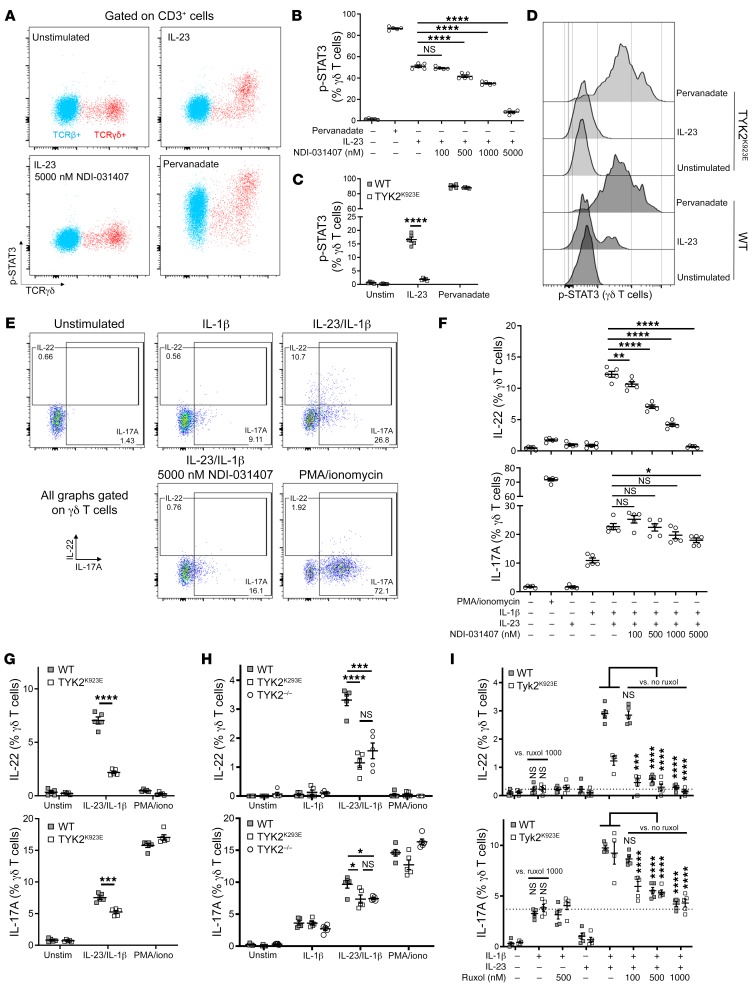
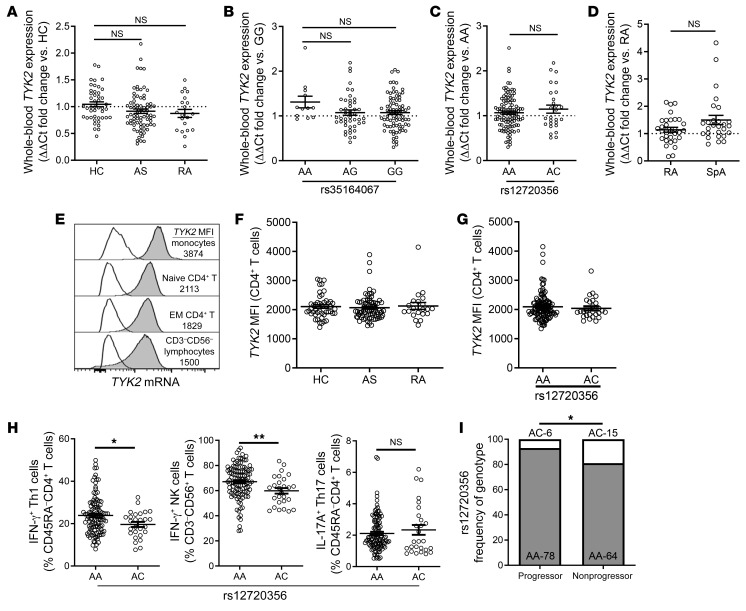
Spondyloarthritis (SpA) represents a family of inflammatory diseases of the spine and peripheral joints. Ankylosing spondylitis (AS) is the prototypic form of SpA in which progressive disease can lead to fusion of the spine. Therapeutically, knowledge of type 3 immunity has translated into the development of IL-23- and IL-17A-blocking antibodies for the treatment of SpA. Despite being able to provide symptomatic control, the current biologics do not prevent the fusion of joints in AS patients. Thus, there is an unmet need for disease-modifying drugs. Genetic studies have linked the Janus kinase TYK2 to AS. TYK2 is a mediator of type 3 immunity through intracellular signaling of IL-23. Here, we describe and characterize a potentially novel small-molecule inhibitor of TYK2 that blocked IL-23 signaling in vitro and inhibited disease progression in animal models of SpA. The effect of the inhibitor appears to be TYK2 specific, using TYK2-inactive mice, which further revealed a duality in the induction of IL-17A and IL-22 by IL-23. Specifically, IL-22 production was TYK2/JAK2/STAT3 dependent, while IL-17A was mostly JAK2 dependent. Finally, we examined the effects of AS-associated TYK2 SNPs on TYK2 expression and function and correlated them with AS disease progression. This work provides evidence that TYK2 inhibitors have great potential as an orally delivered therapeutic for SpA.

Keywords: Arthritis; Autoimmunity; Cytokines; T cells; Therapeutics.


Conflict of interest statement

Conflict of interest: WW, WM, and CM are employees of Nimbus Therapeutics.

Figures

Figure 1
Figure 1. TYK2 inhibition by a novel small molecule blocks IL-23–induced STAT3 phosphorylation and IL-17A production in human CD4+ T cells.
(A and B) NDI-031407, a novel TYK2 inhibitor, was tested for: (A) Specificity for TYK2 against JAK1–3 kinases by radiometric assay with peptide substrates. Activity represents the ratio of activated substrate in DMSO versus inhibitor treatment. (B) Potency for IL-12–induced p-STAT4 and GM-CSF–induced p-STAT5 in PMBCs and IL-12–induced IFN-γ in NK92 cells. Activity represents the ratio of p-STAT to total STAT. Data in A and B are from a single experiment, representative of 3 independent experiments. The horizontal lines represent 50% inhibition. (C) Magnetically purified CD4+ T cells were cultured with anti-CD2/CD3/CD28 beads for 3 days with NDI-031407 in the presence of 20 ng/mL of cytokines. At endpoint, IL-17A was assessed in the culture supernatant by ELISA. (DG) PBMCs were stimulated for 4 days with anti-CD2/CD3/CD28 beads. Cells were then serum-starved and pretreated with JAKinib for 30 minutes before 15-minute stimulation with pervanadate, 400 ng/mL IL-6, or 400 ng/mL IL-23. STAT phosphorylation was assessed by flow cytometry. (D) Representative dot plots showing p-STAT3 in relation to mature CD4+ T cells (left) and representative gating for p-STAT3+ cells in mature CD4+ T cells with the indicated treatments (right). (E) Pooled data showing p-STAT3 in mature CD4+ T cells. (F and G) Comparison of NDI-031407, tofacitinib, and ruxolitinib inhibition of IL-23R and IL-6R. Representative histograms show p-STAT3 in mature CD4+ T cells: unstimulated (black dashed line), cytokine-stimulated (gray shading), or 50 nM (thin lines) and 500 nM (thick lines) of the respective JAKinib. Threshold used to gate p-STAT3+ (blue dashed line) and percentage positive are indicated in parentheses. Graph title indicates the cytokine-associated JAKs. (C and E) IL-6/vehicle vs. IL-6/500 nM NDI-031407 by Wilcoxon matched-pairs signed-rank test and stimulated/vehicle-treated wells vs. stimulated/NDI-031407–treated wells by paired 1-way ANOVA with Dunnett’s post hoc test comparing treatments with vehicle control. For all scatter plots, each point represents an independent donor. **P < 0.01, ***P < 0.001, ****P < 0.0001.
Figure 2
Figure 2. TYK2 inhibition by small molecule prevents SpA disease progression in SKG mice.
Female SKG mice were treated with curdlan to induce SpA-like disease, or with PBS as disease-free controls. (A) Overview of experiment and readouts for BE. At 1 week after curdlan treatment, mice began treatment with NDI-031407 at the indicated dosages by gavage twice daily. (B) Mice (n = 12–13 per group) were scored weekly for SpA symptoms (blepharitis, arthritis, and dermatitis). (C) Representative postmortem μCT images of pelvis (dorsal view) and ankles (lateral view) from mice in the indicated groups. Arrows point to sites of entheseal erosion. (D) MRI of the sacroiliac joint (SIJ; coronal plane) in live mice. T1 weighing was used to assess SIJ area as a ratio to sacrum width. SP, spinal cord; S, sacrum; P, pelvis; red line, sacrum width; yellow area/white arrow, SIJ space. Scale bar: 5 mm. T2 weighing was used to assess bone marrow edema in the sacrum (blue area) normalized to adjacent muscle (green area). Representative images at 8 weeks after disease induction. Pooled data from 5 mice per group. Group colors are the same as in B. (E) H&E staining and scoring of tissue at 8 weeks after curdlan. Scale bars: 1 mm for 1.6× and 200 μm for 10×. (F) SKG mice were treated from 4 weeks after curdlan (therapeutically) with NDI-031407 or tofacitinib for 4 weeks (n = 9–10 per group). Data in B, D, and F were assessed by 2-way ANOVA, with time considered as dependent variable. Means of curdlan/NDI-031407–treated animals compared with curdlan/vehicle-treated controls at each time point by Dunnett’s post hoc test. For pathology scoring (E and F), each point represents a single mouse; disease-free vs. curdlan/vehicle animals were analyzed by unpaired t test, NDI-031407–treated vs. vehicle-treated animals by 1-way ANOVA with Dunnett’s post hoc test. *P < 0.05, **P < 0.01, ***P < 0.001, ****P < 0.0001.
Figure 3
Figure 3. TYK2 inhibition by small molecule normalizes the Th17 expansion in diseased SKG mice.
(AE) Flow cytometry performed on sciatic lymph nodes (SLNs) at 8 weeks after disease induction (curdlan), with TYK2 inhibitor (NDI-031407) treatment beginning 1 week after disease induction. SLN cells were restimulated with PMA/ionomycin before staining for selected cytokines (A). Unstimulated SLN cells were stained for transcription factors (B), Ki67 (C), and the activation markers ICOS (D) and PD1 (E). Representative plots in A and B from diseased, vehicle-treated SKG mouse. (F) qPCR performed on mRNA extracted from skinless, whole ankles for selected Th17-associated genes and Tyk2. Genes of interest were normalized to Rpl4. For all graphs, disease-free mice compared with curdlan/vehicle-treated mice by Mann-Whitney test. Curdlan/NDI-031407–treated mice compared with curdlan/vehicle controls by Kruskal-Wallis test with Dunn’s post hoc test. Each data point represents a single mouse. *P < 0.05, **P < 0.01, ***P < 0.001, ****P < 0.0001.
Figure 4
Figure 4. TYK2 inhibition by small molecule suppresses systemic IL-23–induced type 3 immunity in vivo.
(A) Schematic of experiment. IL-23–expressing minicircle was administered by hydrodynamic delivery (HDD) to male B10RIII mice. At 1 week after minicircle administration, NDI-031407 was administered by gavage twice daily for 2 weeks. Clinical scoring for blepharitis, dermatitis, and arthritis was assessed every 3 days. (B) Pooled data for clinical scores (n = 5–8 per group). (C) Representative images of H&E-stained tissue at 3 weeks after minicircle administration; data pooled from each mouse shown in adjacent graphs. Scale bars: 200 μm for 4×, 100 μm for 10×, 50 μm for 20×. (D and E) At 3 weeks after minicircle administration, ear-draining (CLNs) and joint-draining (PLNs) lymph nodes were harvested for flow cytometric analysis of T cell subsets by transcription factor expression. (D) γδ T cell (TCRγδ+TCRβ) frequency in draining lymph nodes. (E) Th17 cell frequency and activation status in the PLN. Data in B were analyzed by 2-way ANOVA with data paired over time. Average of minicircle/vehicle-treated mice compared with that of minicircle/NDI-031407–treated mice by Dunn’s post hoc test. In all other graphs, disease-free mice compared with minicircle/vehicle-treated mice by Mann-Whitney test and minicircle/NDI-031407 compared with minicircle/vehicle by Kruskal-Wallis test with Dunn’s post hoc test. For all scatter plots, each point represents a single mouse. *P < 0.05, **P < 0.01, ***P < 0.001, ****P < 0.0001.
Figure 5
Figure 5. TYK2 inhibition by small molecule or genetic mutation suppresses local IL-23–induced type 3 immunity in vivo.
(A) Overview of intradermal model of local IL-23 inflammation. IL-23 (400 ng) was administered by intradermal injection into one ear and PBS into the contralateral ear of mice for 3 consecutive days. For experiments involving NDI-031407, the indicated dose or 100 mg/kg was administered by gavage twice daily, starting 1 day before ear injections. (B) IL-17A assessed in whole-ear homogenate by Luminex assay. (C) Ears from a healthy mouse were enzymatically digested for analysis by flow cytometry. Dermal/epidermal T cell populations were identified in live CD45+CD3+ cells (top) and cytokines were assessed by staining for IL-17 and IL-22 in Il17aCre.Rosa26dTomato (IL-17AdTomato) reporter mice (bottom). (DF) Brefeldin A was administered i.p. 5 hours before mouse sacrifice for intracellular cytokine analysis by flow cytometry. (D) Representative plots showing cytokine expression in dermal T cell populations of vehicle-treated mice. (E) Pooled data demonstrating in vivo IL-23–induced T cell IL-17A/IL-22 in the presence of NDI-031407. (F) In vivo IL-23–induced T cell IL-17A/IL-22 in mice expressing a kinase-inactive TYK2 (TYK2K923E). For all graphs, IL-23–treated ear compared with PBS-treated ear by paired t test; IL-23–treated ears from vehicle vs. NDI-031407 or WT vs. TYK2K923E compared by unpaired t test with Welch’s correction. For graphs in B, E, and F, each point represents data from a single mouse. *P < 0.05, **P < 0.01, ***P < 0.001, ****P < 0.0001.
Figure 6
Figure 6. TYK2 inhibition by small molecule and genetic mutation suppresses IL-23–induced activation of murine T cells in vitro.
Lymph node cells were stimulated in vitro, and γδ T cell activation was assessed by flow cytometry. (A and B) Lymphocytes were preincubated with NDI-031407 for 30 minutes before stimulation for 15 minutes with 400 ng/mL IL-23. (A) Representative plots showing p-STAT3 staining under IL-23 or pervanadate stimulation in αβ and γδ T cells. (B) Pooled data of NDI-031407–treated, IL-23–stimulated γδ T cells. (C and D) Representative plots and pooled data of p-STAT3 in γδ T cells under IL-23 stimulation in TYK2 kinase-dead mice (TYK2K923E). (EH) Lymphocytes were stimulated with 10 ng/mL IL-1β and/or 20 ng/mL IL-23 with brefeldin A for 4.5 hours before detection of IL-17A/IL-22 in γδ T cells by flow cytometry. Where applicable, lymphocytes were treated with NDI-031407 for 30 minutes before stimulation. (E) Representative plots showing cytokine staining in γδ T cells. (F) Pooled data of IL-17A+ and IL-22+ γδ T cells treated with NDI-031407. (G and H) IL-23/IL-1β stimulation of TYK2K923E (G) and TYK2–/– (H) lymphocytes. (I) IL-23/IL-1β stimulation of TYK2K923E lymphocytes with pan-JAK inhibitor ruxolitinib. Data are mean ± SEM whereby each data point is a separate well. All data are from a single experiment representative of 2–3 independent experiments. D and G, t test with Welch’s correction; B and F, 1-way ANOVA with Dunnett’s post hoc test compared with cytokine-stimulated/vehicle control; H, 1-way ANOVA with Dunnett’s post hoc test. In I, IL-1β only was compared with IL-1β/IL-23/1000 nM ruxolitinib for each genotype by t test with Welch’s correction, and 2-way ANOVA was used to compare all IL-1β/IL-23–stimulated cells and Dunnett’s multiple-comparisons test to compare vehicle- vs. ruxolitinib-treated samples within each genotype. *P < 0.05, **P < 0.01, ***P < 0.001, ****P < 0.0001.
Figure 7
Figure 7. AS-associated SNPs at the TYK2 locus do not alter TYK2 expression, but correlate with altered Th1 frequency and AS disease progression.
qPCR was used to assess whole-blood TYK2 expression in a cohort of 47 healthy controls (HC), 76 ankylosing spondylitis patients (AS), and 21 rheumatoid arthritis patients (RA) by patient type (A) and rs35164067 (B) and rs12720356 (C) genotypes. (D) TYK2 expression in peripheral joint synovial biopsies measured by qPCR. PrimeFlow was used to detect TYK2 mRNA by flow cytometry. (E) Representative histograms showing TYK2 mRNA expression in selected cell populations. White histograms represent FMO controls, gray histograms represent TYK2-stained cells. Values under cell populations are the respective MFIs of TYK2. (F) TYK2 MFI in CD4+ T cells by patient group. (G) AS/RA/HC subjects were pooled to assess TYK2 expression by rs12720356 genotype. (H) PBMCs from the same cohort were stimulated with PMA/ionomycin for IL-17A and IFN-γ detection by flow cytometry. AS, RA, and HC pooled and data stratified by rs12720356. (I) Frequency chart of rs12720356 genotype assessed in a separate cohort of AS patients with progressing (n = 84) or nonprogressing (n = 79) disease based on mSASSS scores. qPCR analysis in AC was normalized to HPRT expression and to GAPDH in D. A and B, 1-way ANOVA with Tukey post hoc test; C, D, and H, Mann-Whitney test; I, Fisher’s exact test. *P < 0.05, **P < 0.01.

Comment in

  • TYK2 inhibition halts SpA.
    Onuora S. Onuora S. Nat Rev Rheumatol. 2020 May;16(5):248. doi: 10.1038/s41584-020-0417-1. Nat Rev Rheumatol. 2020. PMID: 32231302 No abstract available.

References

    1. Taurog JD, Chhabra A, Colbert RA. Ankylosing spondylitis and axial spondyloarthritis. N Engl J Med. 2016;374(26):2563–2574. doi: 10.1056/NEJMra1406182. - DOI - PubMed
    1. Kaeley GS, Eder L, Aydin SZ, Gutierrez M, Bakewell C. Enthesitis: a hallmark of psoriatic arthritis. Semin Arthritis Rheum. 2018;48(1):35–43. doi: 10.1016/j.semarthrit.2017.12.008. - DOI - PubMed
    1. Chorus AM, Miedema HS, Boonen A, Van Der Linden S. Quality of life and work in patients with rheumatoid arthritis and ankylosing spondylitis of working age. Ann Rheum Dis. 2003;62(12):1178–1184. doi: 10.1136/ard.2002.004861. - DOI - PMC - PubMed
    1. van der Linden S, Valkenburg HA, Cats A. Evaluation of diagnostic criteria for ankylosing spondylitis. A proposal for modification of the New York criteria. Arthritis Rheum. 1984;27(4):361–368. doi: 10.1002/art.1780270401. - DOI - PubMed
    1. Taylor W, et al. Classification criteria for psoriatic arthritis: development of new criteria from a large international study. Arthritis Rheum. 2006;54(8):2665–2673. doi: 10.1002/art.21972. - DOI - PubMed

Publication types

MeSH terms

Grants and funding