. 2020 Apr 1;130(4):1948-1960.
doi: 10.1172/JCI127750.

Claudin-2 deficiency associates with hypercalciuria in mice and human kidney stone disease

Affiliations

Claudin-2 deficiency associates with hypercalciuria in mice and human kidney stone disease

Joshua N Curry et al. J Clin Invest. .

Abstract

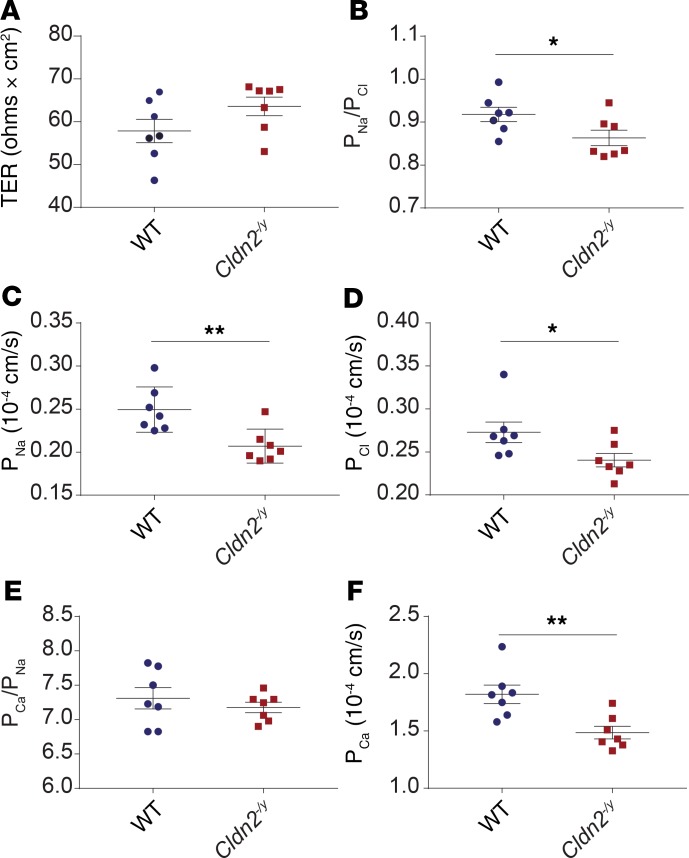
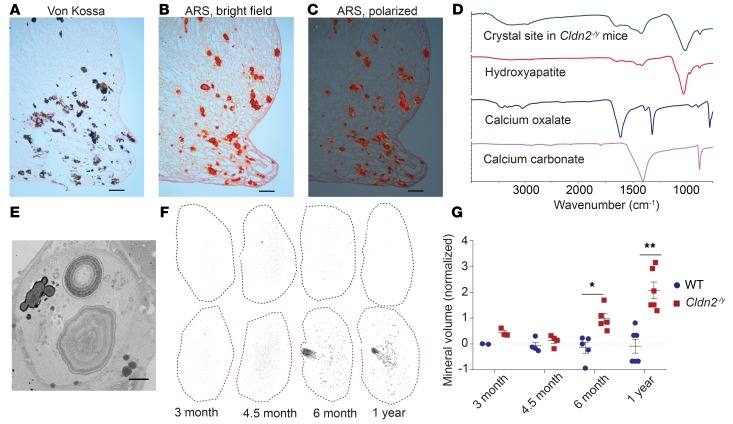
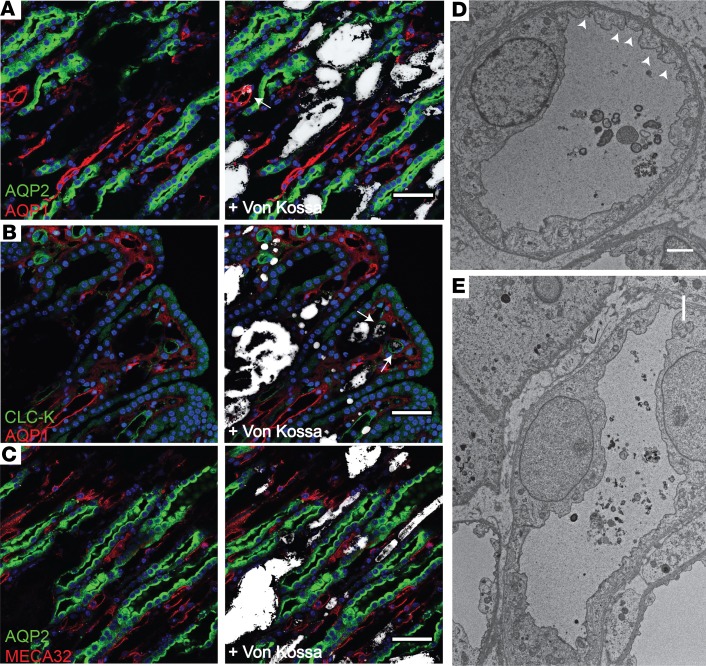
The major risk factor for kidney stone disease is idiopathic hypercalciuria. Recent evidence implicates a role for defective calcium reabsorption in the renal proximal tubule. We hypothesized that claudin-2, a paracellular cation channel protein, mediates proximal tubule calcium reabsorption. We found that claudin-2-null mice have hypercalciuria due to a primary defect in renal tubule calcium transport and papillary nephrocalcinosis that resembles the intratubular plugs in kidney stone formers. Our findings suggest that a proximal tubule defect in calcium reabsorption predisposes to papillary calcification, providing support for the vas washdown hypothesis. Claudin-2-null mice were also found to have increased net intestinal calcium absorption, but reduced paracellular calcium permeability in the colon, suggesting that this was due to reduced intestinal calcium secretion. Common genetic variants in the claudin-2 gene were associated with decreased tissue expression of claudin-2 and increased risk of kidney stones in 2 large population-based studies. Finally, we describe a family in which males with a rare missense variant in claudin-2 have marked hypercalciuria and kidney stone disease. Our findings indicate that claudin-2 is a key regulator of calcium excretion and a potential target for therapies to prevent kidney stones.

Keywords: Calcium; Cell Biology; Epithelial transport of ions and water; Nephrology; Transport.


Conflict of interest statement

Conflict of interest: The authors have declared that no conflict of interest exists.

Figures

Figure 1
Figure 1. Bone mineral metabolism is normal in Cldn2–/y mice.
Bone analysis of WT (blue) and Cldn2–/y (red) animals on a standard chow diet. (A and B) Total (A) and lumbar (B) bone mineral density (BMD) was measured using DEXA at 4.7, 6, 8, and 10 weeks (n = 14–18 per group). A group of these animals was started on a low-calcium diet for 4 weeks and BMD measured weekly (n = 4 per group). (C) Representative micro-CT reconstructions of femurs showing normal cortical and trabecular bone in Cldn2–/y mice. (D and E) Total BMD (D) and total bone mineral content (BMC) (E) were measured in 1-year-old animals by DEXA (n = 5 per group). There were no significant differences between groups using unpaired 2-tailed t test. Bars are mean ± SEM.
Figure 2
Figure 2. Hypercalciuria in Cldn2–/y mice is sensitive to dietary calcium intake.
(A) Metabolic cage experiments show 24-hour urine calcium (Ca2+) excretion on control diet until day 5, after which half of the animals (n = 5–7 per group) are switched to a calcium-deficient diet (<0.01% calcium). At day 10, the experiment was terminated and serum was collected. (B) Fractional excretion of calcium (FECa) at day 10. (CE) Serum Ca2+ (C), serum inorganic phosphorus (D), and serum intact parathyroid hormone (1–84) (E) at day 10. Bars are mean ± SEM. *P < 0.05, ****P < 0.0001 using 2-way ANOVA with Bonferroni’s correction for multiple comparisons.
Figure 3
Figure 3. Calcium balance studies in Cldn2–/y mice and WT controls.
Mice were housed in metabolic cages for 3 days, during which urine and feces were collected for measurement of calcium, and dietary consumption determined by weighing of the food. (AC) Normal-calcium (0.6%) diet (n = 11 per group). (DF) Calcium-deficient (<0.01%) diet (n = 6–7 per group). (A and D) Total 3-day urinary calcium excretion. (B and E) Total 3-day intestinal calcium absorption (calcium consumed minus fecal calcium content). (C and F) Net calcium balance (intestinal absorption minus urinary excretion). Bars are mean ± SEM. *P < 0.05, ****P < 0.0001 using unpaired 2-tailed t test.
Figure 4
Figure 4. Everted sac assays of intestinal permeability.
(A) Serosal-to-mucosal calcium flux assayed in different intestinal segments in high-calcium (5.0 mM) solution (n = 6–8 mice per group). (B) Summary of intestinal permeability determined in duodenum (Du), ileum (Il), and colon (Co) in the presence of low-Ca (0.25 mM) or high-Ca (5.0 mM) solution. SM, serosal-to-mucosal direction; MS, mucosal-to-serosal direction (n = 6–10 mice per group). Fixed-factor ANOVA (independent variables: segment, calcium, direction, and genotype) showed a significant interaction of segment with genotype. Permeability was significantly lower in Cldn2–/y compared with WT mice in the colon (*P = 0.001 by simple main effects analysis), but not in the duodenum or ileum.
Figure 5
Figure 5. Ussing chamber measurements of intestinal ion permeability.
Permeability properties of proximal colon tissue in WT and Cldn2–/y mice. (A) Transepithelial resistance (TER). (BD) PNa/PCl (B), PNa (C), and PCl (D) as determined from dilution potential measurement. (E and F) PCa/PNa (E) and PCa (F) as determined from bi-ionic potentials (n = 7 per group). Individual ion permeabilities were estimated by the method of Kimizuka and Koketsu. Bars are mean ± SEM. *P < 0.05, **P = 0.005 using unpaired 2-tailed t test. PX, transepithelial permeability to X.
Figure 6
Figure 6. Calcium deposits in the papilla of Cldn2–/y mice.
(AC) Representative kidney sections from 6-month-old Cldn2–/y mice were stained and visualized with the following methods: (A) Von Kossa. (B) Alizarin red S (ARS), pH 4.2, bright field. (C) ARS, pH 4.2, polarized light. Scale bars: 100 μm. (D) Micro-FTIR analysis shows that deposits are composed of primarily hydroxyapatite. (E) TEM reveals large-diameter aggregates of matrix and mineral with laminated deposits characteristic of hydroxyapatite. Scale bar: 2 μm. (F and G) Representative 3D reconstructions of micro-CT analysis of kidneys from WT (blue outline) and Cldn2–/y (red outline) (F) and quantitation of the mineral volume in reconstruction analysis (n = 2–5 per group) (G). Data were normalized for each time point and log-transformed before plotting for analysis. Bars are mean ± SEM. At each time point, differences between WT and Cldn2–/y were analyzed by unpaired t test and corrected for multiple comparisons using the Bonferroni-Dunn method; *P < 0.05, **P < 0.01.
Figure 7
Figure 7. Nephrocalcinosis occurs within the loops of Henle of Cldn2–/y mice.
(AC) Confocal microscopy of papillary sections from Cldn2–/y mice shows von Kossa staining of deposits (pseudocolored white) colabeled with the following tubule markers: (A) Inner medullary collecting duct (AQP2) and thin descending limbs (AQP1). (B) Thin descending limbs (AQP1) and thin ascending limbs (CLC-K). (C) Inner medullary collecting ducts (AQP2) and vasa recta (MECA32). Association of calcium deposits with tubule markers is infrequent, but instances of colocalization with AQP1- or CLC-K–positive thin limbs are occasionally seen (arrows in A and B). Scale bars: 50 μm. (D and E) Electron microscopy of papillae from 5-month-old Cldn2–/y mice shows small mineral deposits within type 4 thin descending limb cells with frequent tight junctions (arrowheads) (D) as well as type 3 thin ascending limb cells lacking these features (E). Scale bars: 2 μm.

Comment in

Similar articles

Cited by

References

    1. Scales CD, Smith AC, Hanley JM, Saigal CS, Urologic Diseases in America Project Prevalence of kidney stones in the United States. Eur Urol. 2012;62(1):160–165. doi: 10.1016/j.eururo.2012.03.052. - DOI - PMC - PubMed
    1. Resnick M, Pridgen DB, Goodman HO. Genetic predisposition to formation of calcium oxalate renal calculi. N Engl J Med. 1968;278(24):1313–1318. doi: 10.1056/NEJM196806132782403. - DOI - PubMed
    1. Goldfarb DS, Fischer ME, Keich Y, Goldberg J. A twin study of genetic and dietary influences on nephrolithiasis: a report from the Vietnam Era Twin (VET) Registry. Kidney Int. 2005;67(3):1053–1061. doi: 10.1111/j.1523-1755.2005.00170.x. - DOI - PubMed
    1. Urabe Y, et al. A genome-wide association study of nephrolithiasis in the Japanese population identifies novel susceptible loci at 5q35.3, 7p14.3, and 13q14.1. PLoS Genet. 2012;8(3):e1002541. doi: 10.1371/journal.pgen.1002541. - DOI - PMC - PubMed
    1. Thorleifsson G, et al. Sequence variants in the CLDN14 gene associate with kidney stones and bone mineral density. Nat Genet. 2009;41(8):926–930. doi: 10.1038/ng.404. - DOI - PubMed

Publication types