. 2020 Apr 1;130(4):1977-1990.
doi: 10.1172/JCI130308.

Angiopoietin-2 blockade ameliorates autoimmune neuroinflammation by inhibiting leukocyte recruitment into the CNS

Affiliations

Angiopoietin-2 blockade ameliorates autoimmune neuroinflammation by inhibiting leukocyte recruitment into the CNS

Zhilin Li et al. J Clin Invest. .

Abstract

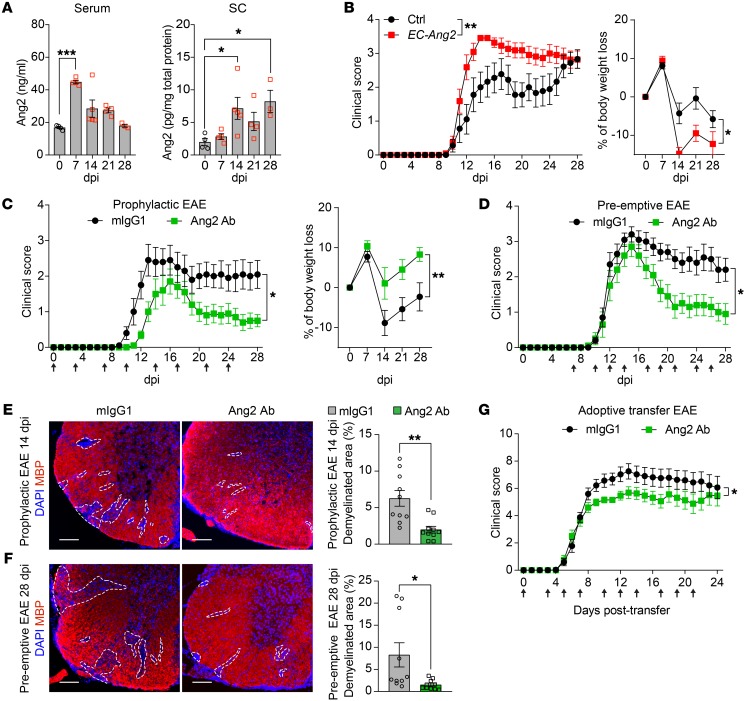
Angiopoietin-2 (Ang2), a ligand of the endothelial Tie2 tyrosine kinase, is involved in vascular inflammation and leakage in critically ill patients. However, the role of Ang2 in demyelinating central nervous system (CNS) autoimmune diseases is unknown. Here, we report that Ang2 is critically involved in the pathogenesis of experimental autoimmune encephalomyelitis (EAE), a rodent model of multiple sclerosis. Ang2 expression was induced in CNS autoimmunity, and transgenic mice overexpressing Ang2 specifically in endothelial cells (ECs) developed a significantly more severe EAE. In contrast, treatment with Ang2-blocking Abs ameliorated neuroinflammation and decreased spinal cord demyelination and leukocyte infiltration into the CNS. Similarly, Ang2-binding and Tie2-activating Ab attenuated the development of CNS autoimmune disease. Ang2 blockade inhibited expression of EC adhesion molecules, improved blood-brain barrier integrity, and decreased expression of genes involved in antigen presentation and proinflammatory responses of microglia and macrophages, which was accompanied by inhibition of α5β1 integrin activation in microglia. Taken together, our data suggest that Ang2 provides a target for increasing Tie2 activation in ECs and inhibiting proinflammatory polarization of CNS myeloid cells via α5β1 integrin in neuroinflammation. Thus, Ang2 targeting may serve as a therapeutic option for the treatment of CNS autoimmune disease.

Keywords: Autoimmunity; Neurological disorders.


Conflict of interest statement

Conflict of interest: The authors have declared that no conflict of interest exists.

Figures

Figure 1
Figure 1. Ang2 is induced in EAE, and Ang2 blockade ameliorates EAE.
(A) Ang2 protein concentration in the serum and SC lysates at different time points after EAE induction (0 dpi: n = 4; 7 dpi: n = 4; 14 dpi: n = 5; 21 dpi: n = 4; 28 dpi: n = 3). (B) Clinical scores and percentage of body weight loss of control (Ctrl, n = 9) versus EC-Ang2 (n = 11) mice induced with active EAE. (C) Clinical scores and percentages of body weight loss of mice induced with active EAE and treated with mIgG1 versus Ang2 Ab prophylactically (starting at the time of EAE induction; 0 dpi) (n = 10 per group). (D) Clinical scores of mice induced with active EAE and treated with mIgG1 versus Ang2 Ab preemptively (starting during the effector phase of EAE at 7 dpi) (n = 10 per group). (E and F) Representative images and quantifications of MBP staining to show loss of myelin in the SC white matter from both prophylactic 14 dpi and preemptive 28 dpi groups (n = 10 per group). Scale bars: 100 μm. (G) Clinical scores of mice induced with adoptive transfer EAE and treated with mIgG1 versus Ang2 Ab starting at the time of adoptive transfer. Data are pooled from 2 independent experiments (n = 16 per group). Arrows indicate Ab injections. Mean ± SEM, 1-way ANOVA with Dunnett’s post hoc test for multiple comparisons (A), nonparametric Mann-Whitney U test (B-D, and G, comparison of AUC values of clinical EAE scores over the disease course), 2-way repeated measures ANOVA (B and C, body weight loss), and 2-tailed Student’s t test (E and F). *P < 0.05; **P < 0.01; ***P < 0.001.
Figure 2
Figure 2. Prophylactic Ang2 blockade attenuates leukocyte infiltration and inflammation in the SCs of EAE mice.
(A) Flow cytometric quantification of the number of immune cells in the SCs of mIgG1- versus Ang2 Ab–treated EAE mice at 12 dpi (n = 10 per group). (B) RT-qPCR quantification of mRNA levels of Th signature cytokines (Ifng, Tnf, Il4, and Il17a) and integrin subunits (Itga4 and Itgb1) in the SCs of mIgG1- versus Ang2 Ab–treated EAE mice at 14 dpi (n = 10 per group). (C) Flow cytometric quantification of the number of immune cells in the SCs of control (n = 6) versus EC-Ang2 (n = 9) EAE mice at 12 dpi. (D and E) Representative immunofluorescent images and quantifications of Iba1+ microglia and macrophages, Ly-6G+ granulocytes, and CD4+ Th cells in the SCs of mIgG1- versus Ang2 Ab–treated control and EAE mice (n = 10 per group) at 14 dpi as well as in the SCs of control (n = 7) versus EC-Ang2 (n = 8) control and EAE mice at 12 dpi. Scale bars: 100 μm. Mean ± SEM, 2-tailed Student’s t test (A-E), and 2-way ANOVA with Bonferroni’s post hoc test for multiple comparisons (Iba1 staining in D and E). *P < 0.05; **P < 0.01; ***P < 0.001.
Figure 3
Figure 3. Prophylactic Ang2 blockade dampens inflammatory responses of immune cells in the SCs of EAE mice.
(A) T-distributed stochastic neighbor embedding (t-SNE) analysis of main immune cell clusters in the SCs of mIgG1- versus Ang2 Ab– treated EAE mice at 14 dpi and single transgenic control versus EC-Ang2 EAE mice at 12 dpi. Heatmap showing log2 expression of known marker genes for each cluster. (B and C) Relevant GO biological processes of significantly (adjusted P < 0.05) downregulated genes after Ang2 blockade and upregulated genes after Ang2 overexpression in microglia (B) and macrophages (C). (D and E) Venn diagram illustrating the number of genes that were regulated by Ang2 in microglia and macrophages. (F) Violin plots showing mRNA expression of significantly (adjusted P < 0.05) downregulated APOE-induced and MHCII-associated genes after Ang2 blockade. IgG, mIgG1; A2, Ang2 Ab. (G) Representative images and quantifications of MHCII immunostaining in Iba1+ cells in the SCs of mIgG1- versus Ang2 Ab–treated EAE mice at 14 dpi (n = 10 per group) and control (n = 7) versus EC-Ang2 (n = 8) EAE mice at 12 dpi. Scale bars: 100 μm. (H) Representative flow cytometry overlay plots and quantifications showing GMFI of MHCII expression in microglia and macrophages in the SCs of mIgG1- versus Ang2 Ab–treated EAE mice at 14 dpi (n = 10 per group) and control versus EC-Ang2 EAE mice at 12 dpi (n = 8 per group). Mean ± SEM, 2-tailed Student’s t test (G and H). *P < 0.05; **P < 0.01.
Figure 4
Figure 4. Prophylactic Ang2 blockade inhibits α5β1 integrin activation in the SCs of EAE mice.
(A) Violin plots showing expression of Angpt2 and its receptors Tek, Itga5, and Itgb1 in EC, microglia, and macrophage clusters of mIgG1- and Ang2 Ab–treated EAE mice. (B) GMFI of Tie2 and α5 integrin on the surface of ECs, macrophages, and microglia from naive versus EAE mice (naive, n = 4; EAE, n = 3) at 14 dpi as analyzed by flow cytometry. (C) Flow cytometric analysis of active cell surface integrin (FN7-10 binding) relative to total cell surface α5β1 integrin in microglia and macrophages from mIgG1- and Ang2 Ab–treated EAE mice (mIgG1, n = 8; Ang2 Ab, n = 7) at the disease peak (16 dpi). Mean ± SEM, 2-way ANOVA with Bonferroni’s post hoc test for multiple comparisons (B) and 2-tailed Student’s t test (C). *P < 0.05; ***P < 0.001.
Figure 5
Figure 5. Prophylactic Ang2 blockade suppresses vascular inflammation in the SCs of EAE mice.
(A and B) t-SNE analysis of the main EC clusters (venous and arterial) in the SCs of mIgG1- versus Ang2 Ab–treated EAE mice at 14 dpi and single transgenic control versus EC-Ang2 EAE mice at 12 dpi. capillary-V, capillary-venous; capillary-A, capillary-arterial. (C) Heatmap showing log2 expression of known marker genes in each cluster. (D and E) Relevant GO biological processes of significantly (adjusted P < 0.05) downregulated genes after Ang2 blockade (D) and upregulated genes after Ang2 overexpression (E) in the SC capillary-venous ECs. (F) Venn diagram illustrating the number of genes that were regulated by Ang2 in the SC capillary-venous ECs. (G) Violin plots showing Vcam1 expression in different EC clusters as well as its differential expression in capillary-venous ECs regulated by Ang2. (H and I) Representative images (EAE) and quantification of VCAM1 in the SC blood vessels of mIgG1- versus Ang2 Ab–treated control (n = 6 per group) and EAE (n = 10 per group) mice at 14 dpi and control versus EC-Ang2 control (Ctrl, n = 3; EC-Ang2, n = 4) and EAE (Ctrl, n = 7; EC-Ang2, n = 8) mice at 12 dpi. Scale bars: 100 μm. Mean ± SEM, 2-way ANOVA with Bonferroni’s post hoc test for multiple comparisons (H and I). ***P < 0.001.
Figure 6
Figure 6. Prophylactic Ang2 blockade improves vascular integrity in the SCs of EAE mice.
(A and B) Representative images and quantifications of Evans blue leakage in the SCs of naive (n = 3), mIgG1- versus Ang2 Ab–treated EAE mice (n = 5 per group) and control versus EC-Ang2 control (n = 6 per group) and EAE (n = 7 per group) mice at 12 dpi. (C) Representative images and quantification of extravascular TER-119+ RBCs in the SCs of control (n = 6) versus EC-Ang2 (n = 8) EAE mice at 12 dpi. Scale bars: 100 μm. Mean ± SEM, 1- or 2-way ANOVA with Bonferroni’s post hoc test for multiple comparisons (A and B) and 2-tailed Student’s t test (C). *P < 0.05; **P < 0.01; ***P < 0.001.
Figure 7
Figure 7. Prophylactic ABTAA induces Tie2 activation and ameliorates EAE.
(A) Clinical scores and percentages of body weight loss of mice induced with active EAE and treated with hIgG1 versus ABTAA prophylactically (Ab administration started at the time of EAE induction, 0 dpi) (n = 10 per group). (B) Tie2 phosphorylation in the lungs of EAE mice treated with hIgG1 versus ABTAA prophylactically (n = 3 per group) at 14 dpi by immunoprecipitation and Western blot (WB) detections with anti-phosphotyrosine (pY) and anti-Tie2 Abs. (C) Representative images and quantification of P-selectin in the SC blood vessels of hIgG1- versus ABTAA-treated EAE mice (n = 7 per group) at 14 dpi. Scale bars: 100 μm. Mean ± SEM, nonparametric Mann-Whitney U test (A, comparison of AUC values of clinical EAE scores over the disease course), 2-way repeated measures ANOVA (A, percentage of body weight loss), 1-way ANOVA with Bonferroni’s post hoc test for multiple comparisons (B), and 2-tailed Student’s t test (C). *P < 0.05; **P < 0.01.

References

    1. Abbott NJ, Patabendige AA, Dolman DE, Yusof SR, Begley DJ. Structure and function of the blood-brain barrier. Neurobiol Dis. 2010;37(1):13–25. doi: 10.1016/j.nbd.2009.07.030. - DOI - PubMed
    1. Larochelle C, Alvarez JI, Prat A. How do immune cells overcome the blood-brain barrier in multiple sclerosis? FEBS Lett. 2011;585(23):3770–3780. doi: 10.1016/j.febslet.2011.04.066. - DOI - PubMed
    1. Constantinescu CS, Farooqi N, O’Brien K, Gran B. Experimental autoimmune encephalomyelitis (EAE) as a model for multiple sclerosis (MS) Br J Pharmacol. 2011;164(4):1079–1106. doi: 10.1111/j.1476-5381.2011.01302.x. - DOI - PMC - PubMed
    1. Saharinen P, Eklund L, Alitalo K. Therapeutic targeting of the angiopoietin-TIE pathway. Nat Rev Drug Discov. 2017;16(9):635–661. doi: 10.1038/nrd.2016.278. - DOI - PubMed
    1. Parikh SM. Angiopoietins and Tie2 in vascular inflammation. Curr Opin Hematol. 2017;24(5):432–438. doi: 10.1097/MOH.0000000000000361. - DOI - PMC - PubMed

Publication types

MeSH terms