

Association Between Clinical Biomarkers and Optical Coherence Tomography Angiography Parameters in Type 2 Diabetes Mellitus
- PMID: 32150245
- PMCID: PMC7401845
- DOI: 10.1167/iovs.61.3.4
Association Between Clinical Biomarkers and Optical Coherence Tomography Angiography Parameters in Type 2 Diabetes Mellitus
Abstract
Purpose: To investigate the clinical significance of the changes in the macular microvasculature in patients with diabetes mellitus type 2 without diabetic retinopathy.
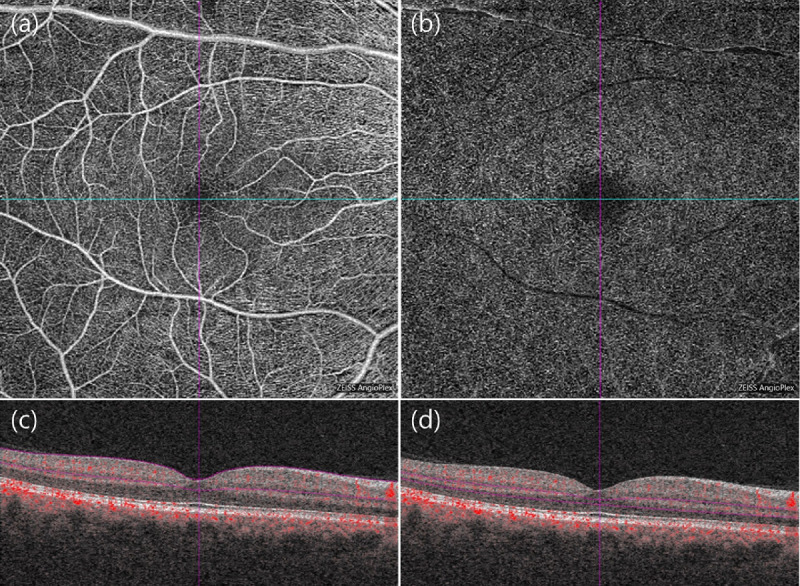
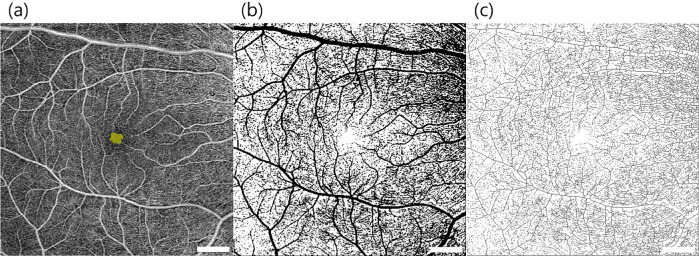
Methods: Fifty-five patients with diabetes mellitus type 2 without diabetic retinopathy and 48 healthy individuals were enrolled in a prospective cross-sectional study. We identified the changes of optical coherence tomography angiography parameters (foveal avascular zone [FAZ] area and circularity, vessel density, and perfusion index) of the 6 × 6-mm macular scan. Correlation and multiple regression analyses were performed between optical coherence tomography angiography parameters and previously known diabetes mellitus type 2-related demographic and systemic characteristics, and serum biochemical markers.
Results: FAZ parameters and perfusion index of the superficial and deep vascular plexus showed significant correlation with serum insulin level, and homeostasis model assessment indices. In multiple linear regression analysis, low insulin levels predicted increased FAZ areas in both the superficial (β = -0.007; P = 0.030) and deep layers (β = -0.010; P = 0.018) and a decreased perfusion index in the deep layer (β = 0.003; P = 0.001).
Conclusions: The expansion and loss of circularity of the FAZ and the decrease in the perfusion index may be affected by insulin resistance and secretory capacity in patients with diabetes mellitus type 2 with no diabetic retinopathy.
Conflict of interest statement
Disclosure:
Figures
References
-
- Chen Q, Ma Q, Wu C, et al.. Macular vascular fractal dimension in the deep capillary layer as an early indicator of microvascular loss for retinopathy in type 2 diabetic patients. Invest Ophthalmol Vis Sci. 2017; 58: 3785–3794. - PubMed
-
- Tang F, Cheung CY. Quantitative retinal optical coherence tomography angiography in patients with diabetes without diabetic retinopathy. Invest Ophthalmol Vis Sci. 2017; 58: 1766. - PubMed
-
- Kwon J, Choi J, Shin JW, Lee J, Kook MS. Alterations of the foveal avascular zone measured by optical coherence tomography angiography in glaucoma patients with central visual field defects. Invest Ophthalmol Vis Sci. 2017; 58: 1637–1645. - PubMed
MeSH terms
Substances
LinkOut - more resources
Full Text Sources
Medical
